Global models of runaway accretion in white dwarf debris disks
Abstract
A growing sample of young white dwarfs (WDs) with metal-enriched atmospheres are accompanied by excess infrared emission, indicating that they are encircled by a compact dusty disk of solid debris. Such ‘WD debris disks’ are thought to originate from the tidal disruption of asteroids or other minor bodies. However, the precise mechanism(s) responsible for transporting matter from the disruption radius to the WD surface remains unclear, especially in those systems with the highest inferred metal accretion rates g s-1, which cannot be explained by Poynting-Robertson (PR) drag alone. Here we present global time-dependent calculations of the coupled evolution of the gaseous and solid components of WD debris disks. Solids transported inwards (initially due to PR drag) sublimate at tens of WD radii, producing a source of gas that both accretes onto the WD surface and viscously spreads outwards in radius, where it overlaps with the solid disk. Our calculations show that if the aerodynamic coupling between the solids and gaseous disks is sufficiently strong (and/or the gas viscosity sufficiently weak), then gas builds up near the sublimation radius faster than it can viscously spread away. Since the rate of drag-induced solid accretion increases with gas density, this results in a runaway accretion process, as predicted by Rafikov, during which the WD accretion rate reaches values orders of magnitude higher than can be achieved by PR drag alone, consistent with the highest measured values of . We explore the evolution of WD debris disks across a wide range of physical conditions and describe the stages of the runaway process in detail. We also calculate the predicted distribution of observed accretion rates , finding reasonable agreement with the current sample. Although the conditions necessary for runaway accretion are at best marginally satisfied given the minimal level of aerodynamic drag between circular gaseous and solid disks, the presence of other stronger forms of solid-gas coupling—such as would result if the gaseous disk is only mildly eccentric—substantially increase the likelihood of runaway accretion.
Keywords:
White dwarfs — Accretion, accretion disks — Protoplanetary disks1 Introduction
A significant fraction percent of white dwarfs (WDs) with metal-enriched atmospheres (DZ type) and cooling ages 0.5 Gyr are accompanied by excess infrared (IR) emission (Zuckerman & Becklin 1987; Graham et al. 1990; Kilic et al. 2005; von Hippel et al. 2007; Kilic & Redfield 2007; Farihi et al. 2009; Debes et al. 2011; Debes et al. 2011). This emission is well modeled as WD radiation reprocessed by an optically-thick, geometrically-thin disk of refractory material (Jura 2003; Jura et al. 2007; Jura et al. 2007). Modeling of the IR spectral energy distribution [SED] shows that the inner edge of the disk resides at several tens of WD radii , close to where the equilibrium temperature K is sufficiently high to sublimate silicate dust grains. The outer edge of the disk is also well constrained by the SED at longer wavelengths, with its radius typically found to exceed by a factor of several (e.g. Jura et al. 2007; Jura et al. 2009; Debes et al. 2011).
No evidence is found for disk flaring from the SEDs of most systems (cf. Jura et al. 2007), consistent with the disk material being concentrated in a thin, optically-thick layer similar to the rings of Saturn (Cuzzi et al., 2010). High-resolution spectroscopy with IRS on the Spitzer Space Telescope reveals an emission feature at m, indicating the presence of small, micron-sized silicate dust particles (Jura et al., 2009). Though small dust is clearly present in some disks, the detailed distribution of particle sizes is not well constrained.
Several WDs with dusty disks also possess gaseous disks (Melis et al., 2010), as inferred by the detection of double-peaked emission lines of Ca II and Fe II (Gänsicke et al. 2006; Gänsicke et al. 2007; Gänsicke et al. 2008). These features clearly indicate a Keplerian disk composed primarily of gaseous, high-Z elements (no H emission lines have yet been detected) which is radially coincident with the dusty disk (Melis et al., 2010). Although most DZ WDs display no detectable emission lines, gaseous disks could in principle be more common because the disk line emission is easily overwhelmed by continuum emission from the WD photosphere.
Jura (2003) proposed that compact disks of metals around WDs are produced by the tidal disruption of asteroids or other minor bodies. A plausible source of such rocky bodies are objects placed onto low periastron orbits by gravitational perturbations from giant planets which have survived the AGB phase of the WD progenitor (Duncan & Lissauer 1998; Debes & Sigurdsson 2002). Disks formed this way are often termed ‘debris disks’ since they result from the destruction of larger bodies, despite the fact that many of their properties (e.g., typical distance from the star, optical depth) are very different from conventional debris disks around young main sequence stars (Wyatt, 2008) as well as the much larger (tens of AU) debris disks around very young, hot ( K) WDs (Chu et al., 2011). A tidal disruption origin naturally explains why the outer radii of observed disks R⊙ are similar to the Roche radius of a self-gravitating object of typical density few g cm-3, where is the WD mass.
Asteroid-fed disks are also a promising explanation for the metals in the atmospheres of DZ WDs (Jura, 2003), which otherwise are rapidly depleted by gravitational settling on a timescale much shorter than the WD age (e.g. Paquette et al. 1986). One can estimate the [appropriately time-averaged] metal accretion rate in individual WD systems by combining the observed photospheric metal abundances with theoretical estimates of the mass in the outer convective zone of the WD and the settling times of heavy elements (e.g. Koester & Wilken 2006; Koester 2009). Values estimated in this way fall within the relatively wide range g s-1 (Farihi et al. 2009; Farihi et al. 2010).
Several additional lines of evidence now support the asteroid disruption model for WD debris disks and metal pollution. First, both gaseous and dusty disks are found exclusively around metal-rich WDs: from the statistics of systems observed with Spitzer, Farihi et al. (2009) estimate that of DAZ WDs host compact debris disks, yet no evidence is found for disks around WDs without metal pollution (e.g. Hansen et al. 2006; Mullally et al. 2007). Farihi et al. (2010) also found a strong positive correlation between the presence of a compact debris disk and the metal accretion rate . The mass in the outer convective zone of many WDs is similar to that of an asteroid of several hundred km size, similar to Ceres or Vesta, while the relative abundances of several elements heavier than He are indeed similar to those in Solar System bodies formed interior to the ice line, such as the Earth, Moon, and asteroids (Jura 2006; Zuckerman et al. 2007; Klein et al. 2010; Zuckerman et al. 2010). Finally, the chief alternative theory for WD metal pollution, accretion from the interstellar medium, is now challenged by a variety of observations (e.g. Koester & Wilken 2006; Kilic & Redfield 2007; Jura et al. 2009).
Despite growing evidence in support of the asteroid tidal disruption model, it remains unclear precisely what mechanism(s) are responsible for transporting metals from the disrupted ring of solids (with characteristic radius of several tens of ) to the WD surface at the observed rates. The goal of this paper is to address this question with fully self-consistent global numerical models of the coupled evolution of the solid and gaseous components of WD debris disks.

1.1 Summary of Previous Work
We begin by summarizing previous theoretical work on accretion in WD debris disks. As mentioned above, the inner edge of the solid disk is located near the sublimation radius (Rafikov 2011a)
| (1) |
where is the sublimation temperature of silicate grains (we assume here that particle’s emissivities for starlight and for its own thermal radiation are the same). Adopting a typical value for the WD radius (Ehrenreich et al., 2011) one finds R⊙, consistent with observations (Jura et al. 2007; Jura et al. 2009).
It is worth noting that fitting the SEDs in some WD systems requires an unphysically high sublimation temperature (e.g. Jura et al. 2007; Brinkworth et al. 2009; Dufour et al. 2010; Melis et al. 2010). This suggests that other physics, such as a high particle albedo or conduction in the gas phase (Jura et al. 2007), may play an important role, thereby calling the validity of equation (1) into question. These complications do not, however, affect the conclusions of this work since hereafter we scale all relevant distances to without specifying what physics sets its value.
The sublimation of solid particles produces a source of metallic gas at . Viscosity redistributes gas from this location, producing an extended disk that transports mass from to the stellar surface . If one assumes that the disk is turbulent, with an effective viscosity characterized by the conventional -parametrization (Shakura & Sunyaev, 1973), then the viscous time at the sublimation radius is given by
| (2) |
where is the gas sound speed; is the gas temperature, normalized to a value characteristic of the range K set by the balance between photoionization heating and metal line cooling (Melis et al., 2010); is mean molecular weight, normalized to a value characteristic of pure Si; is the Keplerian angular velocity; and is normalized to a value somewhat lower than that expected to result from MHD turbulence in fully ionized disks (e.g. Davis et al. 2010), an assumption we discuss further in .
Equation (2) shows that the viscous timescale is relatively short compared to other timescales of relevance, such as the total disk lifetime, which is typically estimated to be yr (Farihi, private communication). In most cases the accretion rate onto the stellar surface is thus ultimately controlled by the rate at which solids reach , not by the maximum rate of gas accretion set by viscosity. A key theoretical question is thus how solids are transported to the sublimation radius at rates consistent with the range of values g s-1 inferred from observations.
One mechanism of solid disk evolution is angular momentum transport due to the interaction between disk particles (e.g. physical collisions), in full analogy with the rings of Saturn. However, as we show in Appendix A (see also Farihi et al. 2008), for realistic assumptions about the size distribution and mass of the debris disk, the timescale of this process is generally too long, resulting in a negligible accretion rate .
Another more promising mechanism to drive solids inwards is Poynting-Robertson (PR) drag. Rafikov (2011a) (hereafter R11a) demonstrated that PR drag produces accretion rates up to g s-1, where is the maximum PR accretion rate for an optically thick disk of solids (as defined by eq. [3] below) and is the WD luminosity (see eq. [22]). Bochkarev & Rafikov (2011) (hereafter BR11) followed this work by computing global models of the disk evolution under the action of the PR drag. By considering a variety of initial conditions, including both optically-thin and -thick debris disks, they showed that the results of R11a hold quite generally.
Figure 1 shows the measured distribution of WD metal accretion rates from the samples of Farihi et al. (2009) and Farihi et al. (2010). We normalize to calculated using equation (22; to be introduced later in ), assuming (eq. [1]) and using the measured effective temperature of each WD in the sample. Figure 1 shows that a significant fraction of those WD systems with an IR excess (indicative of ongoing metal accretion) have consistent with the characteristic accretion rate due to PR drag (R11a; BR11). On the other hand, PR drag alone is insufficient to explain the highest observed rates g s found in the tail of the distribution in Figure 1.
Rafikov (2011b) (hereafter R11b) recently proposed a model for the coupled evolution of the solid and gaseous components of WD accretion disks which can in principle explain even these highest accretion rates. The key idea is that a fraction of the gas created at the sublimation radius viscously spreads outwards in order to carry away the angular momentum of the accreting gas (Pringle 1981). The solid and gaseous disks thus overlap at radii , providing an natural explanation for their observed radial coincidence (e.g. Melis et al. 2010). Drag forces between the solid and gaseous disk in this region, resulting from their different rotation rates, act to enhance the rate at which solids lose angular momentum and accrete over the rate provided by PR drag alone. This scenario results in a feedback process, and potential ‘runaway’, because the enhanced rate of solid sublimation increases the accumulation of gas near the sublimation radius, which in turn enhances the strength of drag and rate of solid accretion. Using a local model applied to the evolution of the optically thick disk of solids evolution near its inner radius, R11b showed that during such a runaway can exceed by orders of magnitude the accretion rate set by PR drag alone.
R11b has shown that the full range of accretion rates in Figure 1 can in principle be reconciled with the asteroid debris disk model. However, the R11b model is limited by several simplifying assumptions, including its entirely local (‘one zone’) nature. A more detailed, global model of the gaseous and solid disk evolution is necessary to verify and generalize these conclusions.
1.2 This Paper
In this paper we present one-dimensional calculations of the coupled evolution of the solid and gaseous components of WD debris disks. Our goal is to test the runaway accretion model of R11b and to begin to address observational tests, such as the expected fraction of metal-bearing WDs with and without observable debris disks and the predicted distribution of accretion rates to compare with data, such as that shown in Figure 1.
The paper is organized as follows. In we overview the model, describing in our baseline description of the aerodynamic coupling between gaseous and solid disks. In we present the equations governing the evolution of the coupled gas and solid disks, including an estimate of characteristic values of the dimensionless parameters of the model (). In we present our numerical calculations and describe our results. In we present applications of our results. These include a comparison between the true accretion rate and that approximated using the commonly adopted assumption of steady-state accretion (); and predictions for the accretion rate distribution from an ensemble of debris disk systems (). In we discuss our results, including a critical assessment of whether the necessary conditions for runaway are achieved in WD debris disks. We also discuss several extensions of our standard model, including the effects of an eccentric gaseous disk () and the WD magnetic field (). In we provide a bulleted summary of our conclusions.
Appendices of this paper contain a number of important auxiliary results, including an evaluation of the role of collisional viscosity in driving the accretion of solids (Appendix A); calculation of the viscous evolution of a disk with a power law viscosity and mass sources (Appendix B); an analytical derivation of the runaway condition in a simplified but fully global model of disk evolution (Appendix C); and a calculation of the aerodynamic coupling between a solid disk and an eccentric gaseous disk (Appendix D). Our results in Appendix B may find useful applications in studies of accretion disks beyond the scope of this work.
2 Summary of the model

We now overview the basic model, which is illustrated schematically in Figure 2. Initially a solid debris disk forms at radii cm from the tidal disruption of a rocky body. We characterize the solid debris disk by its surface density and optical depth
| (3) |
where is the fiducial surface density at which , and few g cm-3 and are the bulk density and characteristic size, respectively, of disk particles. The initial distribution of solids depends on the details of the tidal disruption process and the properties (e.g., mass, composition, and tensile strength) and incident orbit of the disrupted body (e.g. Debes et al. 2012).
Solids accrete inwards, initially due entirely to PR drag, creating gas at the sublimation radius cm (eq. [1]). The temperature of the gas K is higher than that of the solids ( K) due to differences in their heating and cooling processes (Melis et al., 2010). The aspect ratio of the gaseous disk is typically small, but the disk scale-height cm is still much larger than that of the particulate disk, which (with the possible exception of small dust particles) appears to be well settled into the midplane.
Due to angular momentum transport by turbulent viscosity, the gaseous disk accretes both inwards to the WD surface cm and spreads outwards to radii , where it overlaps with the solid disk. If the rate of solid accretion evolves slowly compared to the viscous time, then the gas surface density (proportional to optical depth ) develops a power-law radial distribution, with a break in the power-law index at the sublimation radius (see Appendix B). Drag on the solids due to interaction with the gaseous disk enhances the rate of solid accretion.
Note that in this work we do not consider the possibility of gas production due to particle collisions, as suggested by Jura (2008), Farihi et al. (2009), since, as we demonstrate in §6.4, this mechanism cannot maintain the continuous production of metallic gas on a sufficiently long timescale.
We now discuss one physical mechanism for coupling the dynamics of the solid and gaseous disks: aerodynamic drag. As will be shown later in , aerodynamic drag is most effective at the innermost radius where the solid disk becomes optically thick ().
2.1 Aerodynamic Coupling
The angular velocity of the gaseous disk is slightly lower than the Keplerian rate at which the solid particles orbit due to the radial pressure gradient in the gaseous disk, , where and are the midplane gas pressure and density, respectively.11 1 In places hereafter where the distinction between and is not important, we simply refer to the angular rotation rate . This results in an azimuthal velocity difference given by
| (4) | |||||
where (assuming independent of radius)
| (5) |
is a dimensionless parameter set by the radial pressure distribution. Here and are the surface density and vertical scale-height of the gas disk, respectively.
The importance of shear between the solid particles and gaseous disk was first recognized in the context of protoplanetary disks (Whipple 1972) and is now widely believed to result in a variety of important effects, such as the inward migration of solids (Weidenschilling, 1977), excitation of turbulence near the disk midplane (e.g. Cuzzi et al. 1993), and streaming instabilities in the disk of solids (Youdin & Goodman 2005; Johansen et al. 2007).
2.1.1 Optically Thick Disks ()
One of the most important (and also most uncertain) issues is the strength of the coupling between the gaseous and solid disks. When the optical depth of the solid disk is high (), its geometry may be idealized as that of a solid plate with a zero-slip boundary condition at its surface. In reality, of course, the disk is not a perfectly smooth plate; its surface may, for instance, contain structures similar to those observed in the rings of Saturn, such as wakes, vertical particle motions, particle ‘pileups’, and other highly inhomogeneous small-scale surface density features (Cuzzi et al., 2010). These complications introduce significant uncertainty when calculating the drag force acting on the debris disk.
Even if the idealization of a smooth plate is adopted, one must determine whether the gaseous layer above the plate is laminar or turbulent. A similar issue was first addressed by Goldreich & Ward (1973), who showed that if the gaseous disk remains laminar, then the velocity shear between the two disks is restricted to within the Ekman layer of vertical thickness
| (6) |
where is the molecular shear viscosity in the disk (not to be confused with the turbulent viscosity ), is the molecular mean free path, and is the molecular cross section. The gas surface density near the sublimation radius can be estimated using the expression appropriate for steady-state accretion (e.g. Frank et al. 2002; see also eq. [82]),
| (7) | |||||
where we have assumed and have substituted equation (2) for , adopting fiducial parameters of , K and .
For cm-2, , and the typical range of measured WD accretion rates g s-1, equation (6) shows that the Ekman layer thickness cm is generally much smaller than the disk scale-height cm. For the same parameters, the Reynolds number of the Ekman layer is estimated to be
| (8) |
Under terrestrial conditions, both numerical calculations (Coleman et al., 1990) and experiments (Faller, 1963) find that is necessary for the Ekman layer to become turbulent. At first glance it thus appears that the gas layer above the debris disk is laminar.
In astrophysical disks, however, the Ekman layer may be susceptible to Kelvin-Helmholtz (KH) instabilities (Goldreich & Ward, 1973). If one assumes momentarily that fluid in the shear layer is incompressible (), then the Richardson number of the Ekman layer is given by
| (9) |
where is the vertical gravitational acceleration near the midplane and we have made the approximations and . Again adopting the fiducial parameters and range of accretion rates given above, one finds , indicating that the flow is grossly KH unstable and must be turbulent.22 2 A similar conclusion does not apply under terrestrial conditions because and the gravitational acceleration on Earth is times higher than in WD debris disks.
If the flow over the disk surface is turbulent, then the force per unit surface area is given by (Goldreich & Ward 1973)
| (10) |
where Re is a proportionality constant. Estimates of the value of Re⋆ in the case of a smooth solid plate vary significantly in the literature, ranging from Re (Dobrovolskis et al., 1999) to Re (Goldreich & Ward, 1973). Even given this uncertainty, the smooth plate model probably underestimates the true drag, since the surface of a particulate disk is not continuous. As we describe below, in some cases the gas-solid interaction may be better described as that due to a combination of individual particles, in which case the effective value of Re⋆ may be much smaller.
2.1.2 Optically Thin Disks ()
In the opposite limit of an extremely optically thin disk (), debris particles interact with the gas individually. The speed of gas relative to solids in this case is just (eq. [4]), since the particles do not disturb the mean gas flow appreciably. The drag force per unit surface area for optically-thin disks is then
| (11) |
where is the drag force on an individual particle of size .
The magnitude of depends on two key parameters (Whipple 1972; Weidenschilling 1977): (1) the ratio of particle size to the molecular mean free path ,
| (12) |
and (2) the particle Reynolds number
| (13) |
where in equation (12) we have substituted equation (7) for , and in our numerical estimates we again adopt characteristic values for the relevant parameters at .
Equation (13) shows that is satisfied for and the range of accretion rates g cm-3 provided that the typical particle size obeys cm. Assuming that this condition is indeed satisfied (consistent with observations, Graham et al. 1990; see also §6), then the interaction of gas with individual particles is in the laminar regime. The drag force in this case, in the Stokes () and Epstein () regimes, respectively, is given by the expression
| (14) |
These two limits are readily combined into a single formula
| (15) |
which substituted into equation (11) gives the force per area
| (16) |
2.1.3 Connecting the Optically-Thin and -Thick Regimes
A comparison of our expressions for the drag force in the optically-thick (eq. [10]) and optically-thin (eq. [16]) regimes shows that they do not match smoothly at , since in general one expects Re, while varies independently. This mismatch is not unexpected, since the transition regime is precisely where the smooth-plate approximation breaks down. In reality there is an intermediate range of optical depths, between and some lower value , between which the solid-gas coupling is not well described as either drag on a continuous entity, nor as the sum of incoherent forces on individual particles. The relative velocity between the gas and particle disk in this regime also lies somewhere between zero (the no-slip boundary condition realized in the case of a smooth plate) and (eq. [4]).

In this work we do not model this poorly understood intermediate regime of gas-particle interaction in detail. Instead we adopt the following simple formula for the drag force, which interpolates smoothly between optically thick and optically thin limits:
| (17) | |||||
| (18) |
where
| (19) |
Although equation (17) reduces to equation (10) when , it considerably underestimates the drag force for as compared to equation (16). This point is illustrated in Figure 3, in which we compare our approximation of the drag force in equation (17) to a schematic representation of the more realistic drag behavior, which properly reduces to equations (10) and (16) in the optically thick () and thin () limits, respectively. Although there are modest differences between these expressions at small values of , equation (17) nevertheless does reproduce the qualitative scaling in the optically thin regime, which is the most important property for the purposes of our current work. As we describe in , this distinction between “weak” () and “strong” () coupling has an important role in the build-up to runaway in the accretion disk evolution.
Although our numerical calculations focus on aerodynamic coupling of the above form, in principle other forms of drag may be present, such as enhanced drag due to an eccentric gas disk () or electromagnetic inductive coupling with an external magnetic field (). To the extent that the drag force remains proportional to the local gas mass, an expression of the form in equation (18) may be applicable to these cases as well, provided that an appropriate alternative expression is substituted for equation (19).
3 Coupled evolution of the particulate and gaseous disks
In this section we present the equations governing the solid and gaseous disks, including their angular momentum exchange due to aerodynamic drag and mass exchange due to sublimation.
3.1 Solid Disk
The evolution of the solid disk obeys the continuity equation
| (20) |
where is the mass flux through the solid disk and the function accounts for sources or sinks of solid mass, such as dust sublimation or gas condensation.
The mass flux consists of several components
| (21) |
which include the mass flux due to PR drag (R11a)
| (22) |
where (Friedjung 1985)
| (23) |
is the incidence angle of the stellar radiation with respect to the flat disk midplane. Note that depends on the optical depth to stellar light arriving at grazing incidence angle .
A second contribution to the mass flux results from aerodynamic drag by the gas disk (R11b):
| (24) |
where we have substituted equation (17) for from . The factor in equation (24) depends on the specific form of aerodynamic drag. In general we assume this function scales as a power law with radius:
| (25) |
where is a constant that depends on the drag law. If is constant with radius, our fiducial drag law given in equation (17) implies , a value we therefore adopt throughout the remainder of this paper.
From equation (24) one can define the sublimation time as the timescale on which the characteristic gaseous mass near the sublimation radius is replenished by accretion due to aerodynamic drag (in the optically thick regime ) alone:
| (26) |
where and in evaluating (eq. [24]) we have set . Note that this timescale is independent of .
The final contribution to the mass flux in equation (21) accounts for the possible condensation of gas. This process necessarily exchanges angular momentum between the gas and solid disks, thus driving additional solid accretion. In this paper we neglect condensation by setting (see ). However, once an expression for is given, the resulting expression for is easily calculable.
3.2 Gaseous Disk
The gaseous disk also evolves according to the continuity equation (Lin & Papaloizou 1996)
| (27) |
where is again the turbulent viscosity and
| (28) |
is the torque per unit area on the gaseous disk due to the back-reaction from the aerodynamic drag force (eq. [17]) acting on the solid disk. In Appendix C we explore a global model with back-reaction neglected () and demonstrate that the main evolutionary features are still preserved even in this simplified setup.
The function represents sources and sinks of gaseous mass. The most important source of gas is that due to sublimation, which we assume is sharply localized at and is proportional to the rate of solid accretion :
| (29) |
where is the Dirac delta function.
We assume that the gas temperature and sound speed are independent of radius, in which case the turbulent viscosity may be written:
| (30) |
where in general we allow the dimensionless -parameter to vary with radius, denoting .
3.3 Dimensionless Equations
We now bring the equations from the previous two sections into dimensionless form. We first introduce several new definitions:
| (31) | |||
| (32) | |||
| (33) |
noting in particular that we express time in units of the viscous time at (eq. [2]) and radius in units of the location of the inner edge of the solid disk (eq. [1]).
We also introduce two key parameters: the feedback parameter
| (34) |
and the Poynting-Robertson (PR) parameter
| (35) |
As we will show in , the feedback parameter has an important qualitative effect on the evolution of WD debris disks, in particular by controlling whether and when runaway accretion occurs. The physical interpretation of the PR-parameter is less clear, but roughly speaking it represents the ratio of the timescale for disk replenishment due to the gas drag-assisted accretion of solids (eq. [26]) to the timescale on which the gas disk can be replenished by PR drag alone, given a marginally optically-thick disk (mass ) concentrated near the sublimation radius. Note that (1) depends on (eq. [3]) and is thus sensitive to the particle size ; (2) from equations (33) and (35) it follows that .
Given these definitions, we now recast the evolutionary equations from and in dimensionless form. First, the evolution of the solid disk (eq. [20]) can be written
| (36) |
where the various contributions to the mass flux of solids are now
| (37) | |||
| (38) | |||
| (39) |
with
| (40) |
3.4 Characteristic Values of Key Parameters
We now estimate characteristic values of the key parameters in our model, which are useful for scaling our solutions in to arbitrary physical situations.
First, we estimate the characteristic accretion rate set by PR drag under optically-thick conditions (eq. [32])
| (43) |
where (eq. [31]), and we have again assumed .
Using our fiducial model for aerodynamic drag given in equation (19), the feedback parameter (eq. [34]) can be written
| (44) | |||||
Depending on the uncertain value of Re (see discussion in ), equation (44) shows that strong feedback requires a rather low value of the viscosity at the sublimation radius. We will discuss the value of in actual debris disk systems further in .
Finally, we estimate characteristic values of the PR parameter (eq. [35])
| (45) | |||||
where we have used the definitions for (eq. [32]), (eq. [3]), (eq. [34]), and (eq. [1]). Note that the above estimate is independent of the specific model for aerodynamic drag, except implicitly through the value of . Although appears to depend sensitively on the WD effective temperature and the inner radius of the solid disk, if the latter coincides with the sublimation radius (eq. [1]) then the dependence becomes less sensitive, .
4 Numerical Calculations
In this section we present our numerical calculations of WD debris disk evolution.
4.1 Technical Preliminaries
We evolve the gas surface density (eq. [41]) using the 2N-RK3 scheme described in Brandenburg (2003). The solid surface density (eq. [36]) is evolved as described in BR11. The gas and solid evolution are coupled at each timestep by the aerodynamic torque (eq. [38]) and the point source of gas due to sublimation (eq. [42]). We adopt a logarithmic radial grid that extends from a location near the WD surface (), out to a radius that at all times safely exceeds the outer edge of the solid distribution ().
The initial gas density is set equal to zero at all radii, , while different initial distributions (e.g., “gaussian ring” and “top-hat”) are adopted for the dust surface density, as described below. The inner boundary condition on is set to enforce a constant mass accretion rate across the ghost zones using the value in the first active zone, while is interpolated across the outer boundary. We confirm that our results are insensitive to the precise boundary conditions adopted. We have also verified that the code conserves total mass and angular momentum by checking that any decreases in their values with time are compensated by their fluxes across the inner grid cell (see Metzger et al. 2009).
4.2 Optically Thin Ring


We begin by considering the evolution of a thin ring of solid debris with an initial radial profile of the form
| (46) |
where and specify the ring center and its radial thickness, respectively. Although the distribution of solid debris following the tidal disruption of an asteroid may not be well described by a gaussian ring, we focus initially on this simple distribution because it allows us to explore the dependence of the disk evolution on the characteristic optical depth and location of the solid material. In physical units the total mass in the initial disk is given by
| (47) | |||||
where we have used the definition (eq. [3]) and have assumed characteristic values for and g cm-3.
Figure 4 shows our calculation of the evolution of an optically thin ring with , and , corresponding to g for cm. Note that in this example the solid disk is optically thin both in the vertical direction () and horizontally to the incident stellar radiation, for which the condition is instead relevant (see eq. [22] and surrounding discussion). We adopt typical values for the parameters (eq. [45]), (eq. [23]), and (eq. [44]), the latter allowing for the possibility of strong gas-solid feedback. Solid and dashed lines show the radial distribution of and , respectively, at several times (in units of the viscous time at ) with different colors. Figure 5 shows the gas accretion rate at the inner boundary in units of the optically-thick PR rate (eq. [32]).
Figures 4 and 5 illustrate that the evolution of is very similar to the case without gas drag, as explored previously by BR11. BR11 show that when the disk is optically thin with at all radii (as satisfied in this case), the dust at radius accretes on a characteristic timescale set by PR drag
| (48) |
where is the accretion rate due to PR drag in the optically-thin limit (eq. [22]) and we have used the definitions in equations (35), (23) and (34) for the dimensionless parameters , , and , respectively. Note that although we scale to the viscous time in equation (48) to compare most easily with our numerical results, we emphasize that the accretion time in the optically thin case depends solely on the rate of PR drag when .
As time advances, the solid ring thus drifts inwards and broadens, the latter simply because the accretion timescale decreases , consistent with the evolution of in Figure 4. Substituting the relevant parameters, equation (48) predicts that the most of the solids reach on a timescale which is set by the initial peak of the dust distribution . This estimate agrees well with the timescale that the gas accretion peaks in our solution (Fig. 5), as is expected because gas accretion rate at the origin faithfully tracks the rate of solid sublimation when the latter varies on timescales greater than the viscous time .
We conclude that gas coupling does not significantly affect the evolution of optically-thin debris disks. We have confirmed this by running an otherwise identical calculation with the gas coupling turned off, i.e. artificially setting the term . We find a negligible difference between the solutions with and without gas drag, even though ‘feedback’ is nominally strong ().
Figure 4 also shows the evolution of the gas surface density . At times when the rates of gas sublimation and accretion evolve relatively slowly, the density profile is well described by a broken power-law distribution (for ) and () for . As shown in Appendix B, this profile is consistent with steady-state analytic solutions of the diffusion equation (eq. [27] with ) given a viscosity of the form ( for an isothermal -disk model assumed here) and a constant source of mass at (see eq. [82]). Solid-gas coupling thus also has little impact on the gas distribution in optically-thin debris disks.
4.3 Optically Thick Ring


Although gas drag has no significant effect on the evolution of optically-thin disks, it can be substantially more important for optically-thick disks. Figure 6 shows our calculation of the disk evolution in the case of an initially optically-thick ring of dust (), again calculated for characteristic parameters , , , , but now for only marginally strong feedback . The top panel shows the full calculation including gas drag in the same format as Figure 4, while for comparison the bottom panel shows for the same calculation with the drag artificially turned off. Figure 7 shows the gas accretion rate onto the WD surface as a function of time for both cases.
First note from Figure 6 that, in cases both with and without gas drag, the disk develops an extremely sharp profile near its outer edge. This sharp cut-off results from the exponential saturation of the accretion rates both due to PR drag (eq. [22]) and due to aerodynamic drag (eq. [24]), which are significantly more effective per unit mass in optically-thin regions of the disk. Since the outer edge of the initial solid distribution is necessarily optically thin, this results in a pile-up of material at the location where the outer edge becomes moderately optically thick (BR11).
Figures 6 and 7 also illustrate the dramatic effect that gas drag has on the disk evolution. Again, in the cases both with and without drag, the distribution of solids initially develops an optically-thin ‘tail’ () at radii between the sublimation point and the innermost location where the disk first becomes optically thick .
Without gas drag (panel b) the tail supplies an accretion rate from the optically thick disk to the sublimation radius which is approximately constant in time and radius. As shown in BR11, its value is set by the rate due to PR drag from the inner edge of the optically-thick ring. The timescale for the entire ring of dust to accrete through the tail is thus given by
| (49) |
where is the total disk mass from equation (47) and we have used the definition of from equation (35). Substituting the relevant parameters for the above calculation (; ; ; ) one finds a long accretion timescale and a relatively low accretion rate , both consistent with the results of the “Without Gas Drag” case shown in the top panel of Figure 7.
With gas drag, however, the evolution of is dramatically altered (top panel). Instead of the accretion rate remaining approximately constant in time, Figure 7 shows that initially increases exponentially on a timescale (a ‘build up’ stage), before ‘running away’ at a super-exponential rate. During this process the entire solid disk is consumed on a timescale which is a factor times shorter than in the case without gas drag, with the accretion rate during the final runaway reaching a peak value times higher than the PR rate. As discussed in , such a runaway process was predicted by R11b, who showed that if feedback is strong (; ) then the surface density of gas builds up near the sublimation radius due to drag-induced accretion faster than it can be reduced by viscous diffusion. Because the drag-induced accretion rate is itself proportional to the gas surface density (eq. [24]), the build-up of mass at radii results in a runaway.
Our results confirm that a runaway occurs, but the details of the process differ somewhat from those predicted by R11b. The simplified ‘one zone’ model of R11b assumed that the solid disk at radii is at all times optically thick. When the rate of gas drag accretion (eq. [24]) saturates at the maximum value, such that runaway grows on the sublimation timescale (eq. [26]). In our calculation, however, Figure 7 shows that the runaway is delayed until a timescale which is much longer than . As we now discuss, this delay occurs because the solids at radii are initially part of the optically-thin tail created by PR-drag, which couples relatively weakly to the gas.
Although gas drag is weak just outside the sublimation radius where , the gas distribution extends to radii due to viscous spreading (see eq. [51] below), where it overlaps with the optically-thick solid disk. Figure 6 shows that the drag force between this gas tail and solids at the inner edge of the optically-thick disk creates an “enhancement” in the solid profile with . The ‘build-up’ stage occurs as this enhancement moves inwards with time. Finally, once the enhancement reaches the sublimation radius, the condition is satisfied and the full runaway occurs in much the same way as predicted by R11b, albeit after a much longer delay time .
The delay until runaway can be estimated as the time required for the mass associated with to propagate from to at the rate set by gas drag accretion :
| (50) |
where we have used the definitions of , , from equations (25), (35), and (34), respectively. We calculate (eq. [24]) using the analytic expression for the gas surface density
| (51) |
derived in Appendix B (eq. [82]) assuming for (eq. [30]) and approximating the sublimation rate by its initial PR-driven value . We also adopt appropriate for (eq. [5]).
In order to verify that the above explanation is self-consistent, one must check that the accretion rate due to aerodynamic drag indeed exceeds that due to PR drag at the inner edge of the optically thick disk. Their ratio is given by
| (52) |
where we have again assumed and made use of equations (25), (34), and (24) for , , and , respectively. Equation (52) confirms aerodynamic drag is at least comparable to PR drag for , thus demonstrating that the conditions necessary to ‘trigger’ a runaway are satisfied rather generically (see also Appendix C). Also note that the fact that rapidly increases with confirms our implicit assumption that the runaway timescale is dominated by the earliest times when is largest.
For parameters relevant to the above calculation (; ; = 5) equation (50) predicts a runaway timescale , consistent with the results shown in Figure 6 to within a factor .
The bottom panel in Figure 7 shows the fraction of accreted mass as a function of time for the same calculation. Note that only per cent of the total disk mass is accreted during the build-up stage, with the majority instead consumed during the final runaway. The maximum accretion rate achieved during runaway can be estimated by assuming that the entire solid disk mass (eq. [47]) is consumed on the viscous time (eq. [2]):
| (53) |
Unlike in cases without gas feedback, for which the accretion rate is limited to the maximum rate set by PR drag , note that is proportional to the total disk mass and hence can substantially exceed . Also note, however, that equation (53) applies only to systems well above the runaway threshold (; see below), for which (without gas coupling; eq. [49]), such that most of the total mass is indeed accreted during the final runaway.
Figure 8 shows , calculated for several models using the same parameters as in Figures 6 and 7 (; ; ) but for different values of the feedback parameter . Note that runaway occurs only for , remarkably similar to the threshold predicted by R11b. Also note that the delay timescale to runaway scales , consistent with the analytic prediction in equation (50). The rise time of the accretion rate from zero to the PR value during the initial build-up phase also varies with the parameters and , as determined instead in this case by the optically-thin accretion time (eq. [48]).
Figures 9 and 10 show similar results, but now calculated assuming lower values for the PR parameter and , respectively. In both cases we again find that is a good estimate of the threshold for runaway, and we confirm that , as predicted by equation (50).
A final important feature of our results is the sensitive dependence of the runaway timescale on the innermost radius where the disk becomes optically thick (eq. [50]). Figure 11 shows our results for from a series of calculations identical to those shown in Figure 8, except calculated for an initial gaussian ring centered at a smaller radius . The evolution of is qualitatively similar to that shown in Figure 8 for a ring centered at , except that the runaway time occurs an order of magnitude sooner, consistent with the ratio predicted by equation (50).
Figure 6a also shows that when gas drag is important the radial profile of does not follow a single power law for , as it does without gas drag, see Figures 4 & 6b. Instead, decays slower with at distances where there is overlap between gas and the optically thick segment of the disk of solids. This is understood to be a direct consequence of the back-reaction of the aerodynamic drag on the gaseous disk, i.e. the non-trivial in equation (27).


4.4 Optically Thick Top-Hat
Our calculations have thus far focused on the idealized case of a gaussian ring for the initial dust radial profile (eq. [46]). However, the same qualitative results, including the runaway process, are of general applicability. To illustrate this point, in Figures 12 and 13 we show the gas/dust evolution and gas accretion rate for a calculation which assumes that the initial distribution of solids instead has a ‘top hat’ profile, characterized by a constant value of from to . We again assume characteristic values for the parameters , , and . Though still highly idealized, a top-hat distribution of solids spread over a factor of a few in radii is probably a more accurate description of the initial distribution of solids following the tidal disruption of a minor body.
Figure 12 shows that the disk evolves in a qualitatively similar fashion to the gaussian ring shown in Figures 6 and 7. In particular, an optically thin tail develops initially, which later increases due to gas drag, before a runaway occurs at once solids with reach the sublimation radius. The timescale until runaway can again be reasonably well estimated using the analytic estimate in equation (50), provided that one replaces the inner radius of the optically-thick ring with the inner radius of the initial optically-thick top-hat distribution.
We conclude that the runaway accretion of solids due to gas drag is an inevitable fate for optically-thick disks in the presence of strong feedback . With everything else fixed, the timescale for runaway depends on the minimum radius of the optically-thick material (eq. [50]), while the maximum accretion rate depends on the mass of the solid disk (eq. [53]).


5 Applications and Observational Tests
In this section we present applications of our calculations and observational implications of the runaway accretion model.
5.1 True Vs. ‘Measured’ Accretion Rate
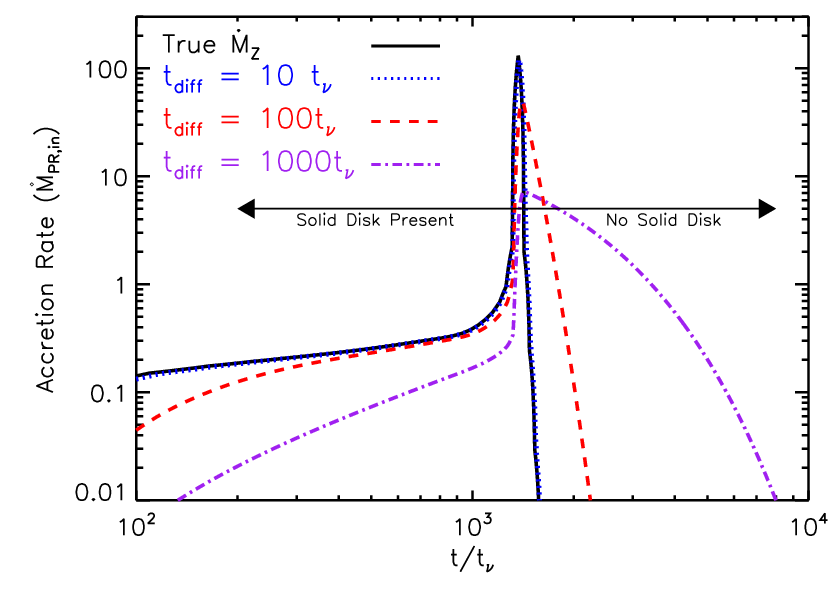
Because the timescale required for heavy elements to diffuse below the outer convective zone of the WD is much shorter than the WD age, metals observed at the surface indicate recent pollution by an external source, such as accretion from a gaseous disk. Under the joint action of accretion and gravitational settling, the total mass of metals in the convective zone with charge evolves according to (e.g. Koester & Wilken 2006)
| (54) |
where , is the mass fraction of metal in the accreting gas, and is the settling (or diffusion) time of element , which depends on the temperature and composition of the WD (e.g. Paquette et al. 1986). A typical WD of mass , for instance, requires yrs and yrs to cool to a temperature K and K, respectively (Bergeron et al., 1995). In a H-rich atmosphere (DAZ WDs), over this time interval the settling times of most observed elements increase from days to years. For a He-rich atmosphere (DBZ WD), by contrast, the convective zone is much larger, resulting in a much longer settling time yrs, which depends less sensitively on temperature (Paquette et al., 1986).
Gas is fed from the sublimation radius to the WD surface on the viscous time (eq. [2]). If , then the atmospheric composition reaches a steady state , in which the mass in the convective zone is approximately given by . Since the surface composition is measured via spectral line diagnostics and theoretical models of the total mass in the WD convective zone, and is also calculable from the known properties of the WD, then the total instantaneous gas accretion rate in this limit is well estimated by the expression (e.g. Koester & Wilken 2006; Farihi et al. 2009)
| (55) |
Equation (55) provides a reliable estimate of in the case of hot DAZ WDs (which easily satisfy ), but it can be grossly inaccurate in the opposite limit that , as may apply to DBZ or cool DAZ WDs.
Figure 14 illustrates this point in the context of our models by showing a comparison of the actual gas accretion rate from our fiducial solution from Figure 6 to the ‘measured’ value one obtains by naively applying equation (55), the latter shown for different assumptions about the ratio . We calculate by integrating equation (54) directly, assuming that and using derived from our calculations shown in Figure 7.
In the case that , Figure 14 shows that ‘measured’ accretion rate indeed accurately reflects the true instantaneous accretion rate. On the other hand, when , and may differ substantially. In particular, prior to the time when peaks, underestimates the true accretion rate by a factor up to . Since this epoch corresponds to when the solid disk is still present, our results suggest that one should exercise caution when interpreting the accretion rates in those systems with an observed IR excess when . On the other hand, at times after peaks, instead overestimates the true accretion rate. This discrepancy is one explanation for those systems shown in Figure 1 with high measured accretion rates , yet no IR excess indicating the current presence of a solid disk.
One concrete application of the results in Figure 14 is to cool DBZ WDs with large , for which one predicts that underestimates the true current accretion rate for systems with detected near-IR excesses (indicating a current solid disk), whereas instead overestimates in DBZ WD systems without solid disks. Note also that since the ratio of the inferred accretion rates of different elements is subject to similar uncertainties, one should also exercise caution when using similar methods to infer the precise composition of the accreted bodies in systems for which (cf. Xu & Jura 2011). Previous works have attempted to generalize estimates of to cases when (or to constrain the entire accretion history of the event), by adopting simplified assumptions about the time evolution of the accretion rate (e.g. Jura et al. 2009), e.g. ], where is the accretion timescale. However, given the complicated accretion evolution in cases when feedback is effective, we again urge caution when adopting such simplified models.
We conclude with one final point regarding what inferences can be drawn about the past accretion history of a WD using the currently ‘measured’ accretion rate given by equation (55). Equation (54) can be trivially integrated to give the mass of metals with charge in the WD atmosphere as a function of time, provided that the evolution of the true accretion rate is known:
| (56) |
where we have assumed that at time . If we define to be the maximum value reached by the true accretion rate in the past, then one estimates that
| (57) | |||||
such that for any one has
| (58) |
Thus, the currently ‘measured’ value of always provides a lower limit on the maximum achieved in the past. Conversely, for any given ‘measured’ value of one can deduce that during some epoch in the past the true mass accretion rate was at least as high as .


5.2 Accretion Rate Distribution
Given a complete model for the evolution of WD debris disks, one can begin to address observational questions, such as the probability of detecting a WD debris disk system when the accretion rate has some particular value. Figures 15-17 show several such examples of the normalized distribution log of observed accretion rates . Each distribution is created using a single disk evolution calculation from , under the highly idealized assumptions that (1) all WD debris disks are identical to the model from which each distribution was created; and (2) the system is equally likely to be detected at any moment during active gas accretion. Although neither of these assumptions is likely valid, these distributions nevertheless inform what kinds of debris disk systems could contribute to the observed distribution of accretion rates shown in Figure 1.
Figure 15 shows the distribution calculated for two cases without runaway accretion: the optically-thin () gaussian ring shown in Figures 4 and 5 (blue line); and the optically-thick () gaussian ring without strong feedback () shown in Figures 6 and 7 (black line). In both cases the distribution is fairly narrowly concentrated about the characteristic accretion rate set by PR drag acting alone. Accretion rates at the low end of the measured values in Figure 1 are thus consistent with resulting from a superposition of such systems, as may result e.g. from a range in the masses or orbital parameters of disrupted asteroids. However, disk evolution without runaway accretion cannot explain the highest observed accretion rates .
Figures 16-18 show the accretion rate distribution (solid black line) for several disk evolutions with runaway accretion. In these cases we further divide the distribution between those times when the solid disk is still present (solid red line) and those times after it has completely sublimated (solid blue line). Also plotted for comparison with a dashed red line is the normalized distribution of measured WD metal accretion rates shown in Figure 1 from the sample of Farihi et al. (2009); Farihi et al. (2010), including just those systems with an IR excess. Note that our results correspond to the true accretion rate , while the observational sample uses the ‘measured’ rates (see §5.1). Thus, one should exercise caution when comparing them.
Figure 16 shows the fiducial case of an optically-thick gaussian disk (, ; ; ), as shown in Figures 6a and 7. The probability distribution in this case still peaks at a relatively low accretion rate set by the characteristic range in accretion rate during the ‘build-up’ to runaway. However, the final stages in runaway process produces a substantial ‘tail’ in the distribution extending to much higher accretion rates .
Although small number statistics and potential selection effects introduce many uncertainties, note the overall qualitative similarity between the shapes of the theoretical and observed accretion rate distributions. Somewhat better agreement with the observed distribution is obtained for disks formed with more compact inner radii, as shown in Figures 17 and 18 for the cases of a gaussian ring centered at (Fig. 7) and the top hat distribution with from to (Fig. 13), respectively. The top hat distribution in particular illustrates the broad accretion rate distribution produced by even an ensemble of identical systems in the (most physically realistic) case of a radially-extended disk that undergoes runaway accretion.
Figures 16-18 also illustrate that the probability of detecting actively accreting systems when the solid disk is still present (solid red line) is much greater than after the solid disk has entirely sublimated (solid blue line). We caution, however, against attaching much significance to a direct comparison between our predictions for the fraction of actively accreting systems without solid disks and the fraction of metal-rich WDs with no detected IR excess, given potential selection effects and other ways that IR emission could be difficult to detect even in systems with disks (see Fig. 15 and ).
6 Discussion
Our results demonstrate that runaway accretion is a ubiquitous feature in the evolution of WD debris disks with strong gas-solid coupling and/or weak gas viscosity. We find that the condition for runaway predicted by R11b using local calculations is a surprisingly accurate diagnostic of the runaway threshold.
In Appendix C we present and analyze a simple global analytical model of the coupled evolution of the two disks which makes two simplifying assumptions: (a) that the back-reaction of aerodynamic drag on the gaseous disk can be neglected and (b) that the disk of solids is always optically thick at . Even though this model is fully global and far more realistic compared to the calculations done in R11b we are still able to derive from it analytically the runaway condition (eq. [91]), which is essentially analogous to . This additionally reaffirms the robustness of the runaway threshold found in R11b and this work.
Is physically realizable in WD debris disk systems? If one adopts our standard model for the aerodynamic drag between solid and gaseous disks described in , then satisfying this condition requires gas viscosity near the inner edge of the disk (see eq. [44] and surrounding discussion). At first glance this condition appears unlikely to be satisfied because the gas temperature is sufficiently high that thermal ionization should be efficient, whereas observations of fully-ionized accretion disks (King et al., 2007) and numerical simulations of the magneto-rotational instability (MRI) in ideal MHD (e.g. Fromang & Papaloizou 2007; Davis et al. 2010) typically suggest higher values of .
Note, however, that gas and solids overlap at the radii in our model and Spitzer observations reveal that micron-size dust grains are present in many systems (Jura et al., 2009). The presence of small dust in the disk can significantly lower the ionization fraction below the nominal equilibrium value because small grains are very efficient at absorbing charge. Even though the observationally inferred mass of micron-size Si grains ( g, (Jura et al., 2009)) is much less than that of a sizeable asteroid thought to give rise to a solid disk, small grains may still dominate the total surface area of particles. A lower free charge density increases the resistivity of the gas, which in turn reduces the effective turbulent viscosity by suppressing the MRI due to non-ideal MHD effects (e.g. Fleming et al. 2000). The relevant value of in our model could thus be much lower than would be expected in a fully ionized disk, thus making strong feedback much more likely.
In addition to lowering the viscosity, the runaway condition could also be satisfied if the interaction between gas and solids is stronger than is assumed in our baseline model in . Below we describe two such additional mechanisms for solid-gas coupling: enhanced aerodynamic drag due to an eccentric gaseous disk () and ‘inductive coupling’ by a magnetic field threading the disk (). Accounting for these additional possibilities, it appears quite possible that the conditions for runaway accretion are actually achieved in Nature.
Our model provides useful predictions for the properties of gaseous disks fed by sublimation which may be verified by observations. In particular, equation (7) suggests a characteristic estimate of the gas surface density at for . The value of at this location can easily be higher than g cm-2 if exceeds , as should be the case during runaway (but note that it is the true rate that sets , see §5.1 for details). We also point out that viscous evolution in our model naturally results in the profile of which is shallower for than for , see equation (82) and Figure 2. This implies that the gas mass inside the cavity of the disk of solids is lower than one would naively assume, which might help explain the observed lack of line emission from this region of the gaseous disk (Melis et al., 2010).
The lifetime of disks that undergo runaway accretion is set predominantly by the delay timescale until runaway given in equation (50). Substituting the values of (eq. [2]) and (eq. [35]) into this expression one finds that
| (59) |
where we have adopted characteristic values for the gas temperature K, solid particle density g cm-3, and mean molecular weight . We normalize the inner edge of the optically thick disk to a characteristic value which best reproduces the observed WD accretion rate distribution (Fig. 17). Note that is independent33 3 As shown in Figure 3 our drag law underestimates aerodynamic coupling in the optically thin case. In reality coupling is stronger and this may lower the disk lifetime to some extent. of the (uncertain) strength of the disk viscosity and the precise form of the drag force between the solids and gas (except implicitly through the value of ).
The lifetimes of WD debris disk are poorly constrained by observations, but one can set a rough upper limit of yr (Kilic et al. 2008; Farihi et al. 2009; Farihi, private communication). Equation (59) shows that this constraint translates into an upper limit on the characteristic particle size cm. For (as required for runaway to occur in the first place) one thus requires particles with a typical size several cm, consistent with (relatively weak) existing observational constraints (e.g. Graham et al. 1990; Jura et al. 2007).
An important outstanding question is why some WDs with high inferred accretion rates have no detected IR excess. Our calculations in predict that the total fraction of actively accreting systems without solid disks should be relatively small, typically 20 per cent. As discussed in , one possible explanation in the case of systems with long metal diffusion times (as characterize WDs with cool temperatures and/or He-enriched atmospheres) is the discrepancy between the true instantaneous WD accretion rate and the value inferred using atmospheric abundances and the steady-state approximation. Figure 14 shows that for , the accretion rate inferred using the steady-state model can remain at a high level for a timescale comparable to or longer than the disk lifetime itself even after the solid disk has completely sublimated.
Another possible explanation for high- systems without an IR excess is that a solid disk is in fact present but cannot be detected, for instance because of a poor viewing angle and/or because the disk is concentrated in a narrow ring of width (Farihi et al. 2010). Our calculations in Figures 6 and 12 confirm that this is a viable possibility by showing that optically-thick disks largely maintain their original width, until the end of the disk lifetime when the runaway process is nearly complete.
We conclude by addressing several extensions to our standard model and outstanding issues to be explored further in future work.
6.1 Effects of Non-Circular Gas Motion
Our calculation of aerodynamic drag in §2.1 explicitly assumed that both the solid and gaseous material move on purely circular orbits, in which case the difference in azimuthal velocity between the disks is due solely to the pressure support in the gaseous disk (eq. [4]). Since this velocity difference is relatively small (compared to, say, the orbital velocity), then the resultant aerodynamic coupling between the disks is not very strong. For this reason runaway accretion may require special circumstances, such as a low viscosity in the gaseous disk.
At the same time, however, the Ca II emission lines from some WD systems are observed to have asymmetric shapes (Gänsicke et al. 2006; Gänsicke et al. 2007). These have been interpreted as due to non-circular motions in the gaseous disk, with Gänsicke et al. (2006) for instance fitting the Ca II line profiles from WD SDSS 1228+1040 as arising from a disk with eccentricity . If this interpretation is correct, then the assumption of purely circular gas motion is not justified in at least some WD systems.
If the gas disk is eccentric (even if the origin of the eccentricity is unknown) then one must re-evaluate the drag force calculation from to account for non-circular motions. In Appendix D we carry out such a calculation, in particular demonstrating that in the small- limit () the orbit-averaged azimuthal force can be written by analogy with equation (18) as , see equation (101), where now the coupling constant is
| (60) |
The ratio of to the coupling constant defined by equation (19) is
| (61) |
As a result, even a small eccentricity of the gaseous streamlines (which is about at the the inner disk edge) is sufficient for non-circular gas motions to dominate over the azimuthal velocity difference resulting due to gas pressure support for purposes of coupling the gaseous and solid disks.
Using equations (34) and (60) we can estimate the feedback parameter for coupling due to the non-circular gas motions:
| (62) | |||
where we have again adopted fiducial values for , K and .
This expression shows that non-circular gas motions are extremely efficient at driving the runaway evolution of the debris disks, with even slightly eccentric () gas motions resulting in very strong feedback. In fact, this coupling may be too effective in the sense that implies a very short timescale on which the particulate disk evolves due to coupling during the runaway. The duration of the build-up phase is also lowered for , see equation (59). Measurements of line asymmetries in WD gaseous disks typically imply if one interprets asymmetry as due to eccentric gas motions (e.g. for SDSS 1228+1040 [Gänsicke et al. 2006] and for SDSS 0845+0855 [Gänsicke et al. 2007]). In the latter case the inferred eccentricity would be so high as to result in relative velocity between the gas and particle disks hundreds of km s-1. How such a highly supersonic velocity difference could be maintained in practice is not clear, unless the orbits of the solid particles are extremely closely aligned with the eccentric trajectory of the gas, which appears unlikely because of dissipative collisions between particles (see §6.4). It is furthermore unclear how the particle disk could avoid being destroyed by the enormous aerodynamic drag in this system, or by sputtering of the particle surfaces by the gas.
These considerations lead us to believe that the line asymmetries observed in the spectra of gaseous WD disks result not from actual non-circular gas motions, but rather as the result of a non-axisymmetric surface brightness over the face of the disk. Non-axisymmetric brightness patterns, resulting e.g. due to spiral waves or other instabilities which produce an azimuthally varying surface density distribution or line excitation conditions, could explain the observed line asymmetries without invoking highly non-circular gas motions. Hartmann et al. (2011) demonstrate that this is indeed possible.
To summarize, we conclude that the actual deviations of gas motions from purely circular in WD disks are probably not as dramatic as has been inferred based on eccentric disk models, and most likely correspond to . Equation (62) nevertheless shows that even weakly non-circular gas motions could easily result in drag sufficient to produce runaway disk evolution, thus supporting the general picture outlined in Rafikov (2011b). Additional work is clearly required to identify what mechanisms are capable of driving such non-circular gas motions.
6.2 White Dwarf Magnetic Field
We have thus far neglected the possible effects of the WD magnetic field on the disk evolution. If the WD field is sufficiently strong, it may, for instance, disrupt the gaseous disk above the WD surface, channeling matter onto the surface along the magnetic poles, as in magnetic cataclismic variables.
Assuming that at large radii the WD magnetic field is dipolar with a surface field strength , then the magnetosphere and disk stresses balance at the Alfven radius given by (e.g. Ghosh & Lamb 1978)
Equation (6.2) shows that for typical accretion rates in WD debris disks g s-1, fields as small as kG are sufficient to affect the flow near the sublimation radius .
The surface magnetic field strengths of isolated WDs inferred from Zeeman (spectro-)polarimetry show a wide range of values, from ‘high field’ WDs with G (Wickramasinghe & Ferrario, 2000), to only upper limits of kG in most other systems (e.g. Schmidt & Smith 1995; Gänsicke et al. 2007). Overall the distribution of field strengths appears to be well characterized by a power-law distribution with index for kG (Fabrika & Valyavin 1999). However, the peak and average of the distribution both occur at lower fields than can be measured and hence are not well constrained. Although few DZ WDs have measured magnetic fields, note that at least a few systems, G165-7 and G77-50, have strong surface fields kG (Dufour et al. 2006) and kG (Farihi et al. 2011), respectively.
It thus seems possible that the WD magnetic fields could affect a significant fraction of debris disks.44 4 Caveats include that (1) current measurements constrain the total surface field, of which the dipole may only be a minor component; (2) the magnetic field could be systematically lower in actively accreting systems if, for instance, the field is ‘buried’ by diamagnetic screening (e.g. Cumming et al. 2001). If a dynamically important magnetic field threads the gaseous or solid disk, this may complicate the picture of disk evolution presented in this paper. If then matter interior to the Alfven radius is channeled directly onto the WD surface, creating an inner ‘hole’ in the gaseous disk. If , then matter may be placed onto field lines as soon as it sublimates at . Since viscous spreading is no longer required to carry away the angular momentum of the accreted gas (which is instead extracted by magnetic torques and used to spin-up the WD), then the picture of overlapping gas and solid disks, and the resulting model of runaway accretion developed in this paper, might no longer remain valid. An important caveat, however, is if small dust particles in the disk suppress the ionization fraction of the gas, as discussed earlier in this section. In this case the magnetic field may not couple efficiently to the gaseous disk, negating the influence of even a strong field. A more detailed model of the coupled evolution of small dust, gas-field coupling, and the MRI in the sublimation layer will be required to address the flow structure in this region and the resulting influence on the accretion evolution.
If the WD magnetic field is sufficiently strong to disrupt the gaseous disk, then it may also affect the rate of solid accretion via ‘inductive’ coupling (Drell et al. 1965; Gurevich et al. 1978). Because the WD rotates at a different (typically much lower) angular velocity than the accretion disk, this differential rotation produces an electric field in frame of the rotating particles of order , where is the velocity at which the magnetic field sweeps through particles. If the WD magnetosphere is loaded with dense enough plasma supplying abundant free charges then this electric field not only polarizes debris particles but also induces a DC current through them. This current in turn couples to the magnetic field, resulting in the azimuthal drag force on the solid particles. The strength of this inductive coupling depends on the conductivity of particles and is rather uncertain. We leave a more detailed analysis of this coupling mechanism to future work.
6.3 Problem of Condensation
The spatial coincidence of gaseous and particulate debris disks around WDs poses an interesting problem.55 5 We are grateful to Bruce Draine for directing our attention to this issue. Quite generally one expects that the debris particles and gas will have the same chemical composition, since the latter originates from the former (by evaporation in our model, or by sputtering as in Jura 2008). It is then not clear how two separate phases of the same material — solid and gaseous — can exist simultaneously in stable phase equilibrium.
Indeed, the temperature of the solid particles is necessarily below the sublimation temperature , while the surrounding gas is likely to be hotter than (Melis et al., 2010). Atoms of gas should stick upon colliding with the surface of debris particles, resulting in condensation with a probability equal to the accommodation coefficient . The rate of condensation from the gas phase per unit area of the solid surface is (assuming a solid debris disk with ), such that the gas disk should be depleted on a timescale . Even if is as small as (its value is typically higher; see Leitch-Devlin & Williams 1985), then the entire gaseous disk should still condense within several hundred orbital time scales. The latent heat released during this process may somewhat slow down the rate of condensation, but ultimately cannot prevent it.
Observations showing that the gaseous and solid components overlap in WD debris disks (Brinkworth et al. 2009; Melis et al. 2010) demonstrate that this simple logic is somehow flawed. However, at the moment we do not have a satisfactory explanation for this puzzle of condensation.
6.4 Production of Metallic Gas by Particle Collisions
Our work assumes that all metallic gas in the disk results from the sublimation of solids at the inner edge of the particulate disk (in 3.1 we allowed for the possibility of gas condensation at larger radii as described in , but we did not explore this possibility in detail). However, previous authors (Jura 2008; Farihi et al. 2009) have suggested that gas can also be produced by high-velocity collisions between solid particles within the debris disk. These authors argue that, due to the large orbital speed hundreds km s-1, even moderately non-circular particle motions (corresponding to orbital eccentricities as low as ) result in particle collisions with sufficiently high velocity of several km s-1 to effectively sputter, or even vaporize, solids into metallic gas. This process of gas creation was envisioned to operate continuously throughout the entire solid disk, thereby naturally explaining the observed radial coincidence66 6 In our model this overlap is naturally achieved as a result of viscous spreading of the gaseous disk (see §2). between solid and gaseous disks (Melis et al. 2010).
We believe that this mechanism is unlikely to be an important source of gas production, even on timescales short compared to the disk lifetime. Observations indicate (Jura 2003; Jura et al. 2007) that WD debris disks are typically optically thick, i.e. . It is well known (Goldreich & Tremaine 1978; Farihi et al. 2008) that under such circumstances the characteristic timescale between the pairwise particle collisions is comparable to the local orbital period, which is less than an hour in the present context. If particles are indeed continuously being converted to gas via binary collisions, then the whole disk of solid debris should be converted into gas within just a handful of collision timescales, i.e. day! This is in contradiction with the fact that the NIR excesses observed around many WDs are persistent for at least decade-long timescales.
Even if gas production via collisions is highly inefficient, such that only a small fraction of the solid mass is converted into gas in every collision (as would be necessary to extend the lifetime of the solid disk), then collisions are still incapable of providing a steady source of gas. This is because high relative velocities between particles are quickly damped (again, on a timescale of several orbits) due to the inelastic nature of particle collisions (Goldreich & Tremaine, 1978). As a result, the solid disk rapidly settles into a dynamically cold configuration, similar to the rings of Saturn (for which the particle velocity dispersion is only cm s-1; Cuzzi et al. 2010), thereby eliminating the possibility of additional destructive high-velocity particle collisions.
Despite these objections, collisional gas production is likely to be important during and immediately following the tidal disruption of the asteroid-like body by the WD, which could last for several orbital timescales of the incoming body, i.e. tens to hundreds of years. During this stage, collisions may occurs between large solid objects at relative speeds of many km s-1, resulting in a large fraction of the total solid mass being converted into gas. Some of this gas will re-condense onto the surfaces of surviving particles, with the rest accreting onto the WD on the [relatively short] viscous timescale (see eq. [2]).
To summarize, the arguments presented above strongly argue against the possibility that sustained, long-term (comparable to the disk lifetime yr) gas production in WD debris disks results from inelastic solid particle collisions.
7 Summary
| Accretion Regime | Disk Lifetime | Peak |
|---|---|---|
| ()‡ | () | |
| Optically Thin () | ||
| Optically Thick () | ||
| Weak Feedback () | ||
| Strong Feedback () |
†Expressions are given in terms of (1) characteristic radius and radial thickness of the initial solid disk, in units of the inner edge of the disk (eq. [1]); (2) viscous time at the inner disk edge (typically yr, depending on viscosity ; eq. [2]); (3) characteristic accretion rate due to optically-thick PR drag (typically g s-1; eq. [43]); (4) dimensionless parameters introduced in , including the feedback parameter (eqs. [34,44]), PR-parameters (typically ; eqs. [31,45]), and the incidence angle of WD radiation (typically ; eq. [31]). ‡ We express time in the useful combination , which takes on the numerical value yr for typical parameters (independent of the strength of the viscosity or the mechanism coupling solids and gas), where is the characteristic particle size.
The growing number of ‘debris disks’ detected around WDs provides a unique opportunity to study the physics of the interaction between solid and gas disks in a way complementary to the study of normal debris disks around pre-main sequence stars. As a likely repository for minor bodies originating from the outer stellar system, these disks also provide an indirect probe of the dynamics of planetary systems around evolved stars. As such, they also indirectly inform our knowledge of the fraction of the intermediate-mass stars harboring planets.
One of the biggest mysteries regarding known WD debris disk systems is the wide range of metal accretion rates, in particular those extending to much higher values than can be explained by Poynting-Robertson drag alone (see Fig. 1). In this paper we have begun to address this and other issues using global calculations of the coupled evolution of gaseous and solid components of WD debris disks. Table 1 summarizes the key properties of different regimes of accretion in WD debris disks. Our primary conclusions are summarized as follows:
- •
The observed coexistence of gas and dust in WD debris disks (Melis et al. 2010) naturally results from viscous spreading of gas created at the sublimation radius.
- •
Drag between the gaseous and solid disks leads to an enhanced accretion rate over that set by PR drag alone. Our results in show that the disk evolution in the presence of strong aerodynamic drag is dramatically altered from cases without drag (see Fig. 6-13). We confirm the mode of ‘runaway’ accretion predicted by R11b when the rate of drag-induced accretion exceeds the rate at which viscosity spreads gas away. The threshold for runaway is well described by the condition (eq. [34]) for a variety of different configurations of solids (see also Appendix C).
- •
The runaway process is characterized by two stages (Fig. 7): (1) an initial ‘build-up’ phase, during which an optically-thick disturbance with moves inwards from the inner edge of the optically thick disk; (2) a ‘run-away’ phase characterized by super-exponential increase in the accretion rate, once is satisfied near the sublimation radius.
- •
The predicted distribution of measured accretion rates given an ensemble of optically-thick WD debris disks undergoing evolution leading to runaway is broadly consistent with the shape of the current observational sample (Figs. 16-18). Most observed systems are predicted to have accretion rates in the range , but a smaller tail of the distribution comprising percent of systems should extend to higher accretion rates.
- •
Satisfying the runaway condition in WD debris disks requires a low value for the disk viscosity and/or strong solid-gas coupling (eq. [44]). A low viscosity could result if the MRI is suppressed due to low ionization caused by the presence of small dust grains.
- •
The runaway condition could also be satisfied even for higher viscosity if the strength of solid-gas coupling is stronger than our baseline model for aerodynamic drag presented in . In and Appendix D we show that even a mildly eccentric gaseous disk results in a stronger drag force than our baseline model. These results also suggest that the observed asymmetries in WD emission lines are unlikely to result from highly eccentric disks, but instead may result from non-axisymmetric disturbances in the disk surface brightness (e.g. spiral wave patterns).
- •
- •
The steady-state assumption commonly adopted to calculate WD metal accretion rates (eq. [55]) may be inaccurate when the settling time of metals in the WD convective zone , resulting in some cases in an over- or under-estimate of the true instantaneous accretion rate by an order of magnitude or more (Fig. 14). This is a possible explanation for even heavily metal-rich WDs with no current IR excess in cases for which the metal diffusion time is comparable to the disk lifetime.
Acknowledgments
BDM is supported by NASA through Einstein Postdoctoral Fellowship grant number PF9-00065 awarded by the Chandra X-ray Center, which is operated by the Smithsonian Astrophysical Observatory for NASA under contract NAS8-03060. Financial support for RRR is provided by the Sloan Foundation, NASA via grant NNX08AH87G, and NSF via grant AST-0908269.
References
- Bergeron et al. (1995) Bergeron P., Saumon D., Wesemael F., 1995, ApJ, 443, 764
- Bochkarev & Rafikov (2011) Bochkarev K. V., Rafikov R. R., 2011, ApJ, 741, 36
- Brandenburg (2003) Brandenburg A., 2003, Computational aspects of astrophysical MHD and turbulence. p. 269
- Brinkworth et al. (2009) Brinkworth C. S., Gänsicke B. T., Marsh T. R., Hoard D. W., Tappert C., 2009, ApJ, 696, 1402
- Chu et al. (2011) Chu Y.-H., Su K. Y. L., Bilikova J., Gruendl R. A., De Marco O., Guerrero M. A., Updike A. C., Volk K., Rauch T., 2011, AJ, 142, 75
- Coleman et al. (1990) Coleman G. N., Ferziger J. H., Spalart P. R., 1990, Journal of Fluid Mechanics, 213, 313
- Cumming et al. (2001) Cumming A., Zweibel E., Bildsten L., 2001, ApJ, 557, 958
- Cuzzi et al. (1993) Cuzzi J. N., Dobrovolskis A. R., Champney J. M., 1993, Icarus, 106, 102
- Cuzzi et al. (2010) Cuzzi J. N., et al., 2010, Science, 327, 1470
- Daisaka et al. (2001) Daisaka H., Tanaka H., Ida S., 2001, Icarus, 154, 296
- Davis et al. (2010) Davis S. W., Stone J. M., Pessah M. E., 2010, ApJ, 713, 52
- Debes et al. (2012) Debes J., Walsh K., Stark C., 2012, ArXiv e-prints
- Debes et al. (2011) Debes J. H., Hoard D. W., Kilic M., Wachter S., Leisawitz D. T., Cohen M., Kirkpatrick J. D., Griffith R. L., 2011, ApJ, 729, 4
- Debes et al. (2011) Debes J. H., Hoard D. W., Wachter S., Leisawitz D. T., Cohen M., 2011, ApJS, 197, 38
- Debes & Sigurdsson (2002) Debes J. H., Sigurdsson S., 2002, ApJ, 572, 556
- Dobrovolskis et al. (1999) Dobrovolskis A. R., Dacles-Mariani J. S., Cuzzi J. N., 1999, Journal of Geophysical Research, 104, 30805
- Drell et al. (1965) Drell S. D., Foley H. M., Ruderman M. A., 1965, JGR, 70, 3131
- Dufour et al. (2006) Dufour P., Bergeron P., Schmidt G. D., Liebert J., Harris H. C., Knapp G. R., Anderson S. F., Schneider D. P., 2006, ApJ, 651, 1112
- Dufour et al. (2010) Dufour P., Kilic M., Fontaine G., Bergeron P., Lachapelle F.-R., Kleinman S. J., Leggett S. K., 2010, ApJ, 719, 803
- Duncan & Lissauer (1998) Duncan M. J., Lissauer J. J., 1998, Icarus, 134, 303
- Ehrenreich et al. (2011) Ehrenreich D., et al., 2011, A&A, 525, A85
- Fabrika & Valyavin (1999) Fabrika S., Valyavin G., 1999, in S.-E. Solheim & E. G. Meistas ed., 11th European Workshop on White Dwarfs Vol. 169 of Astronomical Society of the Pacific Conference Series, Magnetic field function of white dwarfs. p. 214
- Faller (1963) Faller A. J., 1963, Journal of Fluid Mechanics, 15, 560
- Farihi et al. (2010) Farihi J., Barstow M. A., Redfield S., Dufour P., Hambly N. C., 2010, MNRAS, 404, 2123
- Farihi et al. (2011) Farihi J., Dufour P., Napiwotzki R., Koester D., 2011, MNRAS, 413, 2559
- Farihi et al. (2010) Farihi J., Jura M., Lee J.-E., Zuckerman B., 2010, ApJ, 714, 1386
- Farihi et al. (2009) Farihi J., Jura M., Zuckerman B., 2009, ApJ, 694, 805
- Farihi et al. (2008) Farihi J., Zuckerman B., Becklin E. E., 2008, ApJ, 674, 431
- Fleming et al. (2000) Fleming T. P., Stone J. M., Hawley J. F., 2000, ApJ, 530, 464
- Frank et al. (2002) Frank J., King A., Raine D. J., 2002, Accretion Power in Astrophysics: Third Edition. Cambridge University Press
- Friedjung (1985) Friedjung M., 1985, A&A, 146, 366
- Fromang & Papaloizou (2007) Fromang S., Papaloizou J., 2007, A&A, 476, 1113
- Gänsicke et al. (2008) Gänsicke B. T., Koester D., Marsh T. R., Rebassa-Mansergas A., Southworth J., 2008, MNRAS, 391, L103
- Gänsicke et al. (2007) Gänsicke B. T., Marsh T. R., Southworth J., 2007, MNRAS, 380, L35
- Gänsicke et al. (2006) Gänsicke B. T., Marsh T. R., Southworth J., Rebassa-Mansergas A., 2006, Science, 314, 1908
- Ghosh & Lamb (1978) Ghosh P., Lamb F. K., 1978, ApJL, 223, L83
- Goldreich & Tremaine (1978) Goldreich P., Tremaine S. D., 1978, Icarus, 34, 227
- Goldreich & Ward (1973) Goldreich P., Ward W. R., 1973, ApJ, 183, 1051
- Gradshteyn et al. (2007) Gradshteyn I. S., Ryzhik I. M., Jeffrey A., Zwillinger D., 2007, Table of Integrals, Series, and Products
- Graham et al. (1990) Graham J. R., Matthews K., Neugebauer G., Soifer B. T., 1990, ApJ, 357, 216
- Gurevich et al. (1978) Gurevich A. V., Krylov A. L., Fedorov E. N., 1978, Zhurnal Eksperimental noi i Teoreticheskoi Fiziki, 75, 2132
- Hansen et al. (2006) Hansen B. M. S., Kulkarni S., Wiktorowicz S., 2006, AJ, 131, 1106
- Hartmann et al. (2011) Hartmann S., Nagel T., Rauch T., Werner K., 2011, A&A, 530, A7
- Johansen et al. (2007) Johansen A., Oishi J. S., Mac Low M.-M., Klahr H., Henning T., Youdin A., 2007, Nature, 448, 1022
- Jura (2003) Jura M., 2003, ApJL, 584, L91
- Jura (2006) Jura M., 2006, ApJ, 653, 613
- Jura (2008) Jura M., 2008, AJ, 135, 1785
- Jura et al. (2007) Jura M., Farihi J., Zuckerman B., 2007, ApJ, 663, 1285
- Jura et al. (2009) Jura M., Farihi J., Zuckerman B., 2009, AJ, 137, 3191
- Jura et al. (2007) Jura M., Farihi J., Zuckerman B., Becklin E. E., 2007, AJ, 133, 1927
- Jura et al. (2009) Jura M., Muno M. P., Farihi J., Zuckerman B., 2009, ApJ, 699, 1473
- Kilic et al. (2008) Kilic M., Farihi J., Nitta A., Leggett S. K., 2008, AJ, 136, 111
- Kilic & Redfield (2007) Kilic M., Redfield S., 2007, ApJ, 660, 641
- Kilic et al. (2005) Kilic M., von Hippel T., Leggett S. K., Winget D. E., 2005, ApJL, 632, L115
- King et al. (2007) King A. R., Pringle J. E., Livio M., 2007, MNRAS, 376, 1740
- Klein et al. (2010) Klein B., Jura M., Koester D., Zuckerman B., Melis C., 2010, ApJ, 709, 950
- Koester (2009) Koester D., 2009, A&A, 498, 517
- Koester & Wilken (2006) Koester D., Wilken D., 2006, A&A, 453, 1051
- Leitch-Devlin & Williams (1985) Leitch-Devlin M. A., Williams D. A., 1985, MNRAS, 213, 295
- Lin & Papaloizou (1996) Lin D. N. C., Papaloizou J. C. B., 1996, ARA&A, 34, 703
- Melis et al. (2010) Melis C., Jura M., Albert L., Klein B., Zuckerman B., 2010, ApJ, 722, 1078
- Metzger et al. (2009) Metzger B. D., Piro A. L., Quataert E., 2009, MNRAS, 396, 304
- Mullally et al. (2007) Mullally F., Kilic M., Reach W. T., Kuchner M. J., von Hippel T., Burrows A., Winget D. E., 2007, ApJS, 171, 206
- Paquette et al. (1986) Paquette C., Pelletier C., Fontaine G., Michaud G., 1986, ApJS, 61, 197
- Pringle (1981) Pringle J. E., 1981, ARA&A, 19, 137
- Rafikov (2011a) Rafikov R. R., 2011a, ApJL, 732, L3
- Rafikov (2011b) Rafikov R. R., 2011b, MNRAS, 416, L55
- Schmidt & Smith (1995) Schmidt G. D., Smith P. S., 1995, ApJ, 448, 305
- Shakura & Sunyaev (1973) Shakura N. I., Sunyaev R. A., 1973, A&A, 24, 337
- Takeda & Ida (2001) Takeda T., Ida S., 2001, ApJ, 560, 514
- Tanaka (2011) Tanaka T., 2011, MNRAS, 410, 1007
- von Hippel et al. (2007) von Hippel T., Kuchner M. J., Kilic M., Mullally F., Reach W. T., 2007, ApJ, 662, 544
- Weidenschilling (1977) Weidenschilling S. J., 1977, MNRAS, 180, 57
- Whipple (1972) Whipple F. L., 1972, in A. Elvius ed., From Plasma to Planet On certain aerodynamic processes for asteroids and comets. p. 211
- Wickramasinghe & Ferrario (2000) Wickramasinghe D. T., Ferrario L., 2000, PASP, 112, 873
- Wisdom & Tremaine (1988) Wisdom J., Tremaine S., 1988, AJ, 95, 925
- Wyatt (2008) Wyatt M. C., 2008, ARA&A, 46, 339
- Xu & Jura (2011) Xu S., Jura M., 2011, ArXiv e-prints
- Youdin & Goodman (2005) Youdin A. N., Goodman J., 2005, ApJ, 620, 459
- Zuckerman & Becklin (1987) Zuckerman B., Becklin E. E., 1987, Nature, 330, 138
- Zuckerman et al. (2007) Zuckerman B., Koester D., Melis C., Hansen B. M., Jura M., 2007, ApJ, 671, 872
- Zuckerman et al. (2010) Zuckerman B., Melis C., Klein B., Koester D., Jura M., 2010, ApJ, 722, 725
Appendix A Mass Accretion Due to Collisional Viscosity
Here we evaluate the role of ‘internal’ sources of viscosity within the particulate disk, similar to those thought to characterize the evolution of the rings of Saturn, on the rate of solid accretion in WD debris disks. Angular momentum transport in a dense ring is caused by three effects (Wisdom & Tremaine 1988; Takeda & Ida 2001): (1) translational transport due to the particle motions; (2) collisional transport; and (3) transport due to the gravitational torques, which are important only when self-gravity is important.
According to Daisaka et al. (2001), the efficiency of gravitational transport is determined by two parameters: (1) the optical depth of the particulate disk (eq. [3]); and (2) the ratio of the mutual Hill radius to twice the particle radius :
| (63) | |||||
where , , and are the particle mass, density, and distance from the WD, respectively. Note that is independent of the particle mass.
Equation (63) shows that is typically satisfied for the range of radii relevant to WD debris disks. In this regime gravitational transport can be neglected provided that (Daisaka et al. 2001)
| (64) |
If gravitational transport is negligible then internal transport is instead dominated by the collisional viscosity (Daisaka et al. 2001), where . The resulting mass flux can be estimated as
| (65) | |||||
Equation (65) shows that in order to explain typical values g s-1 of the accretion rates onto metal-rich WDs, then for77 7 For , as characterize e.g. Saturn’s rings, one would need m particles to achieve the same value of . one requires a typical particle mass g, corresponding to an object of size m. Obviously, particles of size m in a disk with optical depth cannot reside in a monolayer configuration; rather, the vertical thickness of the disk must be m, thus requiring a total solid mass g (assuming characteristic disk size R⊙). This mass is similar to that of a single 2000 km basaltic asteroid, which is significantly higher than the total mass of high-Z elements typically inferred to pollute metal-rich WDs (Farihi et al. 2010).
Explaining the highest inferred values of g s-1 requires even larger disk particles ( m) and, hence, even more massive disks. In principle the ring viscosity is enhanced if is sufficiently high that equation (64) is violated; when self-gravity becomes important, the viscosity instead becomes (Daisaka et al. 2001). However, the required disk mass in this case approaches that of a terrestrial size body, an unlikely explanation for all WDs with high . We conclude that viscosity due to internal stresses within the particulate ring is unlikely to play an important role in the majority of metal-rich WDs. A similar conclusion was reached by Farihi et al. (2008), who also estimated accretion times based on an analogy with planetary rings, finding that typically they greatly exceed the WD cooling timescale.
Appendix B Evolution of accretion disks with mass sources/sinks: analytical solutions.
Here we analyze equation (27) to derive some general results for the viscous evolution of an accretion disk with sources or sinks of mass and power law dependence of viscosity on radius
| (66) |
but without sources or sinks of the angular momentum, i.e. in equation (27). The initial condition for the disk evolution is
| (67) |
Power law viscosity is realized in the conventional model of -viscosity (Shakura & Sunyaev 1973) provided that the gas temperature has a power law dependence on radius:
| (68) |
In particular, if =const then . If , as expected for optically thin gas in equilibrium with stellar heating, then .
Following Tanaka (2011) and introducing new time-like and spatial coordinates (not to be confused with temperature) and
| (69) |
and looking for solution in the form
| (70) |
equation (27) can be transformed to
| (71) |
We now introduce Hankel transforms for each of the functions according to formula
| (72) |
Plugging these relations into (71) one arrives at the following simple differential equation for :
| (73) |
with initial condition
| (74) |
Solving this equation and performing inverse Hankel transform on we obtain
| (75) | |||||
We can further simplify this solution by plugging in the expressions for and from (72), rearranging the order of integration and using integral 6.633(2) from Gradshteyn et al. (2007). This gives us
| (76) | |||||
where
| (77) |
and and are given by equation (69).
B.1 Singular mass source.
For our current setup (sublimation at a single radius) it is useful to consider the situation when the injection of mass happens over a small radial span of the disk at , so that one can write
| (78) |
see equation (29). For simplicity we will assume that initially disk does not contain any mass, i.e. . Abandoning this assumption would amount to including the first term in equation (76) into the consideration.
One can obtain a simple solution for at late times under the assumption that varies slowly. In this case we can take to be approximately constant and take it out of the integral in equation (79). Then one gets
| (80) | |||||
Taking the last integral with the aid of relation
| (81) |
one finds that
| (82) | |||||
With this expression for the surface density one can easily determine mass accretion rate through the disk:
| (83) |
while for one finds . Thus, all of the mass injected at goes towards the central mass at late times.
Appendix C Coupled evolution in the absence of momentum feedback on the gaseous disk
The goal of this Appendix is to gain analytical insight into the coupled evolution of gaseous and solid WD disks, which are linked by mass exchange due to the evaporation of solids, as expressed by the source term in equation (29).
Here we account for the effect of gas drag on the evolution of the surface density of solids (as we do in ), but we neglect the back-reaction of the drag force on the gas disk evolution, assuming that its effect is small compared to that of the viscous stresses. With this simplification the evolution of the gas disk can be studied using the results of Appendix B, provided that the viscosity obeys the power law ansatz (eq. [66]). Figure 19 shows a comparison between the mass accretion rate computed with and without the back-reaction of the aerodynamic drag on the gaseous disk. The similar qualitative evolution in both cases justifies our assumption that the back-reaction force on the gas disk can be neglected to first order.

Another important assumption we make here is that the surface density of solids at is sufficiently high that is satisfied at all times. This approximation is likely to be valid only during the late stages of the disk evolution, as illustrated in Figures 6a and 12. Thus, the model we present below does not capture the early, “build-up” phase of the gaseous disk evolution, but it should work well at late times, during the runaway phase. This important simplification makes it possible to treat the evolution of the gas disk analytically, separate from the calculation of the solid disk evolution.
Using equations (21)-(24), (26) and (78) one obtains the following expression for the intensity of the mass source feeding the gaseous disk:
| (84) |
where we have assumed that and that .
This expression, coupled with the solution in equation (79), provides a closed set of equations for the evolution of which can be computed numerically. Note that a knowledge of is not required to calculate as long as . This is because the mass flux of solid debris at saturates at the value independent of when the disk of solids is optically thick.
To demonstrate the conditions under which runaway behavior becomes possible we concentrate on evaluating the time evolution of at only. By substituting equation (84) into equation (79), setting , and casting all variables into dimensionless form with the aid of equations (31)-(35), one obtains the following integral equation for the evolution of the gas optical depth at the inner edge of the disk :
| (85) |
where
| (86) |
Note that for the power law viscosity (66).
Our numerical results presented in §4 demonstrate that there are two possibilities for the gas disk evolution: either (1) saturates at essentially a constant level on timescales long compared to or (2) it grows with time in a runaway fashion. In both cases the behavior of is determined primarily by the most recent history of the disk and is largely insensitive to conditions in the distant past. This allows us to extend the lower limit of integration in equation (85) to for . This results (upon an obvious change of variables) in the following equation describing the late time behavior of :
| (87) |
In the case of orderly behavior, saturates at the constant level, such that the expression in brackets in equation (87) can be taken out of the integral. Using the fact that , one then finds that saturates at the value
| (88) |
This result and the whole picture of the orderly disk evolution are applicable only if
| (89) |
In the opposite case of runaway behavior, the first term in brackets in equation (87) rapidly comes to dominate over the second one. In this case the equation then has an exponentially growing solution , with a constant which satisfies the transcendental equation
| (90) |
It is easy to check that this equation has a positive solution (and the system evolves in a runaway fashion) only if
| (91) |
which is the condition opposite to that in equation (89). In particular, if we assume , which according to equation (68) corresponds to profile in the gas disk, then equations (40) and (82) imply that , such that is needed for the disk to evolve in a runaway fashion.
The upshot of this calculation is that, even in this simple model of the coupled disk evolution, runaway behavior becomes possible only when the feedback parameter exceeds some critical value close to unity, given by equation (91). We emphasize that despite the simplifications made in this section, the model presented is still fully global, as opposed to the treatment of Rafikov (2011b). Nevertheless, our result in equation (91) is in agreement with the runaway condition derived entirely from local considerations by Rafikov (2011b). And as we demonstrate in §4, the general result given by equation (91) remains valid even for the more complicated global models of the system, e.g. in which the back-reaction of the aerodynamic drag on the gas disk is self-consistently included and the possibility that is allowed.
Appendix D Solid-Gas Coupling in Eccentric Disks
We assume for simplicity that the streamlines in the gaseous disk are confocal ellipses (with foci coinciding with the WD position) with eccentricity being the same for all streamlines, and with apsidal lines pointing in the same direction (see Figure 20). There is no reason to believe that this geometric model captures all details of non-circular gas motion in real circum-WD disks — we adopt it here just to facilitate our calculations. Despite its simplicity, this model is sufficient to illustrate the importance of even moderately non-circular gas motions.
We characterize each gas streamline by its periastron distance , where is the semi-major axis of a corresponding streamline. Due to the non-circular shape of the streamlines, the surface density of gas varies as it travels along a given streamline. We characterize this variation by assuming that surface density is a function of and — the polar angle of the radius vector at a given point on a streamline with respect to the apsidal line (see Fig. 20). The dependence of on characterizes the radial profile of the surface density.

We denote as the (small) distance between the two neighboring streamlines (width of the flux tube confined by these streamlines) separated by the (small) distance along the apsidal line. Clearly,
| (92) |
where we have used the equation for elliptical orbit in polar coordinates
| (93) |
The gas surface density at periastron is related to the density at a different location along the same streamline via the continuity equation , where
| (94) |
is the Keplerian velocity along the streamline (we neglect the modification of the gas rotation profile by pressure support). Here is the value of corresponding to the semimajor axis . Using equations (92) and (94) we obtain
| (95) |
Now, let us consider a ring of particulate debris with radius . An elliptic streamline passing through a point on this ring has a periastron distance given by equation (93). The azimuthal velocity of gas passing through is given by
| (96) | |||||
where we have again neglected pressure support in the gas disk. The relative azimuthal velocity between the gas and particles at point is then given by
| (97) |
i.e. the gas rotates faster (slower) than particles at ().
The midplane gas density along the ring is given by , where we have assumed for simplicity that is independent of . According to equation (10) the azimuthal drag force acting per unit area of dense particle disk is then given by
| (98) | |||||
We now compute the orbit-averaged azimuthal force acting on the particle ring by averaging over . To do this we will assume that , relate to via equation (95) and use expression (93) to describe the dependence . As a result one finds that
| (99) | |||||
| (100) | |||||
We now explore the small- limit of our results. When one can easily show that independent of , such that the orbit-averaged azimuthal force can be written as
| (101) |
We use this result in §6.1 to demonstrate the enhancement of aerodynamic drag as the result of non-circular motions in the gaseous disk.