Global modeling of transcriptional responses in interaction
networks
Leo Lahti 1, Juha E.A. Knuuttila 2 and Samuel
Kaski 1,∗
1Aalto University School of Science and
Technology, Helsinki Institute for Information Technology HIIT and
Adaptive Informatics Research Centre, Department of Information and
Computer Science, P.O. Box 15400, FI-00076 Aalto, Finland.
2Neuroscience Center, University of Helsinki, P.O. Box 54,
FI-00014, Finland
Abstract
Motivation: Cell-biological processes are regulated
through a complex network of interactions between genes and their
products. The processes, their activating conditions, and the
associated transcriptional responses are often
unknown. Organism-wide modeling of network activation can reveal
unique and shared mechanisms between physiological conditions, and
potentially as yet unknown processes.
Results: We introduce a novel approach for organism-wide
discovery and analysis of transcriptional responses in interaction
networks. The method searches for local, connected regions in a
network that exhibit coordinated transcriptional response in a
subset of conditions. Known interactions between genes are used to
limit the search space and to guide the analysis. Validation on a
human pathway network reveals physiologically coherent responses,
functional relatedness between physiological conditions, and
coordinated, context-specific regulation of the genes.
Availability: Implementation is freely available in R and Matlab at
http://netpro.r-forge.r-project.org/
Contact: leo.lahti@iki.fi, samuel.kaski@tkk.fi
NOTE: The final version of this manuscript has been published in Bioinformatics 26(21):2713-2720, 2010.
1 Introduction
Coordinated activation and inactivation of genes through molecular interactions determines cell function. Changes in cell-biological conditions induce changes in the expression levels of co-regulated genes in order to produce specific physiological responses. A huge body of information concerning cell-biological processes is available in public repositories, including gene ontologies [2], pathway models [44], regulatory information [29], and protein interactions [20]. Less is known about the contexts in which these processes are activated [39], and how individual processes are reflected in gene expression [34]. Although gene expression measurements provide only an indirect view to physiological processes, their wide availability provides a unique resource for investigating gene co-regulation on a genome- and organism-wide scale. This allows the detection of transcriptional responses that are shared by multiple conditions, suggesting shared physiological mechanism with potential biomedical implications, as demonstrated by the Connectivity map [25] where a number of chemical perturbations on a cancer cell line were used to reveal shared transcriptional responses between disparate conditions to enhance screening of therapeutic targets.

Transcriptional responses have been modeled using so-called gene expression signatures [16]. A signature describes a co-expression state of the genes, associated with particular conditions. Well-characterized signatures have proven to be accurate biomarkers in clinical trials, and hence reliable indicators of cell’s physiological state. Disease-associated signatures are often coherent across tissues [7] or platforms [16]. Commercial signatures are available for routine clinical practice [37], and other applications have been suggested recently [7]. The established signatures are typically designed to provide optimal classification performance between two particular conditions. The problem with the classification-based signatures is that their associations to the underlying physiological processes are not well understood [30]. Our goal is to enhance the understanding by deriving transcriptional signatures that are explicitly connected to well-characterized processes through the network.
We introduce and validate a novel approach for organism-wide discovery and analysis of transcriptional response patterns in interaction networks. Our algorithm has been designed to detect and model local regions in a network, each of which exhibits similar transcriptional response in a subset of conditions. The algorithm is independent of predefined classifications for genes or conditions. This extends the previous network-based approaches that detect differentially expressed subnetworks between two predefined conditions [17, 43]. Organism-wide analysis can reveal unique and shared mechanisms between disparate conditions [24], and potentially as yet unknown processes [35]. The proposed NetResponse algorithm provides an efficient model-based tool for simultaneous feature selection and class discovery that utilizes known interactions between genes to guide the analysis. Related approaches include cMonkey [40] and a modified version of SAMBA biclustering [51]. These are application-oriented tools that rely on additional, organism-specific information, and their implementation is currently not available for most organisms, including human. We provide a general-purpose algorithm whose applicability is not limited to particular organisms.
NetResponse makes it possible to perform data-driven identification of functionally coherent network components and their condition-specific responses. This is useful since the commonly used alternatives, predefined gene sets or pathways, are collections of intertwined processes rather than coherent functional entities [35]. This has complicated their use in gene expression analysis, and methods have consequently been suggested for identifying the ’key condition-responsive genes’ of predefined gene sets [27], or for decomposing predefined pathways into smaller functional modules represented by gene expression signatures [4]. Our network-based search procedure detects the coordinately regulated gene sets in a data-driven manner. Gene expression provides functional information of the network that is missing in purely graph-oriented approaches for studying cell-biological networks [1]. The network brings in prior information of gene function and connects the responses more closely to known processes. This would be missing from purely gene expression-based methods such as biclustering [32], subspace clustering, or other feature selection approaches [26, 42]. A key difference to previous network-based clustering methods, including MATISSE [53] and related approaches [13, 47] is that they assume a single correlated reponse between all genes in a module. NetResponse additionally models condition-specific responses of the network. This allows a more expressive definition of a functional module, or a signature.
We validate the algorithm by modeling condition-specific transcriptional responses in a human pathway interaction network across an organism-wide collection of physiological conditions. The results highlight functional relatedness between tissues, providing a global view on cell-biological network activation patterns.
2 Methods
2.1 The NetResponse Algorithm
We introduce a new approach for global detection and characterization of transcriptional responses in genome-scale interaction networks. NetResponse searches for local, connected subnetworks where joint modeling of gene expression reveals coordinated transcriptional response in particular conditions (Fig. 1). More generally, it is a new algorithm for simultaneous feature selection (for genes) and class discovery (for conditions) that utilizes known interactions between genes to limit the search space and to guide the analysis.
Gene expression signatures.
Subnetworks are the functional units of the interaction network in our model; transcriptional responses are described in terms of subnetwork activation. Given a physiological state, the underlying assumption is that gene expression in subnetwork is regulated at particular levels to ensure proper functioning of the relevant processes. This can involve simultaneous activation and repression of the genes: sufficient amounts of mRNA for key proteins has to be available while interfering genes may need to be silenced. This regulation is reflected in a unique expression signature , a vector describing the associated expression levels of the subnetwork genes. The level of regulation varies from gene to gene; expression of some genes is regulated at precise levels whereas other genes fluctuate more freely. Given the physiological state, we assume that the distribution of observed gene expression is Gaussian, .
Modeling condition-specific transcriptional responses.
Each subnetwork is potentially associated with alternative transcriptional states, activated in different conditions and corresponding to unique combinations of processes. Since individual processes and their transcriptional responses are in general unknown [27], detection of condition-specific responses provides an efficient proxy for identifying functionally distinct states of the network. Our task is to detect and characterize these signatures. We assume that in a specific observation (measurement condition), the subnetwork can be in any one of latent physiological states indexed by . Each state is associated with a unique expression signature over the subnetwork genes. Associations between the observations and the underlying physiological states are unknown, and treated as latent variables. This leads to a mixture model for gene expression in the subnetwork :
| (1) |
where each component distribution is assumed to be Gaussian. In practice, we assume a diagonal covariance matrix .
A particular transcriptional response is characterized by the triple . This defines the shape, fluctuations, and frequency of the associated gene expression signature in subnetwork . The feasibility of the Gaussian modeling assumption is supported by the previous observations of [22], where predefined gene sets were used to investigate differences in gene expression between two predefined sample groups. In our model, the subnetworks, transcriptional responses and the activating conditions are learned from data. In one-channel data such as Affymetrix arrays used in this study, the centroids describe absolute expression signals of the preprocessed array data. Relative differences can be investigated by comparing the detected responses. The model is applicable also on two-channel expression data when a common reference sample is used for all arrays since the relative differences are not altered by the choice of comparison baseline when the same baseline is used for all samples.
Now the model has been specified assuming the subnetworks are given. In practice they are learned from the data. In order to do this we make two assumptions. First, we rely on the prior information in the global interaction network, and assume that co-regulated gene groups are connected components in this network. Second, we assume that the subnetworks are independent. This allows a well-defined algorithm, and the subnetworks are then interpretable as independent components of transcriptional regulation. In practice the algorithm, described below, is an agglomerative approximation for searching for locally independent subnetworks.

2.2 Implementation
Efficient implementation is crucial for scalability. For fast computation, we use an agglomerative procedure where interacting genes are gradually merged into larger subnetworks (Fig. 2). Joint modeling of dependent genes reveals coordinated responses and improves the likelihood of the data when compared to independent models, giving the first criterion for merging the subnetworks. However, increasing subnetwork size tends to increase model complexity and the possibility of overfitting since the number of samples remains constant while the dimensionality (subnetwork size) increases. To compensate for this effect, we use a Bayesian information criterion [8] to penalize increasing model complexity and to determine optimal subnetwork size.
The cost function for a subnetwork is , where is the (marginal) log-likelihood of the data, given the mixture model in Eq. 1, is the the number of parameters, and denotes sample size. NetResponse searches for a joint model for the network genes that maximizes the likelihood of observed gene expression, but avoids increasing model complexity through penalizing an increasing number of model parameters. An optimal model is searched for by at each step merging the subnetwork pair that produces the maximal gain in the cost function. More formally, the algorithm merges at each step the subnetwork pair that minimizes the cost . The agglomerative scheme is as follows:
Initialize: Learn univariate Gaussian mixture for the expression values of each gene, and bivariate joint models for all potential gene pairs with a direct link. Assign each gene into its own singleton subnetwork.
Merge: Merge the neighboring subnetworks , that have a direct link in the network and minimize the difference . Compute new joint models between the newly merged subnetwork and its neighbors.
Terminate: Continue merging until no improvement is obtained by merging the subnetworks ().
The number of distinct transcriptional responses of the subnetwork is unknown, and is estimated with an infinite mixture model. Learning several multivariate Gaussian mixtures between the neighboring subnetworks at each step is a computationally demanding task, in particular when the number of mixture components is unknown. The Gaussian mixtures, including the number of mixture components, are learned with an efficient variational Dirichlet process implementation [23]. The likelihood in the model is approximated by the lower bound of the variational approximation. The Gaussian mixture detects a particular type of dependency between the genes. In contrast to MATISSE [53] and other studies that use correlation or other methods to measure global co-variation, the mixture model detects coordinated responses that can be activated only in a few conditions. Condition-specific joint regulation indicates functional dependency between the genes but it may have a minor contribution to the overall correlation between gene expression profiles. In principle, we could also model the dependencies in gene fluctuations within each individual response with covariances of the Gaussian components. However, this would heavily increase model complexity, and therefore we leave dependencies in gene-specific fluctuations within each response unmodeled, and focus on modeling differences between the responses. NetResponse provides a full generative model for gene expression, where each subnetwork is described with an independent joint mixture model. The maximum subnetwork size is limited to 20 genes to avoid numerical instabilities in computation. The infinite Gaussian mixture can automatically adapt model complexity to the sample size. We model subnetworks of 1-20 genes across 353 samples; similar dimensionality per sample size has previously been used with variational mixture models [15].
2.3 Data
Pathway interaction network.
We investigate the pathway interaction network based on the KEGG database of metabolic pathways [19] provided by the SPIA package [52] of BioConductor (www.bioconductor.org). This implements the pathway impact analysis method originally proposed in [6], which is to our knowledge currently the only freely available pathway analysis tool that considers pathway topology. SPIA provides the data in a readily suitable form for our analysis. Other pathway data sets, commonly provided in the BioPAX format, are not readily available in a suitable pairwise interaction form. Directionality and types of the interactions were not considered. Genes with no expression measurements were removed from the analysis. We investigate the largest connected component of the network with 1800 unique genes, identified by Entrez GeneIDs.
Gene expression data.
We analyzed a collection of normal human tissue samples from ten post-mortem donors [41], containing gene expression measurements from 65 normal physiological conditions. To ensure sample quality, RNA degradation was minimized in the original study by flash freezing all samples within 8.5 h postmortem. Only the samples passing Affymetrix quality measures were included. Each condition has 3-9 biological replicates measured on the Affymetrix HG-U133plus2.0 platform. The reproducibility of our findings is investigated in an independent human gene expression atlas [49], measured on the Affymetrix HG-U133A platform, where two biological replicates are available for each measured condition. In the comparisons we use the 25 conditions available in both data sets (adrenal gland cortex, amygdala, bone marrow, cerebellum, dorsal root ganglia, hypothalamus, liver, lung, lymph nodes, occipital lobe, ovary, parietal lobe, pituitary gland, prostate gland, salivary gland, skeletal muscle, spinal cord, subthalamic nucleus, temporal lobe, testes, thalamus, thyroid gland, tonsil, trachea, and trigeminal ganglia). Both data sets were preprocessed with RMA [18]. Certain genes have multiple probesets, and a standard approach to summarize information across multiple probesets is to use alternative probeset definitions based on probe-genome remapping [5]. This would provide a single expression measure for each gene. However, since the HG-U133A array represents a subset of probesets on the HG-U133Plus2.0 array, the redefined probesets are not technically identical between the compared data sets. To minimize technical bias in the comparisons, we use probesets that are available on both platforms. Therefore, we rely on manufacturer annotations of the probesets and use an alternative approach (used e.g. by [38]), where one of the available probesets is selected at random to represent each unique gene. Random selection is used to avoid selection bias. When available, the ’xxxxxx_at’ probesets were used because they are more specific by design than the other probe set types (www.affymetrix.com).
2.4 Validation
The NetResponse algorithm is validated with an application on the pathway interaction network of 1800 genes [52] across 353 gene expression samples from 65 physiological conditions in normal human body [41]. NetResponse is compared to alternative approaches in terms of physiological coherence and reproducibility of the findings.
Comparison methods.
NetResponse is designed for organism-wide modeling of transcriptional responses in genome-scale interaction networks. Simultaneous detection of the subnetworks and their condition-specific responses is a key feature of the model. A straightforward alternative would be a two-step approach where the subnetworks and their condition-specific responses are detected in separate steps, although this can be unoptimal for detecting condition-specific responses. Various methods are available for detecting subnetworks based on network and gene expression data [13, 47] in the two-step approach. We use MATISSE, a state-of-the-art algorithm described in [53]. MATISSE finds connected subgraphs in the network such that each subgraph consists of highly correlated genes. The output is a list of genes for each detected subnetwork. Since MATISSE only clusters the genes, we model transcriptional responses of the detected subnetworks in a separate step by using a similar mixture model to the NetResponse algorithm. This combination is also new, and called MATISSE+ in this paper. The second comparison method is the SAMBA biclustering algorithm [50]. The output is a list of associated genes and conditions for each identified bicluster. SAMBA detects gene sets with condition-specific responses but, unlike NetResponse and MATISSE+, the algorithm does not utilize the network. Influence of the prior network is additionally investigated by randomly shuffling the gene expression vectors, while keeping the network and the within-gene associations intact. Comparisons between the original and shuffled data help to assess relative influence of the prior network on the results. Comparisons to randomly shuffled genes in SAMBA are not included since SAMBA does not use the network.
Reproducibility in validation data.
Reproducibility of the findings is investigated in an independent validation data set in terms of significance and correlation (for details, see Section 2.3). Each comparison method implies a grouping for the physiological conditions in each subnetwork, corresponding to the detected responses. It is expected that physiologically relevant differences between the groups are reproducible in other data sets. We tested this by estimating differential expression between the corresponding conditions in the validation data for each pairwise comparison of the predicted groups using a standard test for gene set analysis (GlobalTest; [10]). To ensure that the responses are also qualitatively similar in the validation data, we measured Pearson correlation between the detected responses and those observed in the corresponding conditions in validation data. The responses were characterized by the centroids provided by the model in NetResponse and MATISSE+. For SAMBA we used the mean expression level of each gene within each group of conditions since SAMBA groups the conditions but does not characterize the responses. In validation data, the mean expression level of each gene is used to characterize the response within each group of conditions. Probesets were available for 75% of the genes in the detected subnetworks in the validation data; transcriptional responses with less than three probesets in the validation data were not considered. Validation data contained corresponding samples for of the predicted responses in NetResponse, MATISSE+, and SAMBA (Supplementary Table 1).
3 Results
The validation results reported below demonstrate that the NetResponse algorithm is readily applicable for modeling transcriptional responses in interaction networks on an organism-wide scale. While biomedical implications of the findings require further investigation, NetResponse detects a number of physiologically coherent and reproducible transcriptional responses in the network, and highlights functional relatedness between physiological conditions. It also outperformed the comparison methods in terms of reproducibility of the findings.
3.1 Application to human pathway network
In total, NetResponse identified 106 subnetworks with 3-20 genes (Supplementary data file). For each subnetwork, typically (median) 3 distinct transcriptional responses were detected across the 65 physiological conditions (Supplementary Fig. 1). One of the subnetworks with four distinct responses is illustrated in Fig. 1. Each respose is associated with a subset of conditions. Statistically significant differences between the corresponding conditions were observed also in the independent validation data (; GlobalTest). Three of the four responses were also qualitatively similar (correlation ; Supplementary Fig. 2). The first response is associated with immune-system related conditions such as spleen and tonsil. Responses 2-3 are associated with neuronal conditions such as subthalamic or nodose nucleus, or with central nervous system, for example accumbens and cerebellum. The fourth group manifests a ’baseline’ signature that fluctuates around the mean expression level of the genes. Testis and pituitary gland are examples of conditions in this group. While most physiological conditions are strongly associated with a particular response, samples from amygdala, bone marrow, cerebral cortex, heart atrium, and temporal lobe manifested multiple responses. In general, it is not well known how individual pathways are manifested at gene expression level. While alternative responses reveal condition-specific regulation, detection of physiologically coherent and reproducible responses may indicate shared mechanisms between physiological conditions. Although the responses may reflect previously unknown processes, it is likely that some of them reflect the activation patterns of known pathways. Overlapping pathways can provide a starting point for interpretation. The subnetwork of Fig. 1 overlaps with various known pathways, most remarkably with the MAPK pathway with 10 genes (detailed gene-pathway associations are provided in the Supplementary data file; see subnetwork 12). MAPK is a general signal transduction system that participates in a complex, cross-regulated signaling network that is sensitive to cellular stimuli [54]. Association of MAPK to cell growth and proliferation could potentially explain the differences between neuronal and other conditions. Six subnetwork genes participate in the p53 pathway, which is a known regulator of the MAPK signaling pathway. In addition, p53 is known to interact with a number of other pathways, both as an upstream regulator, and a downstream target [55]. Both MAPK and p53 are associated with processes including cell growth, differentiation, and apoptosis, and exhibit diverse cellular responses to varying conditions. Condition-specific regulation can potentially explain the detection of alternative transcriptional states of the subnetwork.
The detected responses characterize absolute expression signals in our preprocessed one-channel array data. Systematic differences in the expression levels of the individual genes are normalized out in the visualization by showing the relative expression of each gene with respect to its mean expression level across all samples. Note that the choice of a common baseline does not affect the relative differences between the samples.

Condition-selective network activation.
Associations between the physiological conditions and the detected transcriptional responses are shown in Fig. 3. Some responses are shared by many conditions, while others are more specific to particular contexts such as immune system, muscle, or the brain. Related physiological conditions often exhibit similar network activation patterns, which is seen by grouping the conditions according to co-occurrence probabilities of shared transcriptional response. This is known as tissue-selectivity of gene expression [28].
Probabilistic tissue connectome.
Relatedness of physiological conditions can be measured in terms of shared transcriptional responses (Supplementary Fig. 3). This is an alternative formulation of the tissue connectome map suggested by [12] to highlight functional connectivity between tissues based on the number of shared differentially expressed genes at different thresholds. We use shared network responses instead of shared gene count. The use of co-regulated gene groups is expected to be more robust to noise than the use of individual genes. As the overall measure of connectivity between physiological conditions, we use the mean of signature co-occurrence probabilities over the subnetworks, given the model in Eq. 1. The analysis reveals functional relatedness between the conditions. In particular, two subcategories of the central nervous system appear distinct from the other conditions. Closer investigation of the observed responses would reveal how the conditions are related at transcriptional level (Supplementary data file).
3.2 Comparison to alternative approaches
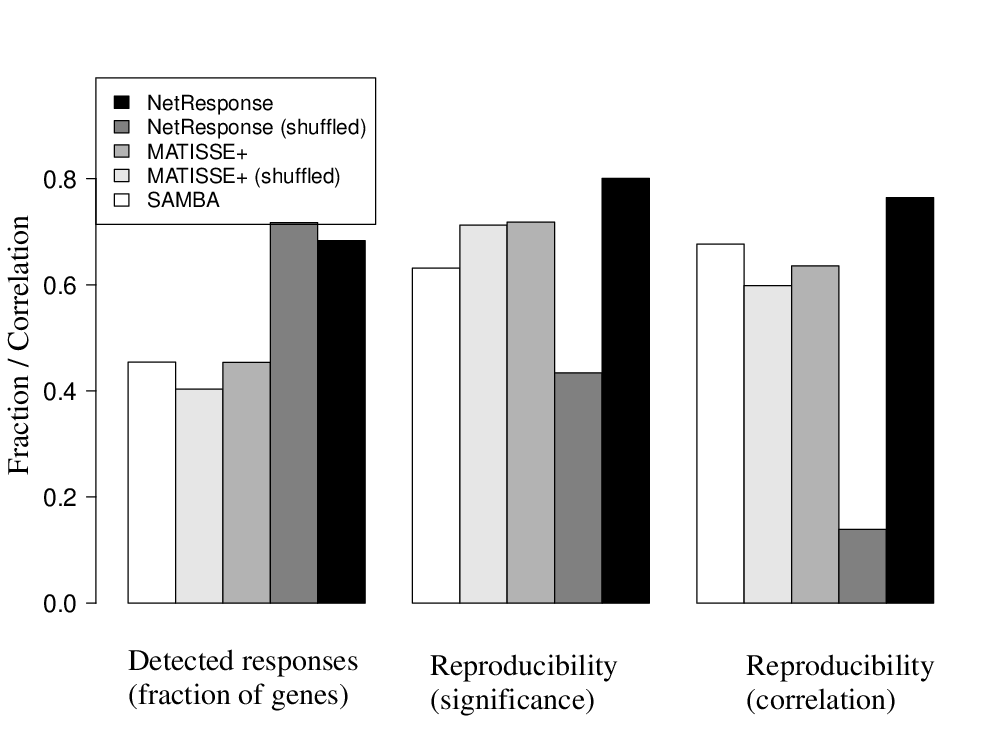
NetResponse was compared to the alternative approaches in terms of physiological coherence and reproducibility of the findings (Fig. 4; Supplementary Table 1). NetResponse detected the largest amount of responses; 68% of the network genes were associated with a response, compared to 45% in MATISSE+ and SAMBA. At the same time, NetResponse outperformed the comparison methods in terms of reproducibility of the findings.
Physiological coherence.
The association between the responses and physiological conditions was measured by normalized mutual information (NMI; [3]) between the sample-response assignments and sample class labels within each subnetwork. The NMI varies from 0 (no association) to 1 (deterministic association). The transcriptional responses detected by NetResponse, MATISSE+, and SAMBA show statistically significant associations to particular physiological conditions with a significantly higher average NMI (0.46-0.50) than expected based on randomly labeled data (0.26-0.32; ; Wilcoxon test; Supplementary Table 1). The highest average NMI (0.50) was obtained by NetResponse but differences between NetResponse, MATISSE+, and SAMBA are not significant. NetResponse is significantly physiologically more coherent also when compared to results obtained with shuffled gene expression (NMI 0.22; ). The observations confirm the potential physiological relevance of the findings in NetResponse, MATISSE+, and SAMBA.
Reproducibility.
The majority of the detected responses were reproducible both in terms of significance and correlation (Supplementary Fig. 4) as described in Section 2.4. Of the predicted differences between groups of physiological conditions, 80% were significant in validation data with (GlobalTest), compared to 72% and 63% in MATISSE+ and SAMBA, respectively, or 43% obtained for randomly shuffled data with NetResponse (Fig. 4). The changes were also qualitatively similar; in NetResponse the median correlation between the detected responses and corresponding conditions in the validation data is 0.76, which is significantly higher (; Wilcoxon test) than in the comparison methods (MATISSE+: 0.64; SAMBA: 0.68), or in randomly shuffled NetResponse data (0.14). NetResponse detected responses for a larger fraction of the genes (68%) than the other methods. This seems an intrinsic property of the algorithm since it detected responses for a similar fraction of the genes also in the network with randomly shuffled genes (72%). However, only the findings from the real data were reproducible.
Discussion
Cell-biological networks may cover thousands of genes, but any change in the physiological context typically affects only a small part of the network. While gene function and interactions are often subject to condition-specific regulation [28], they are typically studied only in particular experimental conditions. Organism-wide analysis could reveal highly specialized functions that are activated only in one or a few conditions. Detection of shared responses between the conditions can reveal previously unknown functional connections and help to formulate novel hypotheses of gene function in previously unexplored contexts. We provide a well-defined algorithm for such analysis.
The results support the validity of the model. NetResponse detected the largest number of responses without compromising physiological coherence or reproducibility of the findings compared to the alternatives. The most highly reproducible results were obtained by NetResponse. Further analysis is needed to establish the physiological role of the findings.
NetResponse is readily applicable for modeling condition-specific responses in cell-biological networks, including pathways, protein interactions, and regulatory networks. The network connects the responses to well-characterized processes, and provides readily interpretable results that are less biased towards known biological phenomena than methods based on predefined gene sets that are routinely used in gene expression studies to bring in prior information of gene function and to increase statistical power. However, these are often collections of intertwined processes rather than coherent functional entities. For example, pathways from KEGG may contain hundreds of genes while only a small part of a pathway may be affected by changes in physiological conditions [35]. This has complicated the use of predefined gene sets in gene expression studies. [6] demonstrated that taking into account aspects of pathway topology, such as gene and interaction types can improve the estimation of pathway activity. While their SPIA algorithm measures the activity of known pathways between two predefined conditions, our algorithm searches for potentially unknown functional modules, and detects their association to multiple conditions simultaneously. This is useful since biomedical pathways are human-made descriptions of cellular processes, often consisting of smaller, partially independent modules [4, 14]. Our data-driven search procedure can rigorously identify functionally coherent network modules where the interacting genes show coordinated responses. Joint modeling increases statistical power which is useful since gene expression, and many interaction data types such as protein-protein interactions, have high noise levels. The probabilistic formulation accounts for biological and measurement noise in a principled manner. Certain types of interaction data such as transcription factor binding or protein interactions are directly based on measurements. This can potentially help to discover as yet unknown processes that are not described in the pathway databases [35]. False negative interactions form a limitation for the current model because joint responses of co-regulated genes can be modeled only when they form a connected subnetwork.
The need for principled methods for analyzing large-scale collections of gene expression data is increasing with their availability. Versatile gene expression atlases contain valuable information about shared and unique mechanisms between disparate conditions which is not available in smaller and more specific experiments [24, 45]. For example, [25] demonstrated that large-scale screening of cell lines under diverse conditions can enhance the finding of therapeutic targets. Our model is directly applicable in similar exploratory tasks, providing tools for organism-wide analysis of transcriptional activity in normal human tissues [41, 49], cancer, and other diseases [21, 31] in a genome- and organism-wide scale. Similar collections are available for several model organisms including mouse [49], yeast [11], and plants [46]. A key advantage of our approach compared to methods that perform targeted comparisons between predefined conditions [17, 43] is that it allows systematic organism-wide investigation when the responses and the associated conditions are unknown. The motivation is similar to SAMBA and other biclustering approaches that detect groups of genes that show coordinated respose in a subset of conditions [32], but the network ties the findings more tightly to cell-biological processes in our model. This can focus the analysis and improve interpretability. Since the nonparametric mixture model adjusts model complexity with sample size, our algorithm is potentially applicable also in smaller and more targeted data sets. For example, it could potentially advance disease subtype discovery by revealing differential network activation in subsets of patients.
Many large-scale collections are continuously updated with new measurements. Our algorithm provides no integration technique for new experiments yet; on-line extensions that could directly integrate data from new experiments provide an interesting topic for further study. Another potential extension would be a fully-Bayesian treatment that would provide confidence intervals, removing the need to assess significance of the results in a separate step. While our model provides a model-based criterion for detecting the responses without prior knowledge of the activating conditions, the statistical significance of the findings has to be verified in further experiments. The majority of the responses in our experiments could be verified in an independent data set. Other potential extensions include adding more structure to address the directionality, relevance and probabilities of the interactions. Not all cell-biological processes have clear manifestations at transcriptome level. Hence information of transcript and interaction types, as in SPIA, could potentially help to improve the sensitivity of our approach. We could also seek to loosen the constraints imposed by the prior network. However, such extensions would come with an increased computational cost. The simple and efficient implementation is a key advantage.
NetResponse is closely related to subspace clustering methods such as agglomerative independent variable component analysis (AIVGA; [15]). However, AIVGA and other model-based feature selection techniques [26, 42] consider all potential connections between the features, which leads to a more limited scalability. Finding a global optimum in our model would require exhaustive combinatorial search over all potential subnetworks. Since the complexity depends on the topology of the network, finding a general formulation for the model complexity is problematic. The number of potential solutions grows faster than exponentially with the number of features (genes) and links between them, making exhaustive search in genome-scale interaction networks infeasible. Approximative solutions are needed, and are often sufficient in practice. A combination of techniques is used to achieve an efficient algorithm compared to the model complexity. First, we focus the analysis on those parts of the data that are supported by known interactions. This increases modeling power and considerably limits the search space. Second, the agglomerative scheme finds an approximative solution where at each step the subnetwork pair that leads to the highest improvement in cost function is merged. This finds a solution relatively fast compared to the complexity of the task. Note that the order in which the subnetworks become merged may affect the solution. Finally, the variational implementation considerably speeds up mixture modeling [23]. The running time of our application was 248 min on a standard desktop computer (Intel 2.83GHz; Supplementary Fig. 5).
Investigation of a human pathway interaction network revealed condition-specific regulation in the network, that is, groups of interacting genes whose joint response differs between physiological conditions. This highlights the condition-dependent nature of network activation, and emphasizes an important shortcoming in the current gene set-based testing methods [36]: simply measuring gene set ’activation’ is often not sufficient; it is also crucial to characterize how the expression changes, and in which conditions. Organism-wide modeling can provide quantitative information about these connections.
Conclusions
We have introduced and validated a general-purpose algorithm for global identification and characterization of transcriptional responses in genome-scale interaction networks across diverse physiological conditions. An organism-wide analysis of a human pathway interaction network validates the model, and provides a global view on cell-biological network activation. The results reveal shared and unique mechanisms between physiological conditions, and potentially help to formulate novel hypotheses of gene function in previously unexplored contexts.
Funding
This work was supported by the Academy of Finland [207467] and the IST Programme of the European Community, under the PASCAL 2 Network of Excellence [ICT-216886]. LL and SK belong to the Finnish CoE on Adaptive Informatics Research Centre of Academy of Finland, and to the Helsinki Institute for Information Technology HIIT.
References
- [1] Aittokallio, T. and Schwikowski, B. (2006). Graph-based methods for analysing networks in cell biology. Brief. Bioinform., 7, 243–255.
- [2] Ashburner, M. et al. (2000). Gene ontology: tool for the unification of biology. Nat. Genet., 25, 25–29.
- [3] Bush, W. et al. (2008). Alternative contingency table measures improve the power and detection of multifactor dimensionality reduction. BMC Bioinformatics, 9, 238.
- [4] Chang, J.T. et al. (2009). A genomic strategy to elucidate modules of oncogenic pathway signaling networks. Molec. Cell, 34, 104–14.
- [5] Dai et al. (2005). Evolving gene/transcript definitions significantly alter the interpretation of GeneChip data. Nucl. Acids Res., 33, e175–.
- [6] Draghici, S. et al. (2007). A systems biology approach for pathway level analysis. Genome Res., 17, 1537–1545.
- [7] Dudley, J. T. et al. (2009). Disease signatures are robust across tissues and experiments. Mol. Syst Biol., 5, 307.
- [8] Gelman, A. et al. (2003). Bayesian Data Analysis (2nd edition). Chapman & Hall/CRC, Boca Raton, FL.
- [9] Gentleman, R. C. et al. (2004). Bioconductor: Open software development for computational biology and bioinformatics. Genome Biol., 5, R80.
- [10] Goeman, J. J. et al. (2004). A global test for groups of genes: testing association with a clinical outcome. Bioinformatics, 20, 93–99.
- [11] Granovskaia, M. V. et al. (2010). High-resolution transcription atlas of the mitotic cell cycle in budding yeast. Genome Biol., 11, R24
- [12] Greco, D. et al. (2008). Physiology, pathology and relatedness of human tissues from gene expression meta-analysis. PLoS ONE, 3, e1880.
- [13] Hanisch, D. et al. (2002). Co-clustering of biological networks and gene expression data. Bioinformatics, 18, 145–154.
- [14] Hartwell et al. (1999). From molecular to modular cell biology. Nature, 402, C47–C52.
- [15] Honkela, A. et al. (2008). Agglomerative independent variable group analysis. Neurocomp., 71, 1311–1320.
- [16] Hu, Z. et al. (2006). The molecular portraits of breast tumors are conserved across microarray platforms. BMC Genomics, 7, 96.
- [17] Ideker, T. et al. (2002). Discovering regulatory and signalling circuits in molecular interaction networks. Bioinformatics, 18 (suppl. 1), S233–240.
- [18] Irizarry, R. A. et al. (2003). Summaries of Affymetrix GeneChip probe level data. Nucl. Acids Res., 31, e15.
- [19] Kanehisa, M. et al. (2008). KEGG for linking genomes to life and the environment. Nucl. Acids Res., 36 (suppl. 1), D480–484.
- [20] Kerrien, S. et al. (2007). IntAct–open source resource for molecular interaction data. Nucl. Acids Res., 35 (suppl. 1), D561–565.
- [21] Kilpinen, S. et al. (2008). Systematic bioinformatic analysis of expression levels of 17,330 human genes across 9,783 samples from 175 types of healthy and pathological tissues. Genome Biol., 9, R139.
- [22] Kong, S. W. et al. (2006). A multivariate approach for integrating genome-wide expression data and biological knowledge. Bioinformatics, 22, 2373–2380.
- [23] Kurihara, K. et al. (2007). Accelerated variational dirichlet process mixtures. In B. Schölkopf, J. Platt, and T. Hoffman, eds., Advances in Neural Information Processing Systems 19, 761–768. MIT Press, Cambridge, MA.
- [24] Lage, K. et al. (2008). A large-scale analysis of tissue-specific pathology and gene expression of human disease genes and complexes. Proc. Natl Acad. Sci. USA, 105, 20870–20875.
- [25] Lamb, J. et al. (2006). The Connectivity Map: Using Gene-Expression Signatures to Connect Small Molecules, Genes, and Disease. Science, 313, 1929–1935.
- [26] Law, M. et al. (2004). Simultaneous feature selection and clustering using mixture models. IEEE Trans. Pattern Anal. Mach. Intell., 26, 1154– 1166.
- [27] Lee, E. et al. (2008a). Inferring pathway activity toward precise disease classification. PLoS Comput. Biol., 4, e1000217.
- [28] Liang, S. et al. (2006). Detecting and profiling tissue-selective genes. Physiol. Genomics, 26, 158–162.
- [29] Loots, G. and Ovcharenko, I. (2007). ECRbase: database of evolutionary conserved regions, promoters, and transcription factor binding sites in vertebrate genomes. Bioinformatics, 23, 122–124.
- [30] Lucas, J. E. et al. (2009). Cross-study projections of genomic biomarkers: An evaluation in cancer genomics. PLoS ONE, 4, e4523.
- [31] Lukk, M. et al. (2010). A global map of human gene expression. Nat. Biotech., 28, 322–324.
- [32] Madeira, S. C. and Oliveira, A. L. (2004). Biclustering algorithms for biological data analysis: a survey. IEEE Trans. Comput. Biol. Bioinformatics, 1, 24–45.
- [33] Maglott, D. et al. (2005). Entrez Gene: gene-centered information at NCBI. Nucl. Acids Res., 33 (Database issue), D54–D58.
- [34] Montaner, D. et al. (2009). Gene set internal coherence in the context of functional profiling. BMC Genomics, 10, 197.
- [35] Nacu, S. et al. (2007). Gene expression network analysis and applications to immunology. Bioinformatics, 23, 850–858.
- [36] Nam, D. and Kim, S.-Y. (2008). Gene-set approach for expression pattern analysis. Brief. Bioinform., 9, 189–197.
- [37] Nuyten, D. and van de Vijver, M. (2008). Using microarray analysis as a prognostic and predictive tool in oncology: focus on breast cancer and normal tissue toxicity. Semin. Radiat Oncol., 18, 105–114.
- [38] Nymark et al. (2007). Gene Expression Profiles in Asbestos-exposed Epithelial and Mesothelial Lung Cell Lines. BMC Genomics, 8, 62.
- [39] Rachlin, J. et al. (2006). Biological context networks: a mosaic view of the interactome. Mol. Syst Biol., 2, 66.
- [40] Reiss, D. et al. (2006). Integrated biclustering of heterogeneous genome-wide datasets for the inference of global regulatory networks. BMC Bioinformatics, 7, 280.
- [41] Roth, R. et al. (2006). Gene expression analyses reveal molecular relationships among 20 regions of the human CNS. Neurogenetics, 7, 67–80.
- [42] Roth, V. and Lange, T. (2004). Feature selection in clustering problems. In S. Thrun, L.K. Saul and B. Schölkopf, eds., Advances in Neural Information Processing Systems 16. MIT Press, Cambridge, MA.
- [43] Sanguinetti, G. et al. (2008). MMG: a probabilistic tool to identify submodules of metabolic pathways. Bioinformatics, 24, 1078–1084.
- [44] Schaefer, C. F. (2006). An Introduction to the NCI Pathway Interaction Database. NCI-Nature Pathway Interaction Database.
- [45] Scherf, U. et al. (2000). A gene expression database for the molecular pharmacology of cancer. Nat. Genet., 24, 236-44.
- [46] Schmid, M. et al. (2005). A gene expression map of Arabidopsis thaliana development. Nat. Genet., 37, 501–6.
- [47] Shiga, M. et al. (2007). Annotating gene function by combining expression data with a modular gene network. Bioinformatics, 23, 468–478.
- [48] Son, C. G. et al. (2005). Database of mRNA gene expression profiles of multiple human organs. Genome Res., 15, 443–50.
- [49] Su et al. (2004). A gene atlas of the mouse and human protein-encoding transcriptomes PNAS, 101, 6062–6067.
- [50] Tanay, A. et al. (2002). Discovering statistically significant biclusters in gene expression data. Bioinformatics, 18, S136–S144.
- [51] Tanay, A. et al. (2004). Revealing modularity and organization in the yeast molecular network by integrated analysis of highly heterogeneous genomewide data. Proc. Natl Acad. Sci. USA, 101, 2981–2986.
- [52] Tarca, A. L. et al. (2009). A novel signaling pathway impact analysis. Bioinformatics, 25, 75–82.
- [53] Ulitsky, I. and Shamir, R. (2007). Identification of functional modules using network topology and high-throughput data. BMC Syst Biol., 1, 8.
- [54] Wilkinson, M.G. and Millar, J.B. (2000). Control of the eukaryotic cell cycle by MAP kinase signaling pathways. FASEB J., 14, 2147–2157.
- [55] Wu, G.S. (2004). The functional Interactions Between the MAPK and p53 Signaling Pathways Cancer Biol. & Therapy, 3, 146–151.
Supplementary Figures
| A |

|
|---|---|
| B |

|
| C |

|


| A |

|
|---|---|
| B |

|

| NetRespose | NetResponse | MATISSE+ | MATISSE+ | SAMBA | |
| (shuffled) | (shuffled) | ||||
| Reproducibility (corr.) | 0.76 | 0.14 | 0.64 | 0.60 | 0.68 |
| Reproducibility (signif.) | 0.80 | 0.43 | 0.72 | 0.71 | 0.63 |
| Fraction of responses | 0.81 | 0.34 | 0.79 | 0.80 | 0.89 |
| with validation data | |||||
| Physiol. coh. (NMI) | 0.50 | 0.22 | 0.49 | 0.41 | 0.46 |
| Physiol. coh. (signif.) | |||||
| Fraction of data | 0.68 | 0.72 | 0.45 | 0.40 | 0.45 |
| assigned to subnetworks |