LOFAR: opening a new window on low frequency radio astronomy
Abstract
This contribution reports on the status of LOFAR (the LOw Frequency ARray) in its ongoing commissioning phase. The purpose is to illustrate the progress that is being made, often on a daily basis, and the potential of this new instrument, which is the first “next-generation” radio telescope. Utilizing a novel phased-array design, LOFAR is optimized for the largely unexplored low frequency range: MHz. The construction of LOFAR in the Netherlands is almost complete and 8 international stations have already been deployed as well. The wide field-of-view and multi-beam capabilities, in combination with sub-milliJansky sensitivity at arcsec (and sub-arcsec) resolution, are unprecedented at these frequencies. With the commissioning of LOFAR in full swing, we report some of the initial results, in particular those coming from the testing of imaging and pulsar modes.
1 LOFAR in a nutshell
LOFAR is a next-generation radio telescope operated by ASTRON and constructed in the north of the Netherlands, with extensions across Europe. Utilizing a novel phased-array design, LOFAR is optimized for the largely unexplored low frequency range from 10 to 240 MHz. In the Netherlands, a total of 40 LOFAR stations are nearing completion with an initial 8 international stations also deployed. LOFAR has been described elsewhere in detail (see, e.g., [11],[4]). Here, we briefly summarize the characteristics and the status of the telescope 11 1 For continued up-to-date information on the rollout of the array, the reader is referred to http://www.astron.nl/heald/lofarStatusMap.html and of the commissioning.
The array consists of thousands of simple dipoles, grouped into stations. The dipoles and stations are designed differently for the Low-Band Array (LBA; MHz) and the High-Band Array (HBA; MHz), see Figure 1. The -MHz range occupied by FM radio broadcasts is filtered out. As of early November 2011, there are 24 core stations (within about 2 km of the center of the array, near the village of Exloo in the Netherlands), 9 remote stations (within about 100 km), and 8 international stations in France, Germany, Sweden, and the UK (see Figure 1). An important feature of the station design is that the HBA dipoles are split into two substations in the core; these substations can (optionally) be correlated separately for increased sensitivity to sources with large angular size. Each station is capable of forming multiple “station beams”, which are then correlated and/or summed as necessary in the Blue Gene P (BG/P) supercomputer in Groningen. The product of station beams times total bandwidth is 48 MHz per station, giving LOFAR a remarkably large fractional bandwidth and field-of-view (FOV). Digital beam-forming techniques make the LOFAR system agile and allow for rapid repointing of the telescope as well as the potential for multiple simultaneous observations. The software aspect of the LOFAR system is of crucial importance. For example, post-processing is handled by a number of different software pipelines which are currently under heavy development.
The wide FoV and multi-beam capabilities, in combination with sub-milliJansky sensitivity at arcsec (and sub-arcsec) resolution, are all unprecedented capabilities at these frequencies. LOFAR is the most powerful and flexible low-frequency radio telescope ever built. It is also an important precursor to the Square Kilometer Array (SKA), by virtue of demonstrating many relevant technologies for the first time.

LOFAR will be operated as an international facility open to the general astronomical community. The primary scientific drivers for LOFAR are represented by the so-called Key Science Projects (KSPs): Surveys, Cosmic Magnetism, Epoch of Reionization, Transients, Cosmic Rays, and Solar Science and Space Weather. A more detailed description of these KSPs can be found in [10].
2 A flexible way of observing
A variety of observing modes are available, from standard interferometric imaging, to tied-array beam-forming, and real-time triggering on transients. In fact, several of these modes can be done in parallel, as illustrated in Figure 2.
The standard imaging mode provides interferometric data just as other traditional synthesis arrays consisting of antenna elements. The goal of LOFAR imaging is to achieve high fidelity and low noise images of a range of astronomical objects, using customized observing parameters. In this mode, station beams are transferred to the central processing facility where they are correlated to produce raw visibility data. The raw uv data are stored on the temporary storage cluster. Further processing, primarily calibration, is handled off-line. The pipeline which performs processing of the imaging data is the LOFAR Standard Imaging Pipeline, which has been described by [6]. The most important components of this pipeline are (i) the flagger and data compression utility; (ii) the calibration engine, called BlackBoard Selfcal (BBS); (iii) the imager; and (iv) the sky model database. Flagging of radio frequency interference (RFI) is of crucial importance. Despite the relatively high level of RFI in northern Europe, excellent rejection without significant loss of data is possible thanks to the high frequency and time resolution of LOFAR data (recent observations use 4 kHz channels and second integrations, depending on observing frequency). Typically, % of data are lost due to RFI flagging, and at many frequencies the statistics are even better. The flagging now implemented in the pipeline has been done using the algorithm described by [9].
The imaging step itself is a difficult task for LOFAR — the nature of the dipoles, and their fixed orientation on the ground, makes the sensitivity pattern of the telescope not only a function of angular position and observing frequency, but also a strong function of time. At the moment, LOFAR images are limited by deconvolution errors. This is mitigated by subtracting the brightest sources in the visibility domain prior to imaging. The LOFAR sky model is needed for calibrating the telescope in arbitrary locations on the sky. An all-sky calibration survey, aiming to produce a catalog of the brightest sources in the LOFAR sky, has just begun (see below for details). Imaging capability and a summary of the sensitivity of the array can be found in [5].
There are many ways in which the LOFAR antennas and stations can be combined to form beams relevant for observing pulsars and fast transients. A detailed description is given in [11]. In short, the term station beam corresponds to the beam formed by the sum of all of the elements of a station. For any given observation there may be more than one station beam and they can be pointed at any location within the wider element beam. A tied-array beam is formed by coherently combining all the station beams, one for each station, which are looking in a particular direction. To sample the combined radio signal at significantly higher time resolution (t ms), one has to normally sacrifice spatial resolution, and/or the large FoV seen by the individual elements, to form a single beam pointing in the direction of the source of interest. To compensate for this, there may be more than one tied-array beam for each station beam. Station beams can also be combined incoherently in order to form incoherent array beams. These retain the FoV of the individual station beams but have increased sensitivity compared with a single station. A pulsar pipeline has been developed to cope with the data and a description can be found in [1]. Finally, the LOFAR Transients Key Science Project ([3]) will use both the imaging and beam-formed modes to discover and study transient sources. The imaging mode will probe flux changes on timescales of seconds to years, while the beam-formed modes will probe timescales from seconds down to microseconds. With the Transient Buffer Boards it will be possible also to form images on very short timescales.
3 Coping with the data rate and volume
LOFAR is in the vanguard of new astronomical facilities dealing with the transport, processing, and storage of extremely large amounts of data. The raw data-rate generated at station level by the entire LOFAR array is 13 Tbit/s, far too much to transport in its entirety. Even though this raw data-rate is reduced by, e.g., beam-forming at station level, the long range data transport rates over the array are still of order 150 Gbit/s, requiring partially dedicated fibre networks. Such large data transport rates naturally also imply data storage challenges. For example, typical interferometric imaging observations can easily produce 35 TBytes/hr of raw, correlated visibilities.
The LOFAR station data are sent via a high-speed (partly dedicated) fiber network infrastructure to a central processing facility located in Groningen, in the north of the Netherlands. At this central processing (CEP) facility, data from all stations is aligned in time, combined, and further processed using a Blue Gene/P supercomputer offering about 28 TFLOP of processing power. As mentioned above, the Blue Gene/P performs a variety of processing operations, including correlation for standard interferometric imaging, tied-array beam-forming for high time resolution observations, and even real-time triggering on incoming station data streams. Combinations of these operations can also be run in parallel. Blue Gene/P writes raw data products to a storage cluster for additional post-processing. At the moment, storage limits give a week processing window. When complete, this cluster will host 2 Pbyte of working storage. As mentioned above, once on the storage cluster, a variety of reduction pipelines are then used to further process the data into the relevant scientific data products depending on the specific type of observation. Science-specific pipelines run on a dedicated compute cluster with a total processing power of approximately 10 TFLOP.

4 Commissioning and first results
As commissioning continues, the first science results from LOFAR are beginning to appear. Many of these results were presented at the LOFAR Workshop “First Science with LOFAR” and they can be found at http://www.astron.nl/lofarscience2011/ .
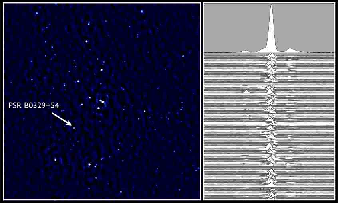
For pulsars, the LOFAR frequency range is an under-explored part of spectrum. Observations of known pulsars have already brought more than 100 detections and preliminary results, as well as LOFAR’s pulsar observing modes are described in detail in Stappers et al. (2011). A coherent sum of multiple stations is now routinely used to perform high-sensitivity, high-time-resolution observations of, e.g., pulsars, (exo)planets, flare stars, and cosmic rays. Furthermore, to compensate for the reduced FoV of these tied-array beams, multiple simultaneous beams are now regularly used (see Figure 3). Recently the pulsar group has started testing LOFAR observations that use 127 tied-array beams synthesized from the Superterp stations. This mode provides an excellent tool for sensitive large-area surveys. Indeed, a large pilot survey for pulsars has been taken, using a coherent ”superterp” and 19 tied-array beams, providing 3.7 deg2 of sky per pointing (Coenen et al. in prep).
The low-frequency range and large fractional bandwidth of LOFAR provide a unique view of the pulsar emission process. LOFAR data is already providing interesting insight into the frequency evolution of pulse profile morphology, placing constraints on the emission height within the pulsar’s magnetosphere (Hassall et al. in prep.). LBA observations of pulsars B0809+74 and B1133+16 show very bright, sporadic single-pulses, which also provide insight into the emission mechanism (Kondratiev et al. in prep.).

The commissioning period is also producing some excellent imaging results (see e.g. [6] and [8]), in spite of various complications due to the low frequency and wide FoV. For instance, the LBAs have an extremely large FoV, and consequently the brightest sources (e.g. Cassiopeia A, Cygnus A, Virgo A and Taurus A; the so-called “A-team”) in the sky, which are omnipresent in the side-lobes, must be subtracted in order to properly calibrate the data (e.g. beam changing over time, ionosphere). Brute-force strategies, solving for the gains in the directions of the brightest sources and then subtracting them from the visibilities, have been successful but are highly computationally expensive. Recently, the “demixing” method described by [12] has been tested and found remarkably successful. This method requires a good model of the A-team sources and, therefore, some of the highest-quality images made so far are of, e.g., Virgo A and Cygnus A (see Fig. 4). This method has shown that not only the target source can be well calibrated and imaged following demixing, but also the off-axis bright sources as well — in one recent test, Cassiopeia A was successfully imaged, despite being located some away from the pointing center.
The detailed study of these radio sources has also provided initial results on their spectral indices. The radio spectrum of Cygnus A has been traced from 240 MHz down to 30 MHz (McKean et al. in prep). A steepening of the spectral index towards the centre is observed, as expected for the synchrotron aging model. Similar spectral indices are found in the two lobes. In the case of Virgo A, the new observations also demonstrate the impressive wide-field capabilities of LOFAR, which allow simultaneous imaging of the other sources in the cluster (see Fig. 4 left; De Gasperin et al. in prep). Figure 5 illustrates other example images from commissioning observations. The topics that are currently receiving the most attention are the study of normal galaxies (illustrated by NGC 4631 where the halo of radio emission is starting to become visible; Jurusik et al. in prep), giant radio galaxies (e.g. B1834+620, where also polarized emission has been detected; Orrú et al. in prep.) and cluster halos (e.g. A2256; van Weeren et al. in prep.).
Given the importance of the initial sky model for the calibration of LOFAR data, a survey aimed at improving this model has just started. The ”Multifrequency Snapshot Sky Survey (MSSS) ” (Heald et al. in prep) will be done both at high-band as well as low-band frequencies and it will reach respective noise levels of and mJy/beam. However, the spatial resolution will be relatively low ( arcsec) as it will make use only of the shorter baselines (core stations) due to limited computing power. Visibility data from longer baselines will be kept available for possible post-processing that will result in higher resolution images. An example of the large fields that will be imaged in one pointing is given in Fig. 6.

Finally, a few words about two other important KSPs. The Epoch of Reionisation (EoR) is the most challenging project that LOFAR will carry out. The efforts of the EoR group are now concentrated on the correction of direction-dependent effects, and more specifically imaging artifacts due to the different and, to some degree uncertain, station beams. Using the new SAGECAL ([7]) software package, calibration in up to 100 directions is now possible within 14 hours of processing. This has made it possible to approach the thermal noise, even though a proper ionospheric calibration is not yet in place. However, this situation might change in the coming months/years as the solar activity increases. Another milestone is the pipeline processing of wide FoV observations using multiple LOFAR beams. Finally, there is an on-going effort on increasing the performance and accuracy of calibration and imaging algorithms on multi-core architectures.

The goal of the Cosmic Ray KSP is to detect the radiation produced when a cosmic ray hits the Earth’s atmosphere, producing a cascade of secondary particles (see [2]). This is used to study the properties of the primary cosmic rays as well as the development of the particle cascade and the radiation mechanism. LOFAR can trigger on cosmic rays in two ways: directly on the radio air shower signal, or via an external trigger (e.g. from a particle detector array). At present, the detection of cosmic rays by LOFAR has been done using a particle detector array as trigger: the Lofar Radboud Air shower array (LORA). When LORA detects a cosmic ray signal it requests a read-out of a ring-buffer (Transient Buffer Board data) from each LOFAR dipole on the ”superterp”.
In summary, LOFAR is almost fully constructed, the commissioning is in full swing, and the first science results are beginning to appear. Challenges, especially in the calibration and imaging, still need to be solved but also this is proceeding very fast. With its dense core array and long interferometric baselines, LOFAR is about to change our view of the low-frequency Universe!
Acknowledgments
LOFAR, the Low Frequency Array designed and constructed by ASTRON, has facilities in several countries, that are owned by various parties (each with their own funding sources), and that are collectively operated by the International LOFAR Telescope (ILT) foundation under a joint scientific policy. The results presented here are the culmination of a great deal of work done by a large number of people. We gratefully acknowledge the engineers who have designed and built the array, as well as the large group of commissioners who have taken part in LOFAR “Busy Weeks,” where the bulk of the commissioning progress has taken place.
References
References
- [1] Alexov A., Hessels J., Mol J. D., Stappers B., van Leeuwen J., 2010, ASPC, 434, 193
- [2] Corstanje A., et al., 2011, arXiv, arXiv:1109.5805
- [3] Fender, R. P.et al. 2006 The LOFAR Transients Key Project. VI Microquasar Workshop: Microquasars and Beyond, http://arxiv.org/abs/astro-ph/0611298
- [4] van Haarlem et al. 2012, A&A submitted
- [5] Heald G., et al., 2011, arXiv, arXiv:1106.3195
- [6] Heald G., et al., 2010, arXiv, arXiv:1008.4693
- [7] Kazemi S. et al. 2011, MNRAS, 414, 1656
- [8] McKean J., et al., 2011, arXiv, arXiv:1106.1041
- [9] Offringa, A. R. et al. 2010, MNRAS, 405, 155
- [10] Rottgering H.J.A., et al., 2006, in ”Cosmology, galaxy formation and astroparticle physics on the pathway to the SKA”, arXiv:astro-ph/0610596
- [11] Stappers B.W., et al., 2011, A&A, 530, A80
- [12] van der Tol, S., Jeffs, B. D. & van der Veen, A.J. 2007, ITSP, 55, 4497