The gradual destruction of magnetism in the superconducting family NaFe1-xCoxAs
Abstract
The interplay and coexistence of superconducting, magnetic and structural order parameters in NaFe1-xCoxAs has been studied using SQUID magnetometry, muon-spin rotation and synchrotron x-ray powder diffraction. Substituting Fe by Co weakens the ordered magnetic state through both a suppression of and a reduction in the size of the ordered moment. Upon further substitution of Fe by Co the high sensitivity of the muon as a local magnetic probe reveals a magnetically disordered phase, in which the size of the moment continues to decrease and falls to zero around the same point at which the magnetically-driven structural distortion is no longer resolvable. Both magnetism and the structural distortion are weakened as the robust superconducting state is established.
pacs
74.90.+n, 74.25.Ha, 76.75.+iI Introduction
The phase diagrams of iron-based superconductors demonstrate that, as for the cuprates, the superconducting state generally emerges from a magnetic parent compound under chemical substitution [1, 2, 3]. However, in contrast to the cuprates where the magnetic state is due to electrons localized in a Mott insulator, in iron-based superconductors it arises from an instability of the delocalised Fe d-band electrons [4]. It is important to understand how this magnetic state evolves into the superconducting one and how the two states compete, coexist or mutually exclude one another.
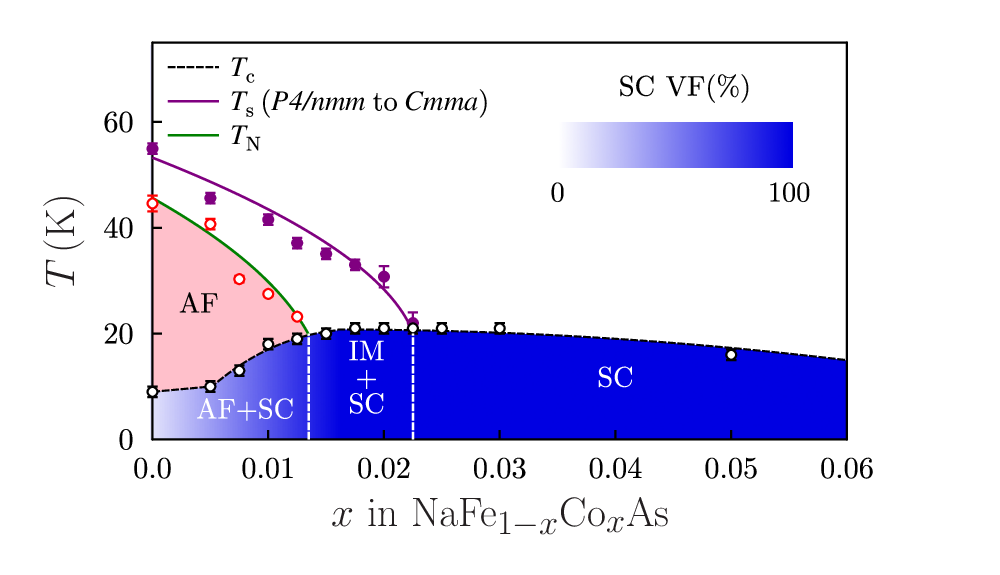
In this paper we study the “111” arsenide compound NaFe1-xCoxAs using SQUID magnetometry, muon spin rotation (SR) and synchrotron x-ray powder diffraction (XRPD) experiments. Our results allow us to follow in detail how the magnetic state collapses as Fe is substituted by Co, first by weakening the magnetic long-range order (LRO) and structural distortion and then by suppressing magnetic fluctuations. Our data demonstrate the decisive influence of the magnetism on the system and show how its disappearance correlates with the strengthening of the superconducting phase. A summary of our findings is shown in the phase diagram in Fig. 1 (which includes some data points from Ref. 5). It is notable that, in comparison with other pnictides, very small amounts of cobalt on the Fe site result in a complete suppression of the magnetic state. For example, the optimal is obtained with a substitution of Co on the Fe site [5] in NaFe1-xCoxAs, compared to [3] Co in Ba(Fe1-xCox)2As2. This means that significantly smaller structural and electronic changes are being made to the stoichiometric system thereby reducing any effect of inhomogeneous substitution on the properties under investigation.
For this study, a series of NaFe1-xCoxAs compounds were synthesised according to the methods described in Ref. 5 and details of structural characterisation and purity checks can be found there.
II SQUID Magnetometry
Magnetic susceptibility measurements were carried out on a Quantum Design MPMS-XL SQUID magnetometer under zero-field cooled and field cooled conditions in a measuring field of . The evolution of zero-field susceptibility with temperature for a representative set of samples is shown in Fig. 2 (a more complete data set can be found in Ref. 5 and the superconducting values for all studied samples are indicated in Fig. 1). Also shown is the evolution of the estimated superconducting volume fraction with doping [Fig. 2 (inset), shown also by the shading of the superconducting phase in Fig. 1], which suggests that samples with are fully superconducting. No traces of magnetic impurities, such as Fe, were identified by these measurements in any of our samples.

III Zero-field SR

To probe the magnetic order parameter in NaFe1-xCoxAs, zero-field (ZF) SR measurements were made on samples with using the GPS spectrometer at the Swiss Muon Source and the MuSR spectrometer at the ISIS facility. Fig. 3 shows example spectra measured at K. For small , we observe oscillations in the time dependence of the muon spin polarization (via the positron decay asymmetry), which are strongly indicative of magnetic long-range order (LRO). These become less distinct with increasing and are not discernible for . The frequencies of the oscillations are proportional to the local magnetic field at the muon site(s) and scale with the ordered moment, so any one of them may be considered an effective magnetic order parameter for the system.
To extract the order parameter as a function of temperature and locate , the oscillating asymmetry function for the materials with were fitted to the expression , with the frequencies held in fixed proportion. For all samples, except stoichiometric NaFeAs, it was found that two frequencies were required to fit the data (i.e. ) with one around 20 times larger than the other. In the undoped compound the addition of a third component with a frequency very similar in value to the the other low frequency component, slightly improved the fit [5]. As the damping rates, , of all oscillations increase with , suggesting a rising level of magnetic disorder, we suggest that the third frequency is not resolvable in the doped compounds. For all samples with , it was found that the amplitude of the high frequency component, , made up between 55-65 of the total oscillating asymmetry and the low frequency component(s) accounted for the remainder. Muon precession frequencies for this series, extrapolated to zero-temperature, are shown in Table 1 along with those observed in other iron-arsenide systems for comparison. It is notable that the high frequency component in NaFeAs is markedly lower than that observed in the other iron-arsenides listed, and we return to this point later.
| Compound | Frequencies (MHz) | Ref. |
|---|---|---|
| NaFeAs | 10.9*, 0.9, 0.5 | Our Work |
| LaFeAsO | 23*, 3 | [6] |
| SrFeAsF | 22.2* , 2.0 | [7] |
| BaFe2As2 | 28.8*, 7 | [8] |
| SrFe2As2 | 44* , 13 | [9] |
| FeAs | 38.2, 22.7* | [10] |
For the remaining samples () a fast-relaxing component is observed at early times that disappears as increases. These data are best fitted to a relaxation function , which combines a slowly-relaxing Gaussian function, attributable to the magnetism of static and disordered moments probably of nuclear origin (a Gaussian Kubo-Toyabe function with the same magnetic field distribution fits just as well in this regime), added to a fast exponential relaxation. This fast relaxing component is most likely attributable to magnetic fluctuations of electron spins which quickly dephase muons. The fact that these two contributions are summed suggests that only a fraction of the muons are dephased by the electronic fluctuations. This implies that, for , samples show some degree of inhomogeneous magnetism (IM). For the materials in this region we observed a decrease in the relative amplitude of the fast component, , indicating that the extent of the magnetically fluctuating regions decreases as increases. Our muon data show no sign of signals from the most common impurities in iron arsenide compounds [10].

The low values of the ZF muon precession frequencies in NaFeAs, compared to those seen in other iron-based superconductors (see Table 1), indicate that the moment is correspondingly low. Neutron scattering measurements indeed indicate a low moment, 0.09(4) , on the Fe site in pure [11] NaFeAs. Our ZF-SR data can be used to make an independent estimate of this moment, along with its variation with . We can obtain the probability [shown in the inset of Fig. 4(a)], that is the probability of taking a particular value given that we observe a set of precession frequencies, , using Bayes’ theorem to invert the probability of observing a set of precession frequencies given a particular Fe moment (which is easily calculable from dipole-field simulations). This method (see Refs. 12 and 13) allows us to provide a quantitative estimate of , assuming the magnetic structure to be as determined in Ref. 11, ignoring any hyperfine coupling and constraining the muon location to be at least from an atom site. This estimate is in good agreement with the value from neutron scattering [11]. The dependence of as a function of is shown by the solid circles in Fig. 4(a) and hence the dependence of as a function of is shown in Fig. 4(b). It is noticeable that (and hence ) tends to zero more quickly than . This suggests it is the collapse of the moment that destroys the magnetic state.
IV X-ray Powder Diffraction (XRPD)
To probe the structural distortion in NaFe1-xCoxAs we performed XRPD studies of samples with on the ID31 beamline at ESRF. In Ref. 5 the distortion was characterised as a transition from a high temperature tetragonal () phase to a low temperature orthorhombic () phase, with . In order to analyse the variation in the size of this distortion with temperature and doping, we fitted data at all temperatures to a phase. In the TOPAS Academic software [15], the lattice parameters were defined as and , with both and allowed to vary. The data were then fitted to this model using a structure-independent Pawley refinement [14] and a typical refinement is shown in Fig. 5. At high temperatures and/or dopings, where was sufficiently low as to only cause peaks to broaden rather than split, a set of refinements with fixed at zero (i.e. using a tetragonal model) was carried out. Comparing the statistics of the two models allowed us to confirm the temperatures at which the structural distortion was no longer resolvable. Plots of vs T for all samples with a resolvable distortion are shown in Fig. 6(a). These data sets have been fitted to the function to locate , with allowed to vary and fixed around the mean-field value of .
Combining from SR, from XRPD and measurements of superconducting and volume fraction from SQUID magnetometry, allows us to produce the phase diagram in Fig. 1, showing that the superconductivity, magnetism and structural distortion coexist for , with the superconducting volume fraction increasing with increasing . The results of our ZF-SR experiments indicate that the magnetism weakens as is increased, with the system unable to sustain magnetic LRO for . However, IM and the structural distortion coexist with bulk superconductivity in the region .

Further insight into the effect of the reduction in the strength of the magnetism may be obtained by comparing the magnetic and structural order parameters, and respectively, as shown in Fig. 6. A reduction in both and is apparent as is increased, along with a marked suppression of these order parameters with decreasing in the more highly doped samples (indicated by arrows in Fig. 6). The suppression of the structural distortion is evident in Fig. 5(inset). In this figure the difference in the fitted values () of the orthorhombic 022 and 202 reflections (into which the tetragonal 122 peak splits) falls on cooling from to (having increased on cooling from to ). We note that the suppression of both and at low is observed in those samples with a full superconducting volume fraction, in agreement with what is seen in other pnictide families [3, 16].

V Transverse-field SR
To further probe the region above we have used transverse field SR, which also provides a method of probing the superconducting state of type-II superconductors [17]. A magnetic field is applied perpendicular to the initial muon-spin direction, which also produces a vortex lattice in the material’s superconducting phase. This results in a distribution in the local field across the sample, whose rms width can be extracted from the muon precession. Contributions to arise from superconductivity, static electronic magnetism and nuclear moments (the latter being small and temperature-independent) and add in quadrature. The measured temperature dependence of is plotted in Fig. 7 and for each sample studied we find that rises sharply on cooling through the superconducting (found independently from SQUID magnetometry) consistent with a contribution to the broadening from the vortex lattice. In addition, we observe a contribution to from magnetism which decreases steadily as increases from 0.015. For the magnetic contribution is negligible and the temperature dependence of is consistent with that expected for conventional superconducting order [solid line in Fig. 7(d)]. It is likely that in the materials for the IM is associated with a non-zero moment on the Fe site, but the moment is insufficient to stabilize a fully ordered magnetic state. We then associate the increase of just above the superconducting with the onset of the IM state. We also observe a peak in at around 17 K (most noticeable in the sample with but weakened and broadened for higher ) which may be due to increased correlation between the static moments (but which stops short of LRO, as we do not observe a precession signal in ZF-SR). This peak is also observed in the ZF amplitude of the fast-relaxing component for the sample [Fig. 7(a)], lending further weight to this interpretation.
We can extract an estimate of the magnetic contribution to in the IM regime by assuming that a magnetic contribution and a non-magnetic contribution (the latter assumed to be that of the sample) add in quadrature. This rms field width can then be used to provide an estimate of the precession frequency [] that would have been observed if the moments in the IM state ordered, and we plot these as open circles in Fig. 4(a). By assuming the same scaling between frequency and as for the AF-ordered region, we can use these values to estimate which is plotted in Fig. 4(b) using open circles. These data show that as increases, the moment on the Fe site undergoes a process of steady suppression, initially resulting in a loss of AF order as the order loses long-range coherence but then collapsing further in the IM state.

VI Discussion
It has recently been suggested that the structural transition in the iron pnictides is driven by magnetic fluctuations [18], rather than by magnetic order. The fluctuations could be of different types: spin-nematic fluctuations [18, 19], ferro-orbital fluctuations or critical fluctuations [22, 23]. Our discussion will focus on the spin-nematic model of Ref. 18 which we believe explains the main features of our data. The theoretical picture is motivated by the magnetic structure found in these materials, where Fe spins are coupled antiferromagnetically for Fe-Fe bonds along one diagonal of the two-Fe tetragonal unit cell and ferromagnetically along the other diagonal. This results in two coupled antiferromagnetic sublattices with coplanar staggered magnetization. The sublattice coupling is related to a symmetry, which allows two possible orientations of stripes in the magnetic structure. This symmetry is broken by nematic order, which can be present with zero sublattice magnetization and whose onset may therefore occur at temperatures above any magnetic ordering temperature. The result of this nematic order is to bias the magnetic fluctuations along a particular stripe orientation. Crucially, the nematic order parameter couples to the lattice, causing bonds between neighboring (anti)parallel spins to (expand) contract and this leads to the observed structural distortion. The prerequisite for nematic order is a large, but finite, magnetic correlation length, whose occurrence at elevated temperatures is probable for materials in both the magnetically ordered and IM region of the phase diagram of NaFe1-xCoxAs.
From this point of view it is magnetic fluctuations, biased by nematic order, that not only lead to magnetic order, but also drive the structural distortion. Substituting Fe by Co causes a reduction in the strength of these magnetic fluctuations and this suppresses both the magnetic order and the structural distortion. Our measurements show that on increasing the structural and magnetic order parameters weaken until the fluctuations can no longer sustain magnetic order above . Further substitution of Fe by Co continues to weaken the fluctuations and this coincides with the weakening of the structural distortion order parameter until fluctuations can no longer sustain the structural order parameter for . This weakening of the magnetic fluctuations is coincident with a strengthening of superconductivity in NaFe1-xCoxAs. This is also consistent with the nematic order picture, which predicts a competition between superconductivity and magnetism. Specifically, the onset of superconductivity is predicted to lead to a reduction in the static part of the magnetic susceptibility [18] which weakens the magnetic order and spin correlations. This is seen in our data, where we observe the low suppression of (i) the magnetic order parameter in the material (where long-range magnetic order is only just sustained) and (ii) the structural order parameter for (where the structural order parameter has been weakened). We note that these samples have close to full superconducting volume fraction and the dip in the order parameter is only observed for , where the superconducting order parameter has become sufficiently strong.
It is interesting to compare these results with those obtained on another “111” superconductor, LiFeAs [24, 25, 26]. A result of accommodating the smaller Li+ ion (rather than Na+) between the FeAs layers is that the edge-staring FeAs4 tetrahedra in LiFeAs are very compressed in the basal plane. Superconductivity occurs in the stoichiometric material LiFeAs, in contrast to other iron arsenide superconductors for which doping away from the formal oxidation state of Fe2+ or the application of hydrostatic pressure is required to induce superconductivity. Furthermore, stoichiometric LiFeAs does not appear to show static magnetism [27] (in contrast to NaFeAs). The present study demonstrates that substituing a small amount of Co on the Fe site strengthens the superconducting state in NaFeAs, but in LiFeAs substitution of Fe by small amounts of Co or Ni results in a steady lowering of the superconducting transition temperature [28]. For LiFeAs, is lowered monotonically at a rate of 10 K per 0.1 electrons added per formula unit irrespective of whether the dopant is Co and Ni, and at higher substitution levels superconductivity is completely suppressed. (Co and Ni have a similar structural effect as a function of the level of doping, but Ni adds twice as many electrons as Co.) The number of electrons added per formula unit is also the determinative quantity for NaFeAs, but here the superconducting state is first strengthened (as the magnetic state is destroyed) and then weakened (see Fig. 1).
Finally, the behavior of the superfluid stiffness as a function of in LiFeAs derivatives is markedly different from that of other pnictides [29], including the isostructural NaFeAs-derivatives considered here and the “1111” and “122” classes [28]. Most of the pnictides exhibit behavior more similar to the hole-doped cuprates, but LiFeAs derivatives resemble much more closely the electron-doped cuprates. The differing behavior of LiFeAs may result from the underlying structural difference introduced by the small Li+ ion, resulting in a band structure which does not favor Fermi surface nesting [30] so that the magnetic instability found in the other isoelectronic (i.e. undoped) iron arsenides does not compete successfully against superconductivity in LiFeAs.
VII Conclusion
In conclusion, we have presented a picture of NaFe1-xCoxAs in which a magnetic interaction drives both magnetic LRO and a structural distortion and weakens with the subsitution of Fe by Co, causing a decrease in the size of the ordered magnetic moment. Magnetic LRO becomes unsustainable above but the structural distortion persists until the moment in the IM state is no longer strong enough sustain it. The IM state may be characterized by a long, but finite magnetic correlation length and nematic order, which biases the magnetic fluctuations along stripes. Competing directly with magnetism is superconductivity which, on reaching full volume fraction, weakens the magnetism dramatically and is seen directly to depress the magnetic and structural order parameters at low temperature.
This work is supported by EPSRC (UK). Part of this work was carried out at the Swiss Muon Source, Paul Scherrer Institut, CH, the STFC ISIS Facility, UK and ESRF, Grenoble, FR. We thank A. Coldea, H. Luetkens and I. Mazin for useful discussions and Adrian Hill (ESRF) for technical assistance on ID31.
References
- [1] K. Ishida, Y. Nakai, and H. Hosono, Journal of the Physical Society of Japan 78, 062001 (2009).
- [2] M. R. Norman, Physics 1, 21 (2008).
- [3] S. Nandi, M. G. Kim, A. Kreyssig, R. M. Fernandes, D. K. Pratt, A. Thaler, N. Ni, S. L. Bud’ko, P. C. Canfield, J. Schmalian, et al., Phys. Rev. Lett. 104, 057006 (2010).
- [4] I. I. Mazin, D. J. Singh, M. D. Johannes, and M. H. Du, Phys. Rev. Lett. 101, 057003 (2008).
- [5] D. R. Parker, M. J. P. Smith, T. Lancaster, A. J. Steele, I. Franke, P. J. Baker, F. L. Pratt, M. J. Pitcher, S. J. Blundell, and S. J. Clarke, Phys. Rev. Lett. 104, 057007 (2010).
- [6] H.-H. Klauss, H. Luetkens, R. Klingeler, C. Hess, F. J. Litterst, M. Kraken, M. M. Korshunov, I Eremin, S.-L. Drechsler, R. Khasanov, A. Amato, J. Hamann-Borrero, N. Leps, A. Kondrat, G. Behr, J. Werner and B. Büchner, Phys. Rev. Lett. 101, 077005 (2008).
- [7] P.J. Baker, I. Franke, T. Lancaster, S. J. Blundell, L. Kerslake and S. J. Clarke, Phys. Rev. B. 79, 060402 (2009).
- [8] A. A. Aczel, E. Baggio-Saitovitch, S. L. Budko, P. C. Canfield, J. P. Carlo, G. F. Chen, Pengcheng Dai, T. Goko, W. Z. Hu, G. M. Luke, J. L. Luo, N. Ni, D. R. Sanchez-Candela, F. F. Tafti, N. L. Wang, T. J. Williams, W. Yu, and Y. J. Uemura, Phys. Rev. B 78, 214503 (2008)
- [9] A. Jesche, N. Caroca-Canales, H. Rosner, H. Borrmann, A. Ormeci, D. Kasinathan, H. H. Klauss, H. Luetkens, R. Khasanov, A. Amato, A. Hoser, K. Kaneko, C. Krellner, and C. Geibel, Phys. Rev. B 78, 180504 (2008)
- [10] P. J. Baker, H. J. Lewtas, S. J. Blundell, T. Lancaster, F. L. Pratt, D. R. Parker, M. J. Pitcher and S. J. Clarke, Phys. Rev. B 78, 212501 (2008)
- [11] S. Li, C. de la Cruz, Q. Huang, G. F. Chen, T.-L. Xia, J. L. Luo, N. L. Wang, and P. Dai, Phys. Rev. B 80, 020504 (2009).
- [12] A. J. Steele, T. Lancaster, S. J. Blundell, P. J. Baker, F. L. Pratt, C. Baines, M. M. Conner, H. I. Southerland, J. L. Manson and J. A. Schlueter, Phys. Rev. B 84, 064412 (2011)
- [13] S. J. Blundell, A. J. Steele, T. Lancaster, J. D. Wright and F. L. Pratt, arXiv:1111.1980
- [14] G. S. Pawley, J. Appl. Cryst. 14, 337-361, 1981
- [15] A. A. Coelho, Bruker AXS, Karlsruhe (2007)
- [16] D. K. Pratt, W. Tian, A. Kreyssig, J. L. Zarestky, S. Nandi, N. Ni, S. L. Bud’ko, P. C. Canfield, A. I. Goldman, and R. J. McQueeney, Phys. Rev. Lett. 103, 087001 (2009).
- [17] J. E. Sonier, J. H. Brewer, and R. F. Kiefl, Rev. Mod. Phys. 72, 769 (2000).
- [18] R. M. Fernandes, L. H. VanBebber, S. Bhattacharya, P. Chandra, V. Keppens, D. Mandrus, M. A. McGuire, B. C. Sales, A. S. Sefat, and J. Schmalian, Phys. Rev. Lett. 105, 157003 (2010).
- [19] M. G. Kim, R. M. Fernandes, A. Kreyssig, J. W. Kim, A. Thaler, S. L. Bud’ko, P. C. Canfield, R. J. McQueeney, J. Schmalian, and A. I. Goldman, Phys. Rev. B 83, 134522 (2011)
- [20] T. Saito, S. Onari, and H. Kontani, Phys. Rev. B 82, 144510 (2010).
- [21] Hiroshi Kontani, Tetsuro Saito, and Seiichiro Onari, Phys. Rev. B 84, 024528 (2011)
- [22] A. Cano, M. Civelli, I. Eremin, and I. Paul, Phys. Rev. B 82, 020408(R) (2010).
- [23] I. Paul, Phys. Rev. Lett. 107, 047004 (2011)
- [24] M. J. Pitcher, D. R. Parker, P. Adamson, S. J. C. Herkelrath, A. T. Boothroyd, and S. J. Clarke, Chem. Commun. Cambridge 5918 (2008).
- [25] X. C. Wang, Q. Q. Liu, Y. X. Lv, W. B. Gao, L. X. Yang, R. C. Yu, F. Y. Li, and C. Q. Jin, Solid State Commun. 148, 538 (2008).
- [26] J. H. Tapp, Z. Tang, B. Lv, K. Sasmal, B. Lorenz, P. C. W. Chu, and A. M. Guloy, Phys. Rev. B 78, 060505R (2008).
- [27] A. E. Taylor, M. J. Pitcher, R. A. Ewings, T. G. Perring, S. J. Clarke and A. T. Boothroyd, Phys. Rev. B 83, 220514 (2011).
- [28] M. J. Pitcher, T. Lancaster, J. D. Wright, I. Franke, A. J. Steele, P. J. Baker, F. L. Pratt, W. Trevelyan-Thomas, D. R. Parker, S. J. Blundell and S. J. Clarke, J. Am. Chem. Soc. 132, 10467 (2010).
- [29] F. L. Pratt, P. J. Baker, S. J. Blundell, T. Lancaster, H. J. Lewtas, P. Adamson, M. J. Pitcher, D. R. Parker and S. J. Clarke, Phys. Rev. B 79, 052508 (2009).
- [30] S. V. Borisenko, V. B. Zabolotnyy, D. V. Evtushinsky, T. K. Kim, I. V. Morozov, A. N. Yaresko, A. A. Kordyuk, G. Behr, A. Vasiliev, R. Follath, B. Büchner, Phys. Rev. Lett. 105, 067002, (2010).