Laser spectroscopy and cooling of Yb+ ions on a deep-UV transition
Abstract
We perform laser spectroscopy of Yb+ ions on the 4f146s 2S1/2 - 4f135d6s 3D transition at 297 nm. The frequency measurements for 170Yb+, 172Yb+, 174Yb+, and 176Yb+ reveal the specific mass shift as well as the field shifts. In addition, we demonstrate laser cooling of Yb+ ions using this transition and show that light at 297 nm can be used as the second step in the photoionization of neutral Yb atoms.
pacs
32.30.-r, 37.10.Ty, 37.10.RsI Introduction
In the last decade trapped Yb+ ions have been a workhorse in the fields of quantum information processing [1, 2, 3], precision measurements [4, 5] and hybrid systems [6]. Yb+ has a rich energy level structure because besides pure valence-electron excitations, also electrons from a closed f-shell can be excited. This leads to unusual features such as the electric octupole transition 2S1/2-2F7/2, which is currently explored for the prospect of an ion based atomic clock, as it has a natural lifetime of several years [5, 7].
Since the work of [8], a common feature of most trapped Yb+ experiments is the continuous excitation of the ion within a four level system (Figure 1). The ion is cooled and detected on the 2S1/2-2P1/2 transition near 369 nm. A second decay channel to the metastable 2D3/2 state necessitates a second laser to avoid interruptions of the fluorescence. Light near 935 nm repopulates the ground state via the 3D state.
In this paper, we extend the available laser manipulation toolbox for trapped Yb+ ions by exciting the 4f146s 2S1/2 - 4f135d6s 3D transition at 297 nm. We perform laser spectroscopy and present frequency measurements for four isotopes. The isotope shifts contain information about the change of the charge distribution within the nucleus and about the correlations of electrons, which are intricate because of a partially filled f-shell in Yb+. Therefore they can be used to test ab-initio calculations. In addition, we show that the 297 nm light can be used as second the step in the photoionization process of neutral Yb as well as for laser cooling of single Yb+ ions. The relatively narrow line width could potentially allow to reach lower laser cooling temperatures.

II Experimental Setup
We trap single Yb+ ions in a RF Paul trap, which consists of two opposing endcap electrodes [12] separated by 150 m. The electrodes are formed from tungsten wire of 250 m diameter and are etched to a needle-like geometry [13]. By applying a radio frequency signal of 20 MHz and a few hundred Volts amplitude, the ion is trapped with secular trap frequencies of MHz and MHz. Single ions are loaded into the trap by two-step photoionization from a thermal atomic beam [14]. A stainless steel tube filled with Yb is resistively heated by a short current pulse (typically 60-80 ms, 60 A) and emits neutral Yb atoms into the trap. The atoms are resonantly excited on the 1S0-1P1 transition with laser light at 398 nm and subsequently ionized by a laser at 369 nm. The first excitation step is isotope selective. After ionization, the ion is continuously laser cooled on the 2S1/2-2P1/2 transition and the resulting fluorescence is collected by an in-vacuum objective and detected by a photomultiplier tube.
The laser system for exciting the 2S1/2-3D transition at 297 nm is based on sum frequency generation (SFG) of light at 532 nm and 672 nm. The sketch of the optical setup is shown in Figure 2. The green 532 nm laser is a commercial system (Coherent Verdi V6), whereas the red 672 nm diode laser with subsequent amplification stage is homebuilt. In order to supply an atomic frequency reference, the green laser is stabilized to the R(56)32-0 transition in molecular Iodine [15]. As the study of isotope shifts in Yb+ requires a large frequency scan range, we use the Doppler broadened absorption line (at room temperature: line width GHz) and generate an error signal by FM spectroscopy [16]. We measured the rms frequency fluctuations of the green laser to be about 20 MHz.
We achieve type-I (ooe) SFG in a doubly resonant bow-tie cavity (finesse: 75, free spectral range: GHz). The cavity length is locked to the 532 nm laser using the Hänsch-Couillaud stabilization technique [17], whereas the 672 nm laser follows the SFG cavity by the Pound-Drever-Hall locking technique [18]. By sweeping the green 532 nm laser we can scan the generated UV light continuously about 1 GHz. Input light intensities of 1 W (532 nm) and 300 mW (672 nm) yield about 10 mW of 297 nm light.

III Isotope Shifts
Spectroscopy on the 2S1/2-3D transition is performed in a double-resonance scheme. The laser at 369 nm cools the ion continuously on the 2S1/2-2P1/2 transition and yields fluorescence, which is detected. Simultaneously, the 297 nm probe laser excites the 2S1/2-3D transition. Additional 935 nm light is necessary to deplete the population of the 3D state. By sweeping the frequency of the 297 nm light, the 2S1/2-3D resonance is observed as a drop in the 369 nm fluorescence (Figure 3).
The ratio of the saturation parameters, and (, with the (saturation) intensity ()) is important for the strength of the observed signal. For the excitation into the 3D is much slower than the probing of the 2S1/2 state due to the 369 nm laser, which effectively suppresses the transition to 3D in a quantum zeno like manner. In contrast, the signal of the 369 nm 2S1/2-2P1/2 fluorescence shows a significant drop for similar saturation parameters . The steady state fluorescence is proportional to the population of the 2P1/2 state, which is given by
| (1) |
assuming fast repumping out of the 2D3/2 state and neglecting coherences. Here is the detuning of the 369 nm laser and the natural line width of the 2P1/2 state. The term describes the coupling to the 3D state
| (2) |
where is the detuning of the 297 nm laser and the natural line width of the 3D state. For typical experimental parameters of and , this results in a 20-30% drop of the fluorescence, which is consistent with our measured spectra. We typically scan the 297 nm light 400 MHz in 10 s and record the 369 nm fluorescence. The line width of the 297 nm laser, residual micromotion and the continuous driving of the 2S1/2-2P1/2 transition broaden the linewidth, which is measured to be 40 MHz. The absolute frequency is determined by measuring the frequency of the 532 nm and the 672 nm laser with a wave meter (HighFinesse WS/07). The wave meter is calibrated to the D2 (F, F’) crossover line in 87Rb and has a specified 3- accuracy of 60 MHz. In this manner we measured the 2S1/2-3D frequencies for the isotopes 170Yb+, 172Yb+, 174Yb+ and 176Yb+ (Table 1).
| Isotope | Frequency (THz) |
|---|---|
| 170Yb+ | 1008.91619(3) |
| 172Yb+ | 1008.91759(3) |
| 174Yb+ | 1008.91855(3) |
| 176Yb+ | 1008.91958(3) |

The isotope shift of a spectral line consists of two contributions, the field and the mass shift [19]. The field shift (FS) is caused by the change of the charge distribution within the nucleus and is very sensitive to the electron charge density at the nucleus . The mass shift itself has two contributions: The change in the reduced mass is taken into account by the normal mass shift (NMS) whereas the specific mass shift (SMS) describes the change in the correlations between electrons. In total, the isotope shift of a spectral line between isotopes a and b reads
| (3) |
with and () being the isotope masses and the mass of the electron. The parameter depends only on the transition frequency of the lighter isotope and is given by . A common technique to identify the field shift and the specific mass shift from measured isotope shifts is via a King plot [19]. After eliminating the normal mass shift from the measured isotope shift, the residual shift is multiplied by and the reduced mass of a reference pair (we choose 170Yb,174Yb) to obtain the modified isotope shift :
| (4) | |||||
The modified isotope shift is plotted against that of another transition and the slope of the resulting linear fit relates the field shifts:
| (5) |
We use the data from Clark et al. [20] on the 555.6 nm 1S0-3P1 transition in neutral Yb as the reference for the King plot. These data are very precise and allow to calculate the field shift [21]. For the King plot and the determination of the transition characteristic parameter, and , 170Yb was chosen as reference isotope. From Figure 4 we extract the slope and calculate and (Table 2).
| 4.16 (66) GHz | |
| 2.92 (47) GHz | |
| 1.65 (26) GHz | |
| -4.5 (4.0) GHz amu |

Our results can be interpreted in comparison with the data of Zinkstok et al. [21], who investigated a similar line in neutral Yb, namely the 4f146s2 1S0 to 4f135d6s2 1P1 transition. They found a similarly large negative specific mass shift, which is explained by the strong coupling of d- and f-electrons [19]. In contrast, our measured field shift is about 50% higher. This may reflect the fact that, in general the electron charge density at the nucleus is higher in ionic systems than in their neutral counterparts and thereby more sensitive to changes of the charge distribution within the nucleus.
IV Photoionization and laser cooling
Photoionization of Yb can be achieved by a photon at 398 nm (1S0-1P1 transition) and a second photon with a wavelength smaller than 394 nm. Here we demonstrate that light at 297 nm can be used for the second step. At the beginning of the loading sequence the Yb oven is heated for 75 ms and simultaneously the 398 nm, the 297 nm and the 935 nm laser lights are switched on. After three seconds the light at 398 nm is turned off and one second later the 369 nm laser illuminates the ion and the resulting fluorescence is recorded (Figure 5). We note that for reliable loading the oven heating time needs to be slightly longer compared to the standard loading with 369 nm light.
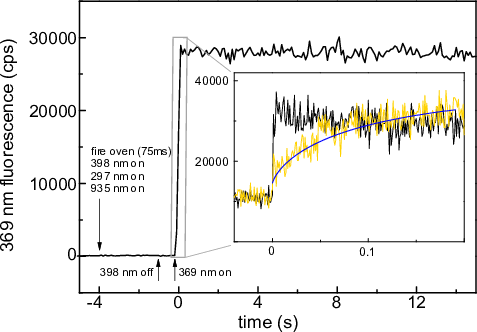
The fluorescence curve after switching on the 369 nm light depends strongly on the kinetic energy of the ion due to the Doppler shift and can be used to determine its temperature [22, 23]. In order to measure the onset of the fluorescence, we interrupt the 935 nm light 10 ms before the 369 nm light is switched on. This allows the 369 nm intensity controller to adjust without affecting the ion. We switch the 935 nm light back on 100 ms later. Only with both lights, 935 nm and 369 nm, the excitation cycle is closed and the ion continuously scatters photons. The inset in Figure 5 shows the onset of the fluorescence for two different loading sequences. In the first the 297 nm laser is set 400 MHz below the resonance frequency during the loading (yellow curve). Because of the large detuning the ion scatters only few photons on the 2S1/2-3D transition and the cooling of the ion is very inefficient. Thus, the 369 nm fluorescence starts low due to Doppler broadening and increases as the 369 nm laser cools the ion. In the second loading sequence, a smooth shifting of the 297 nm laser frequency towards the resonance (from MHz to MHz) in the first three seconds after photoionization yields a photon scatter rate, which starts immediately at its saturation value and hence indicates a cold ion (black curve).
V Conclusion
In conclusion, we have demonstrated laser spectroscopy, photoionization and laser cooling of a single Yb+ ion on the 4f146s 2S1/2 - 4f135d6s 3D transition. We measure the isotope shifts and determine the specific mass shift as well as the field shifts. The results on loading-and-cooling show that this transition complements the existing manipulation capabilities of Yb+ ions and potentially could replace the 2S1/2-2P1/2 transition. In the future, we plan to make use of the relatively narrow line width of this transition to facilitate Doppler cooling to very low temperatures, potentially directly into the vibrational ground state. Moreover, the new availability of a -system in Yb+ will allow for new ways of quantum state manipulation and, for example, EIT cooling [24, 25].
VI Acknowledgments
We would like to thank Sebastien Garcia, Neil McDonald, Ben Metcalf, Christopher Overstreet and the workshop of the Cavendish Laboratory. This work has been supported by EPSRC (EP/H005679/1) and ERC (Grant No. 240335).
References
- [1] D. L. Moehring, P. Maunz, S. Olmschenk, K. C. Younge, D. N. Matsukevich, L.-M. Duan, and C. Monroe, Nature 449, 68 (2007).
- [2] K. Kim, M.-S. Chang, S. Korenblit, R. Islam, E. E. Edwards, J. K. Freericks, G.-D. Lin, L.-M. Duan, and C. Monroe, Nature 465, 590 (2010).
- [3] N. Timoney, I. Baumgart, M. Johanning, A. F. Varon, M. B. Plenio, A. Retzker, and C. Wunderlich, Nature 476, 185 (2011).
- [4] T. Schneider, E. Peik, and C. Tamm, Phys. Rev. Lett. 94, 230801 (2005).
- [5] M. Roberts, P. Taylor, G. P. Barwood, W. R. C. Rowley, and P. Gill, Phys. Rev. A 62, 020501 (2000).
- [6] C. Zipkes, S. Palzer, C. Sias, and M. Köhl, Nature 464, 388 (2010).
- [7] M. Roberts, P. Taylor, G. P. Barwood, P. Gill, H. A. Klein, and W. R. C. Rowley, Phys. Rev. Lett. 78, 1876 (1997).
- [8] A. S. Bell, P. Gill, H. A. Klein, A. P. Levick, C. Tamm, and D. Schnier, Phys. Rev. A 44, R20 (1991).
- [9] S. Olmschenk, K. C. Younge, D. L. Moehring, D. N. Matsukevich, P. Maunz, and C. Monroe, Phys. Rev. A 76, 052314 (2007).
- [10] R. W. Berends, E. H. Pinnington, B. Guo, and Q. Ji, Journal of Physics B: Atomic, Molecular and Optical Physics 26, L701 (1993).
- [11] E. Bièmont, J.-F. Dutrieux, I. Martin, and P. Quinet, Journal of Physics B: Atomic, Molecular and Optical Physics 31, 3321 (1998).
- [12] C. Schrama, E. Peik, W. Smith, and H. Walther, Optics Communications 101, 32 (1993).
- [13] L. Deslauriers, S. Olmschenk, D. Stick, W. K. Hensinger, J. Sterk, and C. Monroe, Phys. Rev. Lett. 97, 103007 (2006).
- [14] C. Balzer, A. Braun, T. Hannemann, C. Paape, M. Ettler, W. Neuhauser, and C. Wunderlich, Phys. Rev. A 73, 041407 (2006).
- [15] P. Jungner, S. Swartz, M. Eickhoff, J. Ye, J. Hall, and S. Waltman, IEEE Transactions on Instrumentation and Measurement 44, 151 (1995).
- [16] G. C. Bjorklund, M. D. Levenson, W. Lenth, and C. Ortiz, Applied Physics B: Lasers and Optics 32, 145 (1983).
- [17] T. Hänsch and B. Couillaud, Optics Communications 35, 441 (1980).
- [18] R. W. P. Drever, J. L. Hall, F. V. Kowalski, J. Hough, G. M. Ford, A. J. Munley, and H. Ward, Applied Physics B: Lasers and Optics 31, 97 (1983).
- [19] W. H. King, Isotope Shifts in Atomic Spectra (Plenum Press, 1984).
- [20] D. L. Clark, M. E. Cage, D. A. Lewis, and G. W. Greenlees, Phys. Rev. A 20, 239 (1979).
- [21] R. Zinkstok, E. J. van Duijn, S. Witte, and W. Hogervorst, Journal of Physics B: Atomic, Molecular and Optical Physics 35, 2693 (2002).
- [22] J. H. Wesenberg, R. J. Epstein, D. Leibfried, R. B. Blakestad, J. Britton, J. P. Home, W. M. Itano, J. D. Jost, E. Knill, C. Langer, R. Ozeri, S. Seidelin, and D. J. Wineland, Phys. Rev. A 76, 053416 (2007).
- [23] R. J. Epstein, S. Seidelin, D. Leibfried, J. H. Wesenberg, J. J. Bollinger, J. M. Amini, R. B. Blakestad, J. Britton, J. P. Home, W. M. Itano, J. D. Jost, E. Knill, C. Langer, R. Ozeri, N. Shiga, and D. J. Wineland, Phys. Rev. A 76, 033411 (2007).
- [24] G. Morigi, J. Eschner, and C. H. Keitel, Phys. Rev. Lett. 85, 4458 (2000).
- [25] C. F. Roos, D. Leibfried, A. Mundt, F. Schmidt-Kaler, J. Eschner, and R. Blatt, Phys. Rev. Lett. 85, 5547 (2000).