BL Lacertae objects beyond redshift 1.3 - UV-to-NIR photometry and photometric redshift for Fermi/LAT blazars
Abstract
Context. Observations of the -ray sky with Fermi led to significant advances towards understanding blazars, the most extreme class of Active Galactic Nuclei. A large fraction of the population detected by Fermi is formed by BL Lacertae (BL Lac) objects, whose sample has always suffered from a severe redshift incompleteness due to the quasi-featureless optical spectra.
Aims. Our goal is to provide a significant increase of the number of confirmed high-redshift BL Lac objects contained in the 2 LAC Fermi/LAT cataloge.
Methods. For 103 Fermi/LAT blazars, photometric redshifts using spectral energy distribution fitting have been obtained. The photometry includes 13 broad-band filters from the far ultraviolet to the near-IR observed with Swift/UVOT and the multi-channel imager GROND at the MPG/ESO 2.2m telescope. Data have been taken quasi-simultaneously and the remaining source-intrinsic variability has been corrected for.
Results. We release the UV-to-near-IR 13-band photometry for all 103 sources and provide redshift constraints for 75 sources without previously known redshift. Out of those, eight have reliable photometric redshifts at , while for the other 67 sources we provide upper limits. Six of the former eight are BL Lac objects, which quadruples the sample of confirmed high-redshift BL Lac. This includes three sources with redshifts higher than the previous record for BL Lac, including CRATES J0402-2615, with the best-fit solution at .
Key Words.
Techniques: photometric, (Galaxies:) BL Lacertae objects: general, Galaxies: distances and redshifts1 Introduction
Since its launch in 2008, the Fermi Space Laboratory has dramatically extended our view of the high-energy sky. The recently released 24-month catalog (2LAC) of Active Galactic Nuclei (AGN) detected by the Large Area Telescope (Atwood et al., 2009, LAT; ) revealed 885 high-significance sources, the large majority of them being blazars (Ackermann et al., 2011). The latter form the most extreme class of AGN with their observational characteristics governed by the small angle between their relativistic jets and the observer’s sight line (Blandford & Rees, 1978). The resulting Doppler boosting makes blazars exceptionally bright sources at nearly all wavelengths and therefore visible out to high redshift.
The scientific relevance of blazars is very broad, ranging from laboratories for the physics and structure of relativistic jets (and thus the extraction of energy from the central massive black hole) (Abdo et al., 2010d, e.g.,) to probes of the extra-galactic background light (EBL) through attenuation of -ray photons (Abdo et al., 2010c, e.g.,). One of the crucial parameters for these applications is the distance to the objects, which unfortunately is not easy to obtain in most cases.
Two classes of blazars dominate the 2LAC population. These are the flat-spectrum radio quasars (FSRQs, 310 sources) and BL Lac objects (395), named after the prototype BL Lacertae (Hoffmeister, 1929). While for the former redshift measurements are routinely performed using their strong emission lines at UV-optical wavelengths, the featureless, power-law optical spectra of BL Lac objects have proven to be a challenge (Shaw et al., 2009, e.g.,). Indeed, 220 of the 395 BL Lacs in the 2LAC (55 %) lack redshift estimates. Until this incompleteness is resolved, conclusions about the EBL, the blazar sequence (Fossati et al., 1998; Ghisellini et al., 1998, e.g.,), and the blazar population in general remain tentative at best.
Several methods have been exploited to increase the BL Lac redshift sample. At low distance, one can utilize the remarkably uniform absolute brightness of the giant elliptical BL Lac host galaxies (Sbarufatti et al., 2005; Meisner & Romani, 2010) and very-high signal-to-noise optical spectroscopy to help to identify weak emission or absorption features in a few other cases (Shaw et al., 2009, e.g.,). An alternative method, applicable to the more distant sources, is the photometric redshift technique, which consists of fitting spectral energy distribution (SED) templates to multi-band photometry. Neutral hydrogen along the line of sight to the blazar will imprint a clear attenuation signature at the Lyman limit and thus allows an accurate estimate of the redshift of the absorber. Even though the absorber will be located somewhere along the line of sight and its redshift will thus not necessarily correpond to that of the blazar, photometric redshifts, , will provide a reliable lower limit on the blazar redshift.
In this paper we explore the use of ultra-violet to near-infrared quasi-simultaneous photometry to measure the redshift of 103 2LAC blazars, 86 of them without previous redshift constraints. The sample selection is described in Sect. 2 while the observations and data reduction are detailed in Sect. 3 and Sect. 4. The results and their discussion are presented in Sect. 5 and Sect. 6, respectively.
2 Sample Selection
The sample is selected mainly from the clean sample of the 24-month catalog of AGN detected by Fermi/LAT (Ackermann et al., 2011) which includes 885 high-significance -ray sources which are statistically associated with AGNs and located at high Galactic latitudes ( deg). To accomodate the location of one of our follow-up instruments in the southern hemisphere, we applied a cut in declination ( deg). Furthermore, the importance of the ultra-violet bands for the estimates lead us to discard all sources with Galactic foreground reddening of E mag, as derived from the Schlegel et al. (1998) maps. The final sample is composed of 80 sources without known redshift but with optical or radio counterpart associations from Bayesian statistics (Abdo et al., 2010a; Abdo et al., 2010b), Likelihood Ratio, or log N – log S methods (Ackermann et al., 2011) and was further extended by eight sources that do not belong to the clean 2LAC sample11 1 flagged due to analysis issues by the LAT team. In addition, observations for 16 2LAC sources with existing redshift measurements are included for verification. We emphasize here that our sample is not statistically complete, but biased by selection. The final list of 104 targets is presented in Table 1. Of those, 82 have been classified as BL Lac objects, three as a FSRQ, and the remaining 19 are of unknown type (Ackermann et al., 2011).
| Name | FGL Namea | b | b | offset [′′]c | EB-V [mag]d |
|---|---|---|---|---|---|
| CRATES J0001-0746 | 2FGLJ0000.9-0748 | 00:01:18.00 | -07:46:26.9 | 0.2 | 0.03 |
| CRATES J0009+0628 | 2FGLJ0009.0+0632 | 00:09:03.93 | 06:28:21.3 | 1.1 | 0.07 |
| CRATES J0021-2550 | 2FGLJ0021.6-2551 | 00:21:32.56 | -25:50:49.1 | 0.8 | 0.02 |
| 1RXS J002209.2-185333 | 2FGLJ0022.2-1853 | 00:22:09.26 | -18:53:34.9 | 3.1 | 0.03 |
| RX J0035.2+1515 | 2FGLJ0035.2+1515 | 00:35:14.71 | 15:15:04.2 | 3.4 | 0.07 |
| .. | .. | .. | .. | .. | .. |
a: Fermi/LAT ID.
b: GROND coordinates of the optical counterpart with typical uncertainties of 03 in both directions.
c: Offset of counterpart location from those given in Ackermann et al. (2011).
d: From Schlegel et al. (1998).
3 Observations
The observations were performed with the Ultraviolet and Optical Telescope (Roming et al., 2005, UVOT;) onboard the Swift satellite (Gehrels et al., 2004) and the Gamma-ray Optical/Near-Infrared Detector (Greiner et al., 2008, GROND;) mounted on the MPI/ESO 2.2 m telescope at La Silla, Chile. Each source has been observed at least once with both instruments, although for some targets several epochs had been acquired.
The UVOT pointings have been obtained as part of the Swift fill-in program from January 2010 to October 2011. With few exceptions, they comprise observations in three optical () and three UV () lenticular filters, covering the wavelength range between 160 nm and 600 nm (Poole et al., 2008). The exposure times vary from source to source depending on visibility and brightness of the optical counterpart. Approximate values are 100 s each in and 200, 250, 400 s in , respectively. For a few sources multiple consecutive orbits, and thus longer exposures, were obtained.
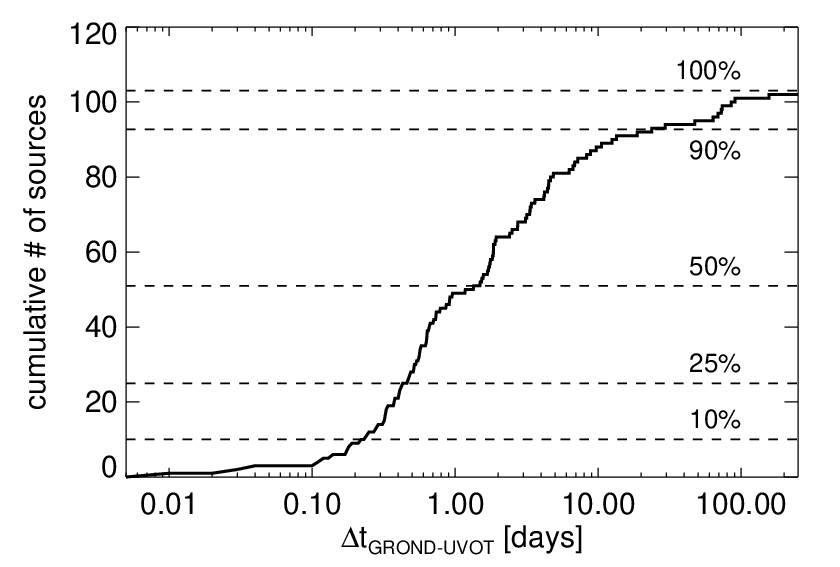
While UVOT needs to cycle through all filters in sequence, GROND observes in it’s four optical and three near-IR , bands simultaneously. This capability is particularly important for studies of fast-varying sources such as blazars as it allows the construction of a reliable spectral energy distribution (SED) without the need to correct for source-intrinsic variability. Unfortunately, scheduling limitations rarely allowed simultaneous observations with both instruments, UVOT from space and GROND from the ground. However, in order to minimize the impact of variability on the combined SED, GROND observations were executed as close as possible in time to the Swift pointings. Except in a few cases where visibility or weather constraints lead to offsets of more than 10 d, observations were typically achieved within 1-2 d of each other (see Fig. 1). The uncertainties associated with these offsets will be discussed in Sect. 4.3.
A typical GROND observation had an integration time of 2.4 min in () and 4.0 min in (, ).
4 Data & Analysis
4.1 Swift/UVOT and GROND
UVOT photometry was carried out on pipeline processed sky images downloaded from the Swift data center 22 2 http://www.swift.ac.uk/swift_portal, following the standard UVOT procedure (Poole et al., 2008). Source photometric measurements were extracted from the UVOT imaging data using the tool uvotmaghist (v1.1) with a circular source extraction region that ranged from 35-5′′ radius to maximise the signal-to-noise. In order to remain compatible with the effective area calibrations, which are based on 5" aperture photometry (Poole et al., 2008), an aperture correction was applied where necessary. This correction was at maximum 5–6 % of the flux, depending on the filter. For the further analysis, all magnitudes were converted into the AB system and are presented in Tab. 2. Typically achieved 3- limiting magnitudes are and .
| Name | UT Datea | AB Magnitudeb | c | |||||
| [mag] | ||||||||
| CRATES J0001… | 2010/10/14 10:40 | 0.01 | ||||||
| CRATES J0009… | 2010/12/07 08:55 | -0.24 | ||||||
| CRATES J0021… | 2010/11/18 18:32 | 0.09 | ||||||
| 1RXS J002209.2… | 2010/11/18 13:49 | -0.08 | ||||||
| RX J0035.2… | 2011/01/14 01:08 | -0.24 | ||||||
| .. | .. | .. | .. | .. | .. | .. | .. | .. |
a: Approximate start time of exposure.
b: Corrrected for Galactic foreground reddening. Upper limits are 3-.
c: Variability-correction factor to be applied to GROND photometry (see text).
The GROND data (Tab. 3) were reduced and analyzed with the standard tools and methods described in Krühler et al. (2008). The photometry was obtained using point-spread-function (PSF) fitting and calibrated against observations of fields covered by the SDSS Data Release 8 (Aihara et al., 2011). Due to the undersampled PSF in the near-infrared, the photometry was measured from apertures with the sizes corresponding to the Full-Width at Half Maximum (FWHM) of field stars and calibrated against selected 2MASS stars (Skrutskie et al., 2006). This resulted in 1 accuracies of 0.04 mag (), 0.03 mag (), 0.05 mag (), and 0.07 mag () for the absolute calibration. While the SDSS calibration directly provides magnitudes in the AB system, the near-IR photometry required further transformation from the 2MASS-native Vega system into AB. Typically achieved 3- limiting magnitudes are and .
| Name | UT Datea | AB Magnitudeb | ||||||
|---|---|---|---|---|---|---|---|---|
| CRATES J0001… | 2010/10/14 03:33 | |||||||
| CRATES J0009… | 2010/12/12 00:41 | |||||||
| CRATES J0021… | 2010/11/23 00:13 | |||||||
| 1RXS J002209.2… | 2010/11/23 00:21 | |||||||
| RX J0035.2… | 2011/01/14 00:48 | |||||||
| .. | .. | .. | .. | .. | .. | .. | .. | .. |
a: Exposure start time.
b: Corrrected for Galactic foreground reddening. Not corrected for variability. Upper limits are 3-.
Correction for Galactic foreground extinction was performed following the procedure described in Cardelli et al. (1989) with EB-V from Schlegel et al. (1998). For the UVOT bands, the correction factors presented in Kataoka et al. (2008) were used. Uncertainties in EB-V (Schlegel et al., 1998, 10 %;) and in the reddening law produce an additional contribution to the photometric error budget. As this systematic uncertainty is coupled between the the photometric bands for a given position in the sky, its impact on the SED fitting is smaller than the contribution to the photometry in each individual filter. An exact calculation is very complex. Thus, we adopt a conservative 5 % of the reddening value in each band which is added in quadrature to the photometric uncertainties.
4.2 Counterpart selection and morphology
Astrometric solutions for the GROND optical bands have been obtained through comparison with USNO or, if available, with SDSS measurements, achieving a typical rms of 03 in both coordinates. For the large majority of our targets (91) only a single optical source was found within 2′′ radius of the location given in the 2LAC catalog. For an additional twelve objects isolated candidate counterparts were detected at offsets of up to 6′′. In one case (CGRaBS 1407-4302), several blended sources made a reliable identification impossible. Counterpart coordinates and offsets for the 103 sources with identification are given in Tab. 1. Most of the identified optical sources are bright and point-like with typical magnitudes in the GROND -band of 16–18 mag (Figure 2).

The source morphology can be used as a prior for the selection of the SED template library (see Sect. 4.4) and redshift range, i.e., clearly extended sources will have a contribution from the host galaxy emission to the observed SED and are likely located at low redshift. A simple morphological distinction in point-like and extended has been performed on the GROND images and will be used for discussing the reliability of the estimates.
4.3 Variability correction
The optical emission of blazars is known to vary on a wide range of time scales. Brightness variations range from a few tenths of a magnitude within minutes to days (Racine, 1970; Miller et al., 1989; Carini et al., 1991; Urry et al., 1993, e.g.,) to several magnitudes over weeks to years (Ciprini et al., 2003; Raiteri et al., 2005, e.g.,). This variability contributes significantly to the uncertainties when constructing an SED from non-simultaneous multi-band, multi-instrument observations.
As GROND observes in all seven bands at the same time, the to photometry can be considered as a snapshot of the SED and is thus unaffected by variability on time scales longer than the exposure of an individual observation. This leaves two areas where a proper treatment of variability has to be performed, i) between the exposures in the individual UVOT filters and ii) between the GROND and UVOT pointings.
UVOT observes in each band separately and, for our program, typically cycled through its filters in a specific order (). A complete sequence in all six bands took min, during which time the target may vary in brightness. Without a priori knowledge of the spectral shape, this variability can only be accounted for statistically, i.e., by including an additional contribution to the systematic uncertainties. For this purpose we analyzed the photometry for those blazars for which multiple UVOT exposures in a single band were available. Here, we focused on the bluest filter () which would be least affected by a potential host galaxy contribution and should thus give a good representation of the maximum variability. In Fig. 3 the distribution of variability as function of time between two exposures is shown for 25 targets with accurate photometry ( mag) in each image. While variability as large as mag can be seen for some sources also on time scales of d, the median variation for d is mag, comparable to the photometric uncertainty.
The shortest time sampled between two exposures in this sample is one satellite orbit ( min) and therefore longer than it takes to cycle through the six filters. However, it is reasonable to assume that the median variation on a 12 min time scale is not much larger than the one over 96 min. Thus, we conservatively adopted mag as an additional contribution to the systematic uncertainties for all UVOT filters.

In order to correct between GROND and UVOT we made use of the spectral overlap provided by the two instruments (Krühler et al., 2011). Under the assumption that the SED remains unchanged and can be approximated by a power law and thus, that the GROND and photometry follow the same spectral slope 33 3 This is reasonable for redshift and for sources where the host galaxy contribution to the emission is negligible. See Sect. 4.4 for further discussion., color-terms can be used to derive the normalization offset. Here we used the calibration with the largest spectral overlap, namely the one between , and :
| (1) |
which is valid for (Krühler et al., 2011). These corrections, (Tab 2), were calculated for all sources with accurate photometry in , and ( mag). They were computed for each object individually and applied to the GROND photometry, shifting it in line with UVOT. Typically values are of the order of mag (Fig. 4). In cases where multiple epochs were available, we used the closest pair of GROND and UVOT observations. The final SED for each source corresponds to the best possible reconstruction between 160–2200 nm at the time of the UVOT observation. No correction was performed for sources where the photometric uncertainty ( mag in , and/or ) was larger than the typical .

For a few sources, the emission from the underlying host galaxy contributes significantly to the overall SED (see Sect. 4.4). While the blazar emission can still vary, the host contribution naturally remains unchanged, violating the assumption of a constant SED slope. Thus, no variability correction was performed in those cases where the UV to optical SED clearly deviates from a power law.
4.4 SED fitting
The photometric redshift computation was performed with the publically available LePhare code v.2.2 (Arnouts et al., 1999; Ilbert et al., 2006). The program uses the simple fitting method to differentiate between a theoretical and an observed photometric catalogue. We used three custom template libraries for comparison with our GROND and UVOT photometry. The first was composed of 40 power law SEDs of the form with ranging from 0 to 2 in steps of 0.05 and describes primarily the central-engine dominated blazars. Here, the source-intrinsic extinction was assumed to be zero and the luminosity prior was choosen to cover the expected range of absolute magnitudes (Véron-Cetty & Véron, 2010, ;). Such a simple model is a good approximation for the UV-near-IR SEDs of BL Lacs, which form the bulk of our sample. Also FSRQs, if their emission lines are not dominant, can be modeled with a power law to first order. The second library contains templates of normal (inactive) galaxies and galaxy/AGN hybrids (Salvato et al., 2009; Salvato et al., 2011) and has been implemented in order to model host galaxy dominated objects. If the host contribution is significant, the 4000 Å break can emerge and potentially be misinterpreted as a Lyman-limit. While for the galaxy models intrinsic extinction was again neglected, a different luminosity prior of was chosen to allow for the expected fainter host magnitudes. The third library consists of a wide range of stellar templates (Pickles, 1998; Bohlin et al., 1995; Chabrier et al., 2000), included to test against potential false associations. For each source in our sample, all three libraries were fit independently.
The most prominent spectral feature used to measure for blazars is caused by the absorption through neutral hydrogen along the line of sight. At the Lyman-limit moves into the wavelength covered by the UVOT and starts to suppress the flux in the filter. While this is the theoretical lower limit on for the combined GROND and UVOT coverage, uncertainties associated with the photometry and modeling will shift it to a higher redshift. Usually one would use a spectroscopic training sample to evaluate the redshift range and accuracy which is accessible with our SEDs. As the majority of the sources with known redshift in our sample are located at , they alone do not suffice to provide a statistically meaningful test of the method. Instead we assess the reliability in our photometric redshift computation with a Monte-Carlo approach.
Here, we simulated 27,000 test power-law SEDs with spectral slopes ranging from 0.5 to 2, redshifts from 0 to 4, and at three apparent magnitudes, mag. For each source, the photometry in the individual bands was scattered around the model magnitudes with a brightness-dependent statistical contribution and with a component representing the systematic uncertainties from the photometric calibration and variability correction. The resulting SEDs were fed back into LePhare and the output was compared to the input value.
As can be seen in Fig. 5, there is a good correspondence between the input and the recovered redshift for . In particular for bright sources ( mag) the number of outliers , defined as the number of sources with , drops steeply above this redshift. For fainter sources ( mag), the increasingly less constrained UV photometry causes the outlier fraction to remain high ( %) out to . A more quantitative selection can be made when using Pz, the integral of the probability distribution function at , which describes the probability that the redshift of a source is within of the best fit value. When choosing a cut at P %, the majority of the outliers at , as well as nearly all the solutions with disappear (inset Fig. 5). This confims that for power-law sources with the available photometry can only place an upper limit, and suggests that P % can be used as a criterion to identify reliable photometric redshift solutions. Selecting a higher threshold, e.g., 99 %, can further reduce the outlier fraction but will also shift the lower constrainable redshift bound to higher values. In order to reach such a very tightly peaked redshift probability distribution function more than one photometric band has to be affected by the Lyman-limit, limiting the redshift range to .

5 Results
The fit results for all 103 sources with identified counterparts are presented in Tab. 4. Here we give the photometric redshifts (and their 90 % confidence errors), the Pz values, and the best fit models for the power law and galaxy templates. No source requires a stellar template.
| Name | a | b | power law | galaxy | ||||||
|---|---|---|---|---|---|---|---|---|---|---|
| c | Pz d | c | Pz c | model | ||||||
| RX J0035.2+1515 | 1.28 | – | 1.28 | 2.6 | 90.1 | 0.90 | 0.79 | 8.7 | 75.5 | I22491_60_TQSO1_40 |
| PKS 0047+023 | 1.44 | – | 1.44 | 10.8 | 94.9 | 1.60 | 0.41 | 13.6 | 80.5 | pl_QSO_DR2_029_t0 |
| PKS 0055-328 | 1.37 | – | 1.37 | 17.7 | 95.2 | 1.25 | 0.47 | 11.2 | 38.4 | I22491_50_TQSO1_50 |
| PKS 0332-403 | 1.47 | 1.426 | 1.47 | 6.0 | 99.8 | 1.35 | 1.11 | 13.0 | 62.3 | I22491_60_TQSO1_40 |
| CRATES J0402-2615 | 1.92 | – | 1.92 | 8.6 | 100.0 | 1.25 | 1.28 | 9.5 | 48.9 | I22491_60_TQSO1_40 |
| SUMSS J053748 571828 | 1.55 | – | 1.55 | 20.5 | 99.9 | 0.80 | 1.58 | 21.5 | 99.6 | pl_I22491_30_TQSO1_70 |
| PKS 0600-749 | 1.54 | – | 1.54 | 6.9 | 98.1 | 1.20 | 0.46 | 7.5 | 58.1 | I22491_60_TQSO1_40 |
| CRATES J0630-2406 | 1.60 | – | 1.60 | 9.3 | 100.0 | 0.85 | 1.19 | 24.6 | 83.7 | I22491_60_TQSO1_40 |
| OM 235 | 1.72 | 1.549 | 1.72 | 18.2 | 99.9 | 1.10 | 1.54 | 11.9 | 94.9 | pl_I22491_30_TQSO1_70 |
| CRATES J1312-2156 | 1.77 | 1.491 | 1.77 | 7.1 | 100.0 | 0.95 | 1.60 | 18.4 | 100.0 | I22491_60_TQSO1_40 |
| CLASS J2352+1749 | 1.45 | – | 1.45 | 7.5 | 91.8 | 1.15 | 0.55 | 7.1 | 64.2 | pl_I22491_20_TQSO1_80 |
a: Best photometric redshift, see text.
b: Spectroscopic or imaging redshift (if known) from Ackermann et al. (2011).
c: Photometric redshift with 90 % confidence uncertainties.
d: Redshift probability density at .
e: Spectral slope for power law model of the form .
f: Starburst/QSO hybrid templates with varying contributions of the
two components. Template names reflect the relative contribution of
the starburst (I22491_NN) and AGN (TQSO1_NN) models to the
hybrid. “pl” marks an additional power-law component at short
wavelengths. See Salvato et al. (2011) for
details on the templates.
As discussed in the previous section, P % can be used as a good reliability criterion for the photometric redshift solution. Applying this cut to the power law model fits results in a sample of 15 sources with . Next, we also require that a source can not be fit well with a galaxy/AGN-hybrid template at low redshift (). This step is required in order to identify those sources for which a degeneracy in the photometric redshift solution does not allow a distinction between a low-redshift galaxy/AGN-hybrid and a blazar at higher redshift. In analogy with our selection for a good redshift constraint (P %), we consider P % as a reliable criterion that no adequate low-redshift galaxy/AGN-hybrid solution was found. This removes further seven sources from the sample and leaves eight candidates, all unresolved in the GROND images and with .
For three additional sources the power law and galaxy models fit similarly well (P %) and give comparable high-redshift solutions, indicating that the Lyman-limit was fit by power law and galaxy templates alike. Including those, we end up with a sample of eleven sources with reliable photometric redshift computation, all , with ranging from to . This encompasses eight sources without previous redshift measurements and three blazars with known redshift. For the latter, the photometric redshifts are within 3- of the known value (see Fig. 5), indicating an accuracy of for our method described in Sect. 4.4. The fit results and SEDs for the eleven sources are presented in Tab. 4 and Fig. 6, respectively.

For 21 sources, the galaxy library provides the better fit with P %, P %, and . All of these are best described by starburst/QSO hybrid templates at and none require an elliptical galaxy, i.e., a strong 4000 Å break. The most significant difference between the starburst/QSO hybrid templates and the power-law models is that the former exhibit strong emission lines originating from star-formation (see Salvato et al., 2009, for more details on the templates). These lines can be fit to small deviations in the photometry from a power-law and thus provide low values and apparently well-constrained solutions. However, as described in Sect. 4.3, the variability correction is not reliable when applied to non-power-law sources, as the color terms, and thus the correction factors, will be erroneous. Also, 18 of these sources have previously been classified as BL Lac objects and are therefore unlikely to show strong emission lines in their optical spectra. Given these considerations, we do not regard their galaxy-template photometric redshifts to be reliable.
There are 79 sources which are well-fit by power-law templates () but have a low Pz. In other words, the spectral slope is well defined but the photometric redshift cannot be unambiguously determined. As expected, the best solutions are predominantly at low redshift () with typical redshift probability distributions that are flat down to . For those we give the 90 % upper limit of the photometric redshift.. This sub-sample also includes eleven sources with a previously known redshift from spectroscopy or imaging, all in agreement with our limits.
We also provide the 90 % upper limit for four sources for which the power-law and galaxy libraries give similarly good constraints (PP %) but with very different redshift solutions. This degeneracy can occur, e.g., when a break in the SED is similarly well fit by the Lyman limit of a power-law model and with the 4000 Å break of a galaxy template. No is given for ten sources for which no satisfactory fit () was obtained.
6 Discussion & Conclusion
In this paper we presented redshift constraints for 103 blazars from the 2LAC catalog using UV-to-near-IR multi-band photometry obtained quasi-simultaneously with Swift/UVOT and GROND. We provided the first reliable redshift measurements for eight sources and new upper limits for an additional 66 targets. Of the eight sources with reliable redshift, seven are located at . Six of those belong to the BL Lac population. For comparison, out of the total 395 BL Lac in the 2LAC sample only two sources have previously been known to lie at (Fig. 7). Redshifts for these two, PKS~0332-403 and CRATES~J1312-2156, have also been confirmed with our photometric observations.

The six new BL Lac redshifts at represent a dramatic (from two to eight) increase of the confirmed high-z Fermi sample and thus demonstrate the opportunity that the SED template fitting technique holds for obtaining photometric redshifts for BL Lac sources. For our sample, this was possible due to the densely-covered wide spectral range (160–2200 nm), necessary for a reliable constraint of the spectral slope, the excellent ultra-violet coverage to measure the Lyman-limit, and the quasi-simultaneity of the observations, important for minimizing the impact of source-intrinsic variability. The method applied in this work overcomes significant challenges inherent in other redshift techniques, namely the simplicity of the optical emission of BL Lacs manifested as the power-law-shaped synchrotron spectral component. This complicates spectroscopic redshift measurements, which are in most cases limited to the optical wavelength regime and thus insensitive to the Lyman-limit. Instead, spectroscopy relies on the detection of very faint emission features, mainly from the underlying host galaxy. It therefore requires very high signal-to-noise, often at the cost of long exposure times. On the other hand, the photometric redshift method for BL Lac does not require significant telescope time, in particular when data from efficient multi-channel instruments like GROND are available. Its weakness, however, is that the method relies on the detection of a particular spectral feature, which, albeit strong, is located in the rest-frame far-ultra-violet. For , this is only accessible with space-based ultra-violet telescopes, and even then usually limited to redshifts above , as shown above.
The sensitivity of this method to high-redshift sources also allows the placement of upper limits for those SEDs that do not show the imprint of the Lyman-limit. Only for three targets is this boundary above . In one case, CRATES~J0250+1708 (), the optical counterpart is too faint ( mag) and only upper limits in all six UVOT bands could be obtained. The counterpart of CRATES~J0705-4847 is only detected in the GROND ( magAB) and bands and its SED and redshift are thus poorly constrained. Finally, the SED of ATG20~J0124-0625 () shows a significant break at . However, as the redshift probability distribution is broad, and the of the power law fit comparable to that of a solution for a galaxy template, the photometric redshift is considered to be unreliable. Except for those three, no other source in our sample has a best-fit photometric redshift at . Thus, CRATES~J0402-2615 can now be considered the most distant known BL Lac with a measured redshift of .
Fig. 7 indicates that our high-redshift findings are the natural extension of the existing 2LAC redshift sample. However, due to the incompletenesses of both samples, we refrain from drawing any quantitative conclusions at this stage. We note, however, the our result is general agreement with the theoretical predictions from Giommi et al. (2011). A more detailed physical interpretation of the establishment of an increased fraction of high-z BL Lacs in the 2LAC sample will be reported separately.
Acknowledgements.
We thank the referee for the valuable comments. Part of the funding for GROND (both hardware as well as personnel) was generously granted from the Leibniz-Prize to Prof. G. Hasinger (DFG grant HA 1850/28-1). MS acknowledges support by the German Deutsche Forschungsgemeinschaft, DFG Leibniz Prize (FKZ HA 1850/28-1). TK acknowledges support by the DFG cluster of excellence Origin and Structure of the Universe, by the European Commission under the Marie Curie Intra-European Fellowship Programme), as well as the DARK: The Dark Cosmology Centre, funded by the Danish National Research Foundation. FOE acknowledges funding of his Ph.D. through the Deutscher Akademischer Austausch-Dienst (DAAD). SK, DAK and ANG acknowledge support by DFG grant Kl 766/16-1. ARossi acknowledges support from the BLANCEFLOR Boncompagni-Ludovisi, né Bildt foundation. MN acknowledges support by DFG grant SA 2001/2-1. PS acknowledges support by DFG grant SA 2001/1-1. ACU, ANG, DAK and ARossi are grateful for travel funding support through MPE. We also acknowledge the use of the TOPCAT tool (Taylor 2005).References
- Abdo et al. (2010a) Abdo, A. A., Ackermann, M., Ajello, M., et al. 2010a, ApJ, 715, 429
- Abdo et al. (2010b) Abdo, A. A., Ackermann, M., Ajello, M., et al. 2010b, ApJS, 188, 405
- Abdo et al. (2010c) Abdo, A. A., Ackermann, M., Ajello, M., et al. 2010c, ApJ, 723, 1082
- Abdo et al. (2010d) Abdo, A. A., Ackermann, M., Ajello, M., et al. 2010d, ApJ, 710, 1271
- Ackermann et al. (2011) Ackermann, M., Ajello, M., Allafort, A., et al. 2011, arXiv:1108.1420
- Aihara et al. (2011) Aihara, H., Allende Prieto, C., An, D., et al. 2011, ApJS, 193, 29
- Arnouts et al. (1999) Arnouts, S., Cristiani, S., Moscardini, L., et al. 1999, MNRAS, 310, 540
- Atwood et al. (2009) Atwood, W. B., Abdo, A. A., Ackermann, M., et al. 2009, ApJ, 697, 1071
- Bergeron et al. (2011) Bergeron, J., Boissé, P., & Ménard, B. 2011, A&A, 525, A51
- Blandford & Rees (1978) Blandford, R. D. & Rees, M. J. 1978, in BL Lac Objects, ed. A. M. Wolfe, 328–341
- Bohlin et al. (1995) Bohlin, R. C., Colina, L., & Finley, D. S. 1995, AJ, 110, 1316
- Cardelli et al. (1989) Cardelli, J. A., Clayton, G. C., & Mathis, J. S. 1989, ApJ, 345, 245
- Carini et al. (1991) Carini, M. T., Miller, H. R., Noble, J. C., & Sadun, A. C. 1991, AJ, 101, 1196
- Chabrier et al. (2000) Chabrier, G., Baraffe, I., Allard, F., & Hauschildt, P. 2000, ApJ, 542, 464
- Ciprini et al. (2003) Ciprini, S., Tosti, G., Raiteri, C. M., et al. 2003, A&A, 400, 487
- Fossati et al. (1998) Fossati, G., Maraschi, L., Celotti, A., Comastri, A., & Ghisellini, G. 1998, MNRAS, 299, 433
- Gehrels et al. (2004) Gehrels, N., Chincarini, G., Giommi, P., et al. 2004, ApJ, 611, 1005
- Ghisellini et al. (1998) Ghisellini, G., Celotti, A., Fossati, G., Maraschi, L., & Comastri, A. 1998, MNRAS, 301, 451
- Giommi et al. (2011) Giommi, P., Padovani, P., Polenta, G., et al. 2011, MNRAS, in press, arXiv:1110.4706
- Greiner et al. (2008) Greiner, J., Bornemann, W., Clemens, C., et al. 2008, PASP, 120, 405
- Hoffmeister (1929) Hoffmeister, C. 1929, Astronomische Nachrichten, 236, 233
- Ilbert et al. (2006) Ilbert, O., Arnouts, S., McCracken, H. J., et al. 2006, A&A, 457, 841
- Kataoka et al. (2008) Kataoka, J., Madejski, G., Sikora, M., et al. 2008, ApJ, 672, 787
- Krühler et al. (2008) Krühler, T., Küpcü Yoldaş, A., Greiner, J., et al. 2008, ApJ, 685, 376
- Krühler et al. (2011) Krühler, T., Schady, P., Greiner, J., et al. 2011, A&A, 526, A153
- Meisner & Romani (2010) Meisner, A. M. & Romani, R. W. 2010, ApJ, 712, 14
- Miller et al. (1989) Miller, H. R., Carini, M. T., & Goodrich, B. D. 1989, Nature, 337, 627
- Pickles (1998) Pickles, A. J. 1998, PASP, 110, 863
- Poole et al. (2008) Poole, T. S., Breeveld, A. A., Page, M. J., et al. 2008, MNRAS, 383, 627
- Racine (1970) Racine, R. 1970, ApJ, 159, L99
- Raiteri et al. (2005) Raiteri, C. M., Villata, M., Ibrahimov, M. A., et al. 2005, A&A, 438, 39
- Roming et al. (2005) Roming, P. W. A., Kennedy, T. E., Mason, K. O., et al. 2005, Space Sci. Rev., 120, 95
- Salvato et al. (2009) Salvato, M., Hasinger, G., Ilbert, O., et al. 2009, ApJ, 690, 1250
- Salvato et al. (2011) Salvato, M., Ilbert, O., Hasinger, G., et al. 2011, arXiv:1108:6061
- Sbarufatti et al. (2005) Sbarufatti, B., Treves, A., & Falomo, R. 2005, ApJ, 635, 173
- Schlegel et al. (1998) Schlegel, D. J., Finkbeiner, D. P., & Davis, M. 1998, ApJ, 500, 525
- Shaw et al. (2009) Shaw, M. S., Romani, R. W., Healey, S. E., et al. 2009, ApJ, 704, 477
- Skrutskie et al. (2006) Skrutskie, M. F., Cutri, R. M., Stiening, R., et al. 2006, AJ, 131, 1163
- Urry et al. (1993) Urry, C. M., Maraschi, L., Edelson, R., et al. 1993, ApJ, 411, 614
- Véron-Cetty & Véron (2010) Véron-Cetty, M.-P. & Véron, P. 2010, A&A, 518, A10
- Wright et al. (1978) Wright, A. E., Peterson, B. A., Jauncey, D. L., & Condon, J. J. 1978, ApJ, 226, L61