Dense Molecular Gas around AGN: HCN/CO in NGC 3227Thanks: Based on observations carried out with the IRAM Plateau de Bure Interferometer. IRAM is supported by INSU/CNRS (France), MPG (Germany) and IGN (Spain).
Abstract
There is now convincing evidence that the intensity of HCN molecular line emission is enhanced around active galactic nuclei. In this paper we examine the specific case of the Seyfert galaxy NGC 3227, for which there are subarcsecond resolution data for the HCN (1-0) 88 GHz and CO (2-1) 230 GHz rotational lines, enabling us to spatially separate a circumnuclear ring at a radius of 140 pc and an inner nuclear region within 40 pc of the AGN. The HCN(1-0)/CO(2-1) flux ratio differs by more than an order of magnitude between these two regions. We carry out large velocity gradient (LVG) computations to determine the range of parameters (gas temperature and density, HCN/CO abundance ratio, column densities and velocity gradients) that yield physically plausible solutions for the observed flux ratio in the central 100 pc. The observed HCN/CO intensity ratio in the nucleus is consistent with very optically thick thermalized emission in very dense ( cm-3) gas, in which case the HCN/CO abundance ratio there is unconstrained. Alternatively, the HCN/CO intensity ratio could be due to optically thinner emissions but with very high () HCN/CO abundance ratios. This possibility is more consistent with the CO and HCN emissions seen in the nuclei of the Seyfert galaxies NGC 1068 and NGC 6951. It would imply the velocity gradients are large and the clouds may be gravitationally unbound. We estimate that the X-ray ionisation rate at radii less than 20 pc in the centre of NGC 3227 exceeds s-1. X-ray ionisation and heating may lead to high HCN/CO ratios in warm gas in a high-ionisation molecular phase near the AGN.
Key Words.
Galaxies: active – Galaxies: individual (NGC3227) – Galaxies: ISM – Galaxies: nuclei – Radio lines: galaxies1 Introduction
During the last decade there has been an increasing observational effort to understand the nature of the HCN emission from galaxies. This includes studies of HCN emission in nearby AGN and starbursts (Kohno et al., 2001; Kohno, 2005; Kohno et al., 2008; Krips et al., 2007; Krips et al., 2008) as well as luminous and ultraluminous galaxies (Graciá-Carpio et al., 2006; Graciá-Carpio et al., 2008). One result is that HCN line emission is enhanced with respect to CO in at least some AGN compared with starbursts (Kohno, 2005; Kohno et al., 2008). The high HCN/CO intensity ratios could be due to high molecular gas densities near the AGN, and/or high HCN/CO abundance ratios that might be due to elevated X-ray ionisation and heating rates near the accreting black holes. For example, in an early study, Sternberg et al. (1994) concluded that the large HCN/CO intensity ratio observed in the nuclear ( pc) region in the Seyfert-2 galaxy NGC 1068 indicates a high HCN/CO abundance ratio near the AGN. Lepp & Dalgarno (1996) and Usero et al. (2004) argued that elevated HCN/CO abundance ratios are signatures of high X-ray ionisation rates (Maloney et al., 1996; Meijerink & Spaans, 2005; Boger & Sternberg, 2005; Meijerink et al, 2007). High gas densities also likely play a role in boosting the HCN line intensity (Krips et al., 2008).
In this paper we present high resolution observations of CO (2-1) and HCN (1-0) rotational line emissions in the inner regions of NGC 3227, a nearby (D=17 Mpc; 1″ 80 pc) Seyfert galaxy for which detailed studies have been made of the stellar (Davies et al., 2006; Davies et al., 2007) and gaseous (Schinnerer et al., 2000; Hicks et al., 2009) content of its central regions. We analyze the data using large-velocity-gradient (LVG) computations. For this galaxy we again find a significant enhancement in the HCN/CO intensity ratio close to the active nucleus. The observed nuclear intensity ratio is consistent with optically thick thermalized emission in dense ( cm-3) gas. Alternatively, and especially in comparison with similar data in NGC 1068 and NGC 6951, the nuclear emissions could be tracing optically thinner emission in which the HCN/CO abundance ratio is large.
2 Observations
The analysis in this paper is based on subarcsecond resolution observations of the CO(2-1) 230.5 GHz and HCN(1-0) 88.6 GHz lines. The CO(2-1) data, for which the beam is 0.6″, were previously presented by Schinnerer et al. (2000). New 3 mm HCN(1-0) data, with a 0.9″1.2″ beam, were obtained during February 2009 in the A configuration (760 m baseline) of the six 15-meter antennas of the IRAM Plateau de Bure Interferometer. The H12CN(1-0) line at 88.6 GHz and the H13CN(1-0) line at 86.3 GHz were observed together, using a single polarisation for each 1 GHz bandwidth segment. The system temperature was 80–100 K. Atmospheric conditions were moderate, with winds and mm precipitable water vapour. Phase and amplitude variations were calibrated out by interleaving reference observations of standard calibration sources. The data were processed and calibrated using the CLIC program in the IRAM GILDAS package, and binned spectrally to a resolution of 50 km-1 to increase the signal to noise. The kinematics of the HCN(1-0) line emission in NGC 3227 are analysed by Sani et al. (2011) together with several other galaxies.
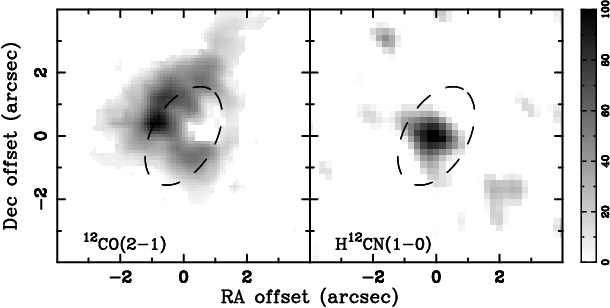
It is remarkable that despite the similar beam sizes, the CO(2-1) map clearly shows the circumnuclear ring at a radius of 140 pc (1.7″), while the HCN map shows emission from only the central region, within a few tens of parsecs from the nucleus. This can be seen clearly in Fig. 1 and is reflected in the line fluxes given in Table. 1. In the nuclear region, which we define here to be the central 1″ (i.e. pc), the flux ratio is FHCN1-0/FCO2-1=0.11; on the other hand in the circumnuclear ring, for which we take an annulus 2–4″, we find FHCN1-0/FCO2-1=0.01, an order of magnitude less. Since the emission is spatially resolved in both cases, this difference cannot be due to differing beam dilution effects. Instead it is likely to be due to differences in either molecular abundance – e.g., as a result of a distance dependent X-ray ionisation rate – or differences in excitation efficiencies – e.g., due to higher nuclear gas densities favoring HCN. (The critical H2 density of cm-3 for collisional deexcitation of CO (2-1) is significantly lower that the cm-3 for HCN (1-0).) In the next section we use large velocity gradient (LVG) models to address these issues.
| aperture | FHCN1-0 | FCO2-1 a aa a aa Scaled from the 75 mJy given by Schinnerer et al. (2000) in a 8.4″8.4″ aperture and with an uncertainty of 30%. | FHCN1-0/FCO2-1 |
|---|---|---|---|
| Jy km s-1 | Jy km s-1 | ||
| 1″ | |||
| 2″ | |||
| 4″ | |||
| 2–4″ |
3 Physical Properties of the Molecular Gas
3.1 LVG Calculations

We have constructed a new LVG code and have used it to compute the HCN (1-0) and CO (2-1) line intensities for a wide range of conditions. We calculate the line source functions assuming photon escape probabilities from spherical clouds. We use the recent Yang et al. (2010) data for the excitations and deexcitations of the CO rotational levels that are induced by collisions with H2. For HCN we use the Green & Thaddeus (1974) collisional data, as updated and listed in the RADEX database (Van der Tak et al., 2007). We have cross-checked all of our results with the LVG code RADEX, and find excellent agreement: in the parameter space we have assessed, the converged line ratios agree to within 1.5%. We assume that the HCN and CO molecules are mixed uniformly, and that the corresponding line emissions arise from gas at the same temperature and density. The luminosity ratios resulting from the model calculations are presented graphically in Fig. 2, covering the parameter space: kinetic temperature , HCN to CO abundance ratio (with is the CO abundance relative to hydrogen), H2 volume gas density , and a ratio of gas-density to velocity-gradient, or equivalently column density to linewidth, of .
In each panel in Fig. 2, the parameter-space consists of four regimes. The upper right parts correspond to local thermal equilibrium (LTE) in the optically thick limit. In this regime the transition excitation temperatures of the lines approaches the kinetic temperature of the gas. Since the line flux, in the Rayleigh-Jeans limit, is , and an interval in velocity space is , the ratio of two line fluxes measured as (e.g. in units of Jy km s-1 as used here) is in the optically thick and LTE limit. This corresponds to 0.15 for the ratio of the HCN(1-0) and CO(2-1) lines at 88.6 GHz and 230.5 GHz respectively, which is close to the observed ratio of 0.1 in the nucleus.
The upper left regions also correspond to LTE because the gas densities are high, but in this regime the line optical depths are low because the velocity gradients (or line widths) are large. For such conditions, the line intensities are linearly proportional to the molecular abundances. This behavior is reflected in the HCN/CO intensity ratios indicated by the contour values. On the left sides of the panels, the intensity ratios decrease linearly with the assumed abundance ratio , which ranges from to in Fig. 2.
The lower parts of each panel correspond to low densities for which the HCN is subthermally excited, leading to relatively higher populations in the lowest rotational levels. Again the optical depth increases from left to right as the column density increases for fixed line width.
Some regions of the parameter space may be less physically plausible because they assume very large velocity gradients. Lines of constant velocity gradient are indicated by the dashed orange lines in Fig. 2, with increasing gradients towards the upper left. For self-gravitating virialised clouds where is the velocity dispersion, is the cloud radius, and is the gas density. Treating as a velocity gradient (Goldsmith, 2001, e.g.) gives , or typically a few km s-1 pc-1, or a few tens in cases of extreme density. In Fig. 2, the virial relation is represented by the dot-dash blue line in each panel. Clouds that are unbound or at least partially pressure confined could be to the left of this line.
3.2 Analysis for NGC 3227
Curves representing the possible parameter ranges for the measured flux ratios FHCN1-0/FCO2-1 for NGC 3227 have been overdrawn for the nucleus (red lines) and circumnuclear ring (green lines), as defined in Sec. 2. If we assume that the clouds are self-gravitating, we are restricted to the points where the red and green lines intersect the dashed blue line. These show that if the clouds in the ring have a similar density to the nucleus, then the HCN abundance must be about 2 orders of magnitude lower. Alternatively, the density may differ by up to 2 orders of magnitude if the abundances are similar. We discuss this further in Sec. 3.4
In the nucleus, the flux ratio FHCN1-0/FCO2-1=0.11 is remarkably close to the LTE optically thick limit, and its locus includes a contour around this region. However, depending on the HCN abundance, the gas density at which this occurs can vary from cm-3 at the highest abundance to cm-3 at the lowest abundance we have considered, with column density cm-2/(km s-1). By considering the mean volume density of the HCN emitting region, and putting a limit on a realistic filling factor, we can restrict this range further.
The first step is to estimate the volume of the emitting region. This can be done because the HCN emission is marginally resolved. A detailed estimate of the intrinsic size – via dynamical modelling, and taking into account emission from the ring – is given in Sani et al. (2011). These authors show that the diameter is 0.54″, corresponding to 45 pc, and the scale height is 6 pc. Taking this as an indication of the size along the line of sight sets the volume of the emitting region.
The second step is to estimate the mass. We have done this in several ways since they are all uncertain.
- 1.
The LVG calculation yields a mass directly under the assumption that the ratio of the observed linewidth to the linewidth of an individual cloud is tracing the number of clouds, such that . For conditions corresponding to , T K, cm-3 and cm-2 (km s (see Sec. 3.3), the observed HCN(1-0) flux leads to a mass of M⊙.
- 2.
The standard method to estimate the mass is from the CO luminosity. We have done this directly from the CO(2-1) line flux in Table 1 using a conversion factor which includes a correction for helium (Tacconi et al., 2008). This yields M⊙.
- 3.
A similar conversion for the HCN line that has been calibrated by Krips et al. (2008) for AGN is /L (K km s-1 pc2)-1. This yields a mass of M⊙.
- 4.
As a final check, we use the dynamical mass derived from the HCN kinematics. By fitting models to account for the beam smearing, Sani et al. (2011) find M⊙. For a nominal 10% gas fraction expected in local disks and starbursts (Hicks et al., 2009), this would yield a gas mass of M⊙.
These estimates are all the same order of magnitude, and suggest that the gas mass in the central arcsec is of order M⊙. Hence we can estimate the mean density to be cm-3. Comparing this to the cloud densities above yields volume filling factors in the range 1–0.01. In this range, a lower filling factor is more physically plausible, which would tend to favour the solutions with higher cloud densities. Fig. 2 shows these have either higher temperature or less extreme HCN abundance.
3.3 Comparison to NGC 6951 and NGC 1068
NGC 1068 and NGC 6951 are two other galaxies for which the HCN(1-0)/CO(2-1) ratio has been measured on comparable pc scales. We use flux densities reported by Krips et al. (2007) for the nuclear region (denoted ‘C’ in their Table 1) of NGC 6951; and also the values for the circumnuclear disk of NGC 1068, as the sum of the red and blue channels reported in Table 3 of Usero et al. (2004). These yield line ratios (for line fluxes in Jy km s-1) of and respectively, and are denoted by the solid magenta lines on Fig. 2. These lines appear almost exclusively in the panels corresponding to the highest HCN abundance we have considered, .
In contrast to NGC 3227, in which the line emission appears to be optically thick, the loci of the magenta lines for NGC 1068 and NGC 6951 are toward the optically thin (left) side of the panels. Despite this, it is notable that there are regions of the parameter space where the contours corresponding to all 3 objects lie close together, running from lower left to upper right. The region extends from cm-3 and cm-2/(km s-1) to cm-3. It is precisely because one can attribute the observed line ratios – with different optical depths for the 3 galaxies – to similar physical properties of the gas in all these 3 objects that this locus is appealing.

Why this occurs can be seen in Fig. 3 which shows the optical depths for the HCN(1-0) and CO(2-1) transitions. The gas properties of both these panels correspond to the bottom left panel in Fig. 2 (300 K and ), and cover the same range of density and velocity gradient. These plots show clearly the characterisation of the different regions: in the lower half the HCN(1-0) line is optically thick because the density is low enough that it is sub-thermal; above the critical density, the line is in LTE and thus optically thin at low columns and optically thick at high columns. The locus where all the contours for the 3 galaxies are close together and parallel follows approximately the boundary where the HCN(1-0) line becomes optically thick. Here, a small change in physical conditions (column or density) can result in the HCN(1-0) emission switching from optically thin to optically thick.
This regime is, however, also associated with very large velocity gradients. It is km s-1 pc-1 at , but reduces as the temperature increases. Velocity gradients were not discussed explicitly by Sternberg et al. (1994) or Usero et al. (2004) in their K LVG calculations for NGC 1068. But their analyses also associate the observed properties with similarly extreme velocity gradients. Indeed, one of the main conclusions of Sternberg et al. (1994) was that in NGC1068. For the temperature they considered, this would lead to km s-1 pc-1 (matching the top left panel of Fig. 2 here). However, our LVG calculations shows that is reduced as both the temperature and density increase. When considering all 3 galaxies together, the smallest – and therefore arguably the most physically plausible – value in the parameter space we have covered is km s-1 pc-1 at K and cm-3. This location is not far from the boundary of the optically thick LTE regime discussed previously, but due to the high velocity gradient represents clouds that are either pressure confined or unbound.
Interestingly, there is evidence in NGC 1068 from recent Herschel observations with PACS of high rotational CO transitions, for a significant mass of molecular gas in the central pc at temperatures of 100 K and 400 K and densities of cm-3 (Hailey-Dunsheath et al., 2011). Similarly, in an analysis of various HCN, HCO and CO isotope transitions in the central 100 pc of NGC 1068, Krips et al. (2011) also argued in favour of warm (T K) gas. However, they also concluded that the density is of order cm-3. Our LVG calculations indicate that such densities are associated with very high velocity gradients for the observed line ratio, which we consider physically unlikely. This, combined with a comparison of the cloud density to mean density estimated in Sec. 3.2 has led us to favour the higher density solution with more moderate velocity gradient.
3.4 X-ray Ionisation rate in NGC 3227
Our LVG calculations presented above suggest that as one alternative the high HCN(1-0)/CO(2-1) ratio in the central 100 pc of NGC 3227 could be due to an exceptionally high HCN abundance, an interpretation supported by the even higher HCN/CO intensity ratios observed in the nuclei of NGC 1068 and NGC 6951. It is possible that the high HCN abundances are associated with elevated X-ray ionisation and/or heating rates near the AGN. Theoretical investigations of X-ray (or cosmic-ray) driven chemistry show that the (steady-state) molecular abundances depend primarily on the ratio of the cloud density to X-ray ionisation rate (Krolik & Kallman, 1983; Lepp & Dalgarno, 1996; Maloney et al., 1996; Meijerink & Spaans, 2005; Boger & Sternberg, 2005; Meijerink et al, 2007). Here we adopt the notation of Boger & Sternberg (2005), normalising to s-1 to give the parameter . The density refers to the total atomic plus molecular hydrogen density. In the following analysis, we first calculate the ratio in the nucleus of NGC 3227 and then compare it to ratios predicted by models of X-ray irradiated gas.
3.4.1 in NGC 3227
To estimate the X-ray ionisation rate in the central 100 pc of NGC 3227 we need to know the intrinsic spectral energy distribution from the AGN. We adopt the SXPL model of Markowitz et al. (2009) in which both the hard and soft components of the X-ray flux are modelled with power laws:
where is the photon energy in keV and is the photon flux in units of ph keV-1 cm-2 s-1. Making the usual assumption that the primary ionisation rate of hydrogen is negligible compared to the secondary ionisation rate, we then calculate the resulting ionisation rate using equation A4 of Maloney et al. (1996):
Here (as given by Maloney et al. 1996) is the number of secondary ionisations per keV of primary photoelectron energy assuming a mean-energy per ion-pair of 37.1 eV for energy deposition in a molecular hydrogen gas (Dalgarno et al. 1999); is the absorption cross section per H nucleus, for which we adopt the broken power-law fit in equation A5 of Maloney et al. (1996); and is the incident flux in units of ph keV-1. The photoionisation is dominated by photons with energies for which . We therefore take the limits of the integral to be keV and as the energy at which the optical depth due to photoelectric absorption is , ignoring attenuation above this limit. The energy at which is interpolated from Table 9.3 of Seward (2000) for the Morrison & McCammon (1983) model, for a given column density. And the column density is assumed to be proportional to distance from the AGN up to a maximum of cm-2 (Hicks et al. 2009) at 30 pc.
We have evaluated the integral at two distances: 18 pc, an area weighted mean distance from the AGN to the HCN emitting gas that corresponds to the nuclear region; and 140 pc corresponding to the distance of the circumnuclear ring. We find s-1 and s-1, about a factor 100 less primarily due to the distance related geometrical dilution of the incident X-ray flux. The inferred ionisation rates are much larger than the typical ionisation rates in Galactic clouds.
Adopting a characteristic density cm-3 from our LVG analysis in Sec. 3.3. yields in the nuclear region of NGC 3227. We note that even if the gas density were an order of magnitude higher (leading to proportionally higher ), the physical conditions will be well within the high-ionisation phase for the molecular chemistry.
3.4.2 Models of abundance ratio as a function of

The model computations of Boger & Sternberg (2005); Boger & Sternberg (2006) show that gas can exist in a high (low) ionisation phase for small (large) values of , with a density ratio of marking the cross-over between the two regimes. The HCN/CO abundance ratio can become large in the high-ionisation phase even at low gas temperatures, due to the large densities of atomic and ionic carbon. Here we have re-run these calculations using the same elemental gas-phase abundances, and with a slightly updated reaction set. Fig. 4 shows the resulting abundance ratios as a function of for 100 K gas. At very low corresponding to that in the nuclear region of NGC 3227 the HCN/CO abundance ratio approaches . For comparison, Lepp & Dalgarno (1996) find a peak value of in their calculation. These models track the abundances of numerous molecules across many orders of magnitude and show that at low , the HCN/CO abundance ratio is raised several orders of magnitude above that typically expected, to a level at which it approaches – and, given the uncertainties in such models, is commensurate with – that implied by the LVG models.
Harada et al. (2010) have shown that at elevated temperatures 300 K, rapid hydrogenation of CN to HCN can increase the HCN/CO abundances further still, and they comment that such warm gas may be present in the X-ray heated gas near AGN. We caution however, that their higher temperature models for which HCN/CO is largest, correspond to which is significantly larger than the value we are invoking as characteristic for the nucleus of NGC 3227.
The models show that a combination of X-ray ionisation and heating do yield high HCN abundances, although not yet quite as high as HCN/CO as implied by the LVG analysis in Sec. 3.3 for the nucleus. Further chemical modeling is required, but a high HCN/CO intensity ratio in the nucleus due to elevated X-ray ionisation rates appears plausible. In this picture, the lower HCN/CO intensity ratio in the ring may simply reflect the lower ionisation rate there, and not just a lower gas density in this circumgalactic environment.
4 Summary and Conclusions
We present an LVG analysis of high-resolution observations of CO (2-1) and HCN (1-0) line emissions in the central regions of the Seyfert galaxy NGC 3227. We find that
- •
The HCN(1-0)/CO(2-1) ratio in NGC 3227 is an order of magnitude higher in the central 80 pc than in the circumnuclear ring at a radius of 140 pc. NGC 6951 and NGC 1068 have similarly high published ratios in their central pc.
- •
The nuclear HCN/CO intensity ratio in NGC 3227 may reflect optically thick line emission in dense gas with only a weak constraint on the HCN/CO abundance ratio. However, our LVG calculations also indicate that the high nuclear ratios in all three of these galaxies are more consistent with a single set of physical properties corresponding to warm K, dense cm-3 gas, in which the emission lines are optically thinner, but in which the HCN/CO abundance ratio is very large . For these conditions the velocity gradients are km s-1, but would increase significantly at lower temperatures or densities. Most likely the clouds are gravitationally unbound.
- •
The X-ray ionisation rate at radii less than pc may exceed 10-13 s-1, and could plausibly lead to high HCN abundances in molecular gas in the high-ionisation phase where the ratio of the gas density to the X-ray ionisation rate is small.
Acknowledgements.
The authors thank the IRAM staff, in particular Jeremie Boissier and Sascha Trippe, for their invaluable help in obtaining and reducing the data presented in this paper. We thank J. Graciá-Carpio for many useful and interesting discussions. We thank the DFG for support via German- Israeli Project Cooperation grant STE1869/1-1.GE625/15-1.References
- Boger & Sternberg (2005) Boger G., Sternberg A., 2005, ApJ, 632, 302
- Boger & Sternberg (2006) Boger G., Sternberg A., 2006, ApJ, 645, 314
- Dalgarno et al. (1999) Dalgarno, A., Yan, M., Liu, W., 1999 ApJS, 125, 237
- Davies et al. (2006) Davies R., et al., 2006, ApJ, 646, 754
- Davies et al. (2007) Davies R., Müller Sánchez F., Genzel R., Tacconi L., Hicks E., Friedrich S., Sternberg A., 2007, ApJ, 671, 1388
- Goldsmith (2001) Goldsmith P., 2001, ApJ, 557, 736
- Graciá-Carpio et al. (2006) Graciá Carpio J., García Burillo S., Planesas P., Colina L., 2006, ApJ, 640, L135
- Graciá-Carpio et al. (2008) Graciá Carpio J., García Burillo S., Planesas P., Fuente A., Usero A., 2008 A&A, 479, 703
- Green & Thaddeus (1974) Green, S., Thaddeus, P., 1974 ApJ, 191, 653
- Hailey-Dunsheath et al. (2011) Hailey-Dunsheath S., et al., 2011, in prep.
- Harada et al. (2010) Harada N., Herbst E., Wakelam V., 2010 ApJ, 721, 1570
- Hicks et al. (2009) Hicks E., Davies R., Malkan M., Genzel R., Tacconi L., Müller Sánchez F., Sternberg A., 2009, ApJ, 696, 448
- Kohno et al. (2001) Kohno K., Matsushita S., Vila-Vilaró B., Okumura S., Shibatsuka T., Okiura M., Ishizuki S., Kawabe R., 2001, in The Central Kiloparsec of Starbursts and AGN, eds Knapen J., Beckman J., Shlosman I., Mahoney T., ASP Conf. Proc., 249, p.672
- Kohno (2005) Kohno K., 2005, in The Evolution of Starbursts, eds Hüttermeister S., Manthey E., Bomans D., Weis K., AIP Conf. Proc., vol. 783, p. 203–208
- Kohno et al. (2008) Kohno K., et al., 2008, in Far-Infrared Workshop, eds Kramer C., Aalto S., Simon R., EAS Publication Series, vol. 31, p. 65–71
- Krips et al. (2007) Krips M., et al., 2007, A&A, 468, L63
- Krips et al. (2008) Krips M., Neri R., Garciá Burillo S., Martín S., Combes F., Graciá Caprio J., Eckart A., 2008, ApJ, 677, 262
- Krips et al. (2011) Krips M., et al., 2011 ApJ, 736, 37
- Krolik & Kallman (1983) Krolik J., Kallman T., 1983, ApJ, 267, 610
- Lepp & Dalgarno (1996) Lepp S., Dalgarno A., 1996, A&A, 306, L21
- Maloney et al. (1996) Maloney P., Hollenbach D., Tielens A., 1996, ApJ, 466, 561
- Markowitz et al. (2009) Markowitz A., Reeves J., George I., Braito V., Smith R., Vaughan S., Arévalo P., Tombesi F., 2009, ApJ, 691, 922
- Meijerink & Spaans (2005) Meijerink R., Spaans M., 2005, A&A, 436, 397
- Meijerink et al (2007) Meijerink R., Spaans M., Israel F., 2007, A&A, 461, 793
- Morrison & McCammon (1983) Morrison R., McCammon D., 1983, ApJ, 270, 119
- Sani et al. (2011) Sani E., et al., MNRAS submitted
- Schinnerer et al. (2000) Schinnerer E., Eckart A., Tacconi L., 2000, ApJ, 533, 826
- Seward (2000) Seward F., in Allen’s Astrohpysical Quantities, 4th edition, ed. Cox A., p. 183
- Sternberg et al. (1994) Sternberg A., Genzel R., Tacconi L., 1994 ApJ, 436, L131
- Tacconi et al. (2008) Tacconi L., et al., 2008, ApJ, 680, 246
- Usero et al. (2004) Usero A., Garciá-Burillo S., Fuente A., Martin-Pintado J., Rodríguez-Fernández N., 2004, A&A, 419, 897
- Van der Tak et al. (2007) Van der Tak F., Black J., Schöier F., Jansen D., van Dishoeck E., 2007, A&A, 468, 627
- Yang et al. (2010) Yang B., Stancil P.C., Balakrishnan N., Forrey R.C., 2010, ApJ, 718, 1062