Observations of an Edge-enhancing Instability
in Snow Crystal Growth near -15 C
Kenneth G. Libbrecht
Department of Physics, California Institute of Technology
Pasadena, California 91125
Abstract. We present observations of the formation of plate-like snow crystals that provide evidence for an edge-enhancing crystal growth instability. This instability arises when the condensation coefficient describing the growth of an ice prism facet increases as the width of the facet becomes narrower. Coupled with the effects of particle diffusion, this phenomenon causes thin plate-like crystals to develop from thicker prisms, sharpening the edges of the plates to micron or sub-micron dimensions as they grow. This sharpening effect is largely responsible for the formation of thin plate-like ice crystals from water vapor near -15 C, which is a dominant feature in the snow crystal morphology diagram. Other faceted crystalline materials may exhibit similar morphological growth instabilities that promote the diffusion-limited growth of plate-like or needle-like structures.
1 Introduction
The formation of complex structures during solidification often results from a subtle interplay of non-equilibrium, nonlinear processes, for which seemingly small changes in molecular dynamics at the nanoscale can produce large morphological changes at all scales. One popular example of this phenomenon is the formation of snow crystals, which are ice crystals that grow from water vapor in an inert background gas. Although this is a relatively simple physical system, snow crystals display a remarkable variety of columnar and plate-like forms, and much of the phenomenology of their growth remains poorly understood. (For a review of the physics of snow crystal growth, see [1].)
Observations of snow crystal growth dating back to the 1930s [2, 1] reveal a complex and puzzling dependence on temperature. At pressures near one bar and water vapor supersaturation levels often found in clouds, for example, ice crystals typically grow into thin plate-like forms near -2 C, slender columns and needles near -5 C, very thin plates again near -15 C, and columns again below -30 C. The observed variations in snow crystal structure with temperature and supersaturation are often displayed in a snow crystal morphology diagram, as shown in Figure 1. Despite more than a half-century of study, we still do not understand the basic physical mechanisms that are responsible for the unusual temperature-dependent morphologies of growing ice crystals [1, 3, 4].

Our focus here will be on the growth of thin plates near -15 C, as the largest and thinnest crystals form in this temperature region, making this a dominant feature in the morphology diagram. Aspect ratios of or larger are commonly found with atmospheric ice crystals, where is the crystal size along the a-axis of the crystal (roughly equal to the diameter of the plate), and is the size of the plate in the c-direction (equal to the plate thickness). Large stellar plates typically have plate diameters of 2-4 mm with thicknesses of 10-20 m [2].
In modeling the growth of ice crystals from water vapor, we write the perpendicular growth velocity of a surface in the usual Hertz-Knudsen form
| (1) | |||||
where is the water vapor pressure at the growing surface, is the water vapor pressure in equilibrium with ice, is the mass of a water molecule, and is the molecular volume [1]. This relation defines the condensation coefficient, that parameterizes the attachment kinetics at the ice surface, as well as the kinetic velocity , where is the water vapor supersaturation at the surface. In general will be different for the two principal facets of ice, and for fast kinetics on non-faceted surfaces we expect
If the supersaturation had a constant value independent of location near the ice surface, then the growth of a thin plate would imply Diffusion modeling shows that the supersaturation at the edges of a thin plate is not substantially higher than at the middle of the basal facets, and for a large fast-growing plate the minimum supersaturation is actually found at the edges of the plate [1]. Thus diffusion-limited growth will generally not promote the growth of thin plates in the absence of a large ratio, and in many cases diffusion requires that we must have which further accentuates the difference in attachment kinetics on the two facet surfaces.
The problem with this simple inference is that measurements of ice crystal growth rates for faceted surfaces have yielded values of that are far smaller than what is needed to form thin plate-like crystals. For example, numerous researchers have found that ice crystals grow into roughly isometric shapes at low background pressures, where effects from particle diffusion are reduced [5, 6, 7], suggesting that is near unity for the conditions in these experiments. Since the growth of thin plates requires the discrepancy between low-pressure and high-pressure measurements necessarily requires a nontrivial explanation.
In an earlier paper we proposed a mechanism to solve this problem that we called structure-dependent attachment kinetics (abbreviated SDAK) [8]. In essence, we proposed that depends strongly on the structure of the prism facet surface, such that increases when the width of the prism facet decreases, becoming near unity when the width approaches atomic dimensions. For the case of a thin plate, the width of the facet surface on the edge of the plate is approximately where is the molecular step height and is the effective radius of curvature of the edge of the growing plate [8]. Taking m for a typical thin plate yields in the case of ice. We proposed that the SDAK mechanism leads to an edge-enhancing growth instability that promotes the formation of thin plates.
Below we present observations of a hysteresis behavior in the growth of thin plates that strongly supports our proposed SDAK mechanism. Quantitative measurements reveal that is indeed substantially larger on the edge of a thin plate than on a flat prism facet. This behavior then leads to an edge-enhancing growth instability that is responsible for the formation thin plate-like crystals near -15 C.
2 Observations
2.1 Intrinsic Growth Rates of Ice Facets
We recently published improved measurements of the growth rates of faceted basal surfaces as a function of temperature [9], indicating over a broad temperature range, and specifically percent at -15 C. Similar measurements of prism growth rates [10] give the same functional form for at -15 C, and for flat prism facets we have percent. These measurements were made in a background of air at a pressure of approximately 0.03 bar, since lower pressures reduce effects from diffusion-limited growth. Similar measurements at 1 bar yield values that are consistent with the low-pressure data [9]. These measurements are roughly consistent with previous data, although several improvements in our experimental techniques have yielded values that are higher than quoted in [1].
These data indicate that with percent at -15 C. Since this ratio is less than unity for all supersaturations, it suggests (in the absence of the SDAK mechanism) that the intrinsic growth form at -15 C should be a columnar crystal. Demonstrating this intrinsic columnar growth directly in low-pressure observations is difficult, however, since any ice surface contacting a substrate may be affected by substrate interactions. Generally we have found that these interactions reduce the nucleation barrier and yield untrustworthy growth measurements, especially at low supersaturations when the intrinsic 2D nucleation rate is low. Nevertheless, when one basal facet is flat against the substrate (as in [9]), we do occasionally observe the growth of tall columns. Since substrate interactions cannot reduce the nucleation barrier all along a tall column, our interpretation of these observations is that sometimes the substrate interactions are greatly reduced, due to some impurity coating on the substrate that we have not yet determined. When this happens we witness the intrinsic growth rates on all facets, giving columnar crystals. More typically substrate interactions increase the growth of the prism facets via enhanced nucleation where the crystal contacts the substrate, resulting in more isometric ice prisms.
Our overall conclusion from this series of measurements is that the intrinsic attachment coefficients for large facet surfaces are adequately described by the functional form above with percent and percent at -15 C. Growth at low background pressures yields mainly large faceted surfaces, and the available evidence suggests that the intrinsic growth form at -15 C may indeed be a columnar crystal. Additional low-pressure measurements, preferably with free falling or levitated crystals [11] to avoid substrate interactions, are needed to confirm this surprising conclusion. The fact that thin plates are usually observed at -15 C is then entirely because of the SDAK mechanism. The resulting edge-enhancing instability appears only at higher background pressures, since the instability depends in part on the effects of diffusion-limited growth. We now examine additional measurements supporting this claim.
2.2 Plate-on-Pedestal Growth
We begin with a detailed description of the growth of a representative crystal at -15 C in air at a pressure of one bar. Using the apparatus described in [12], we began the experiment by dropping a small hexagonal plate crystal onto a temperature-controlled sapphire substrate. The initial radius of this crystal (taken to be half the distance from one prism facet to the opposite facet) was 13.5 m, and the initial thickness was 2.5 m. The radius was determined by direct optical microscopy while the thickness was measured by broad-band interferometry, as described in [12]. Initially the temperature of an ice reservoir above the crystal was equal to the substrate temperature , so the supersaturation was equal to zero. We then slowly increased the ice reservoir temperature and thus the supersaturation above the test crystal, causing it to grow.


The crystal radius, its thickness, and the growth velocities as a function of time are shown in Figure 2, along with the supersaturation above the crystal . Note that was changed with time during the experiment by changing giving as shown in the Figure, and this was the only external experimental parameter that was changed during the run. Since the distance from the substrate to the ice reservoir was much greater than the size of the test crystal, can be assumed (for modeling purposes) to be the supersaturation at a hemispherical boundary far away from the crystal.
As was increased, the ice prism initially maintained its simple shape, namely that of a thick hexagonal plate. At roughly seconds, the morphology of the crystal changed as a thin plate-like crystal began to grow out from the upper edge of the prism. We call this “plate-on-pedestal” growth because the thin plate grew outward above the substrate, supported by a central pedestal, like one half of a capped column crystal [1].
Figure 3 shows images of the plate-on-pedestal crystal at various stages during its growth. The morphology of the thin plate during its rapid growth phase is essentially that of a sectored plate crystal [1], and from additional observations we determined that the ridges along the -axes of the crystal were on the underside of the plate, on the basal surface nearest the substrate. The top of the plate appeared to be a flat basal facet surface without ridges. In Figure 2 the radius refers to that of the top plate, while the thickness gives the overall thickness of the crystal from the substrate to the top basal surface. Once was reduced, the edge of the thin plate thickened, and eventually a thick “rib” appeared around the circumference of the plate, as seen in the last image in Figure 3.
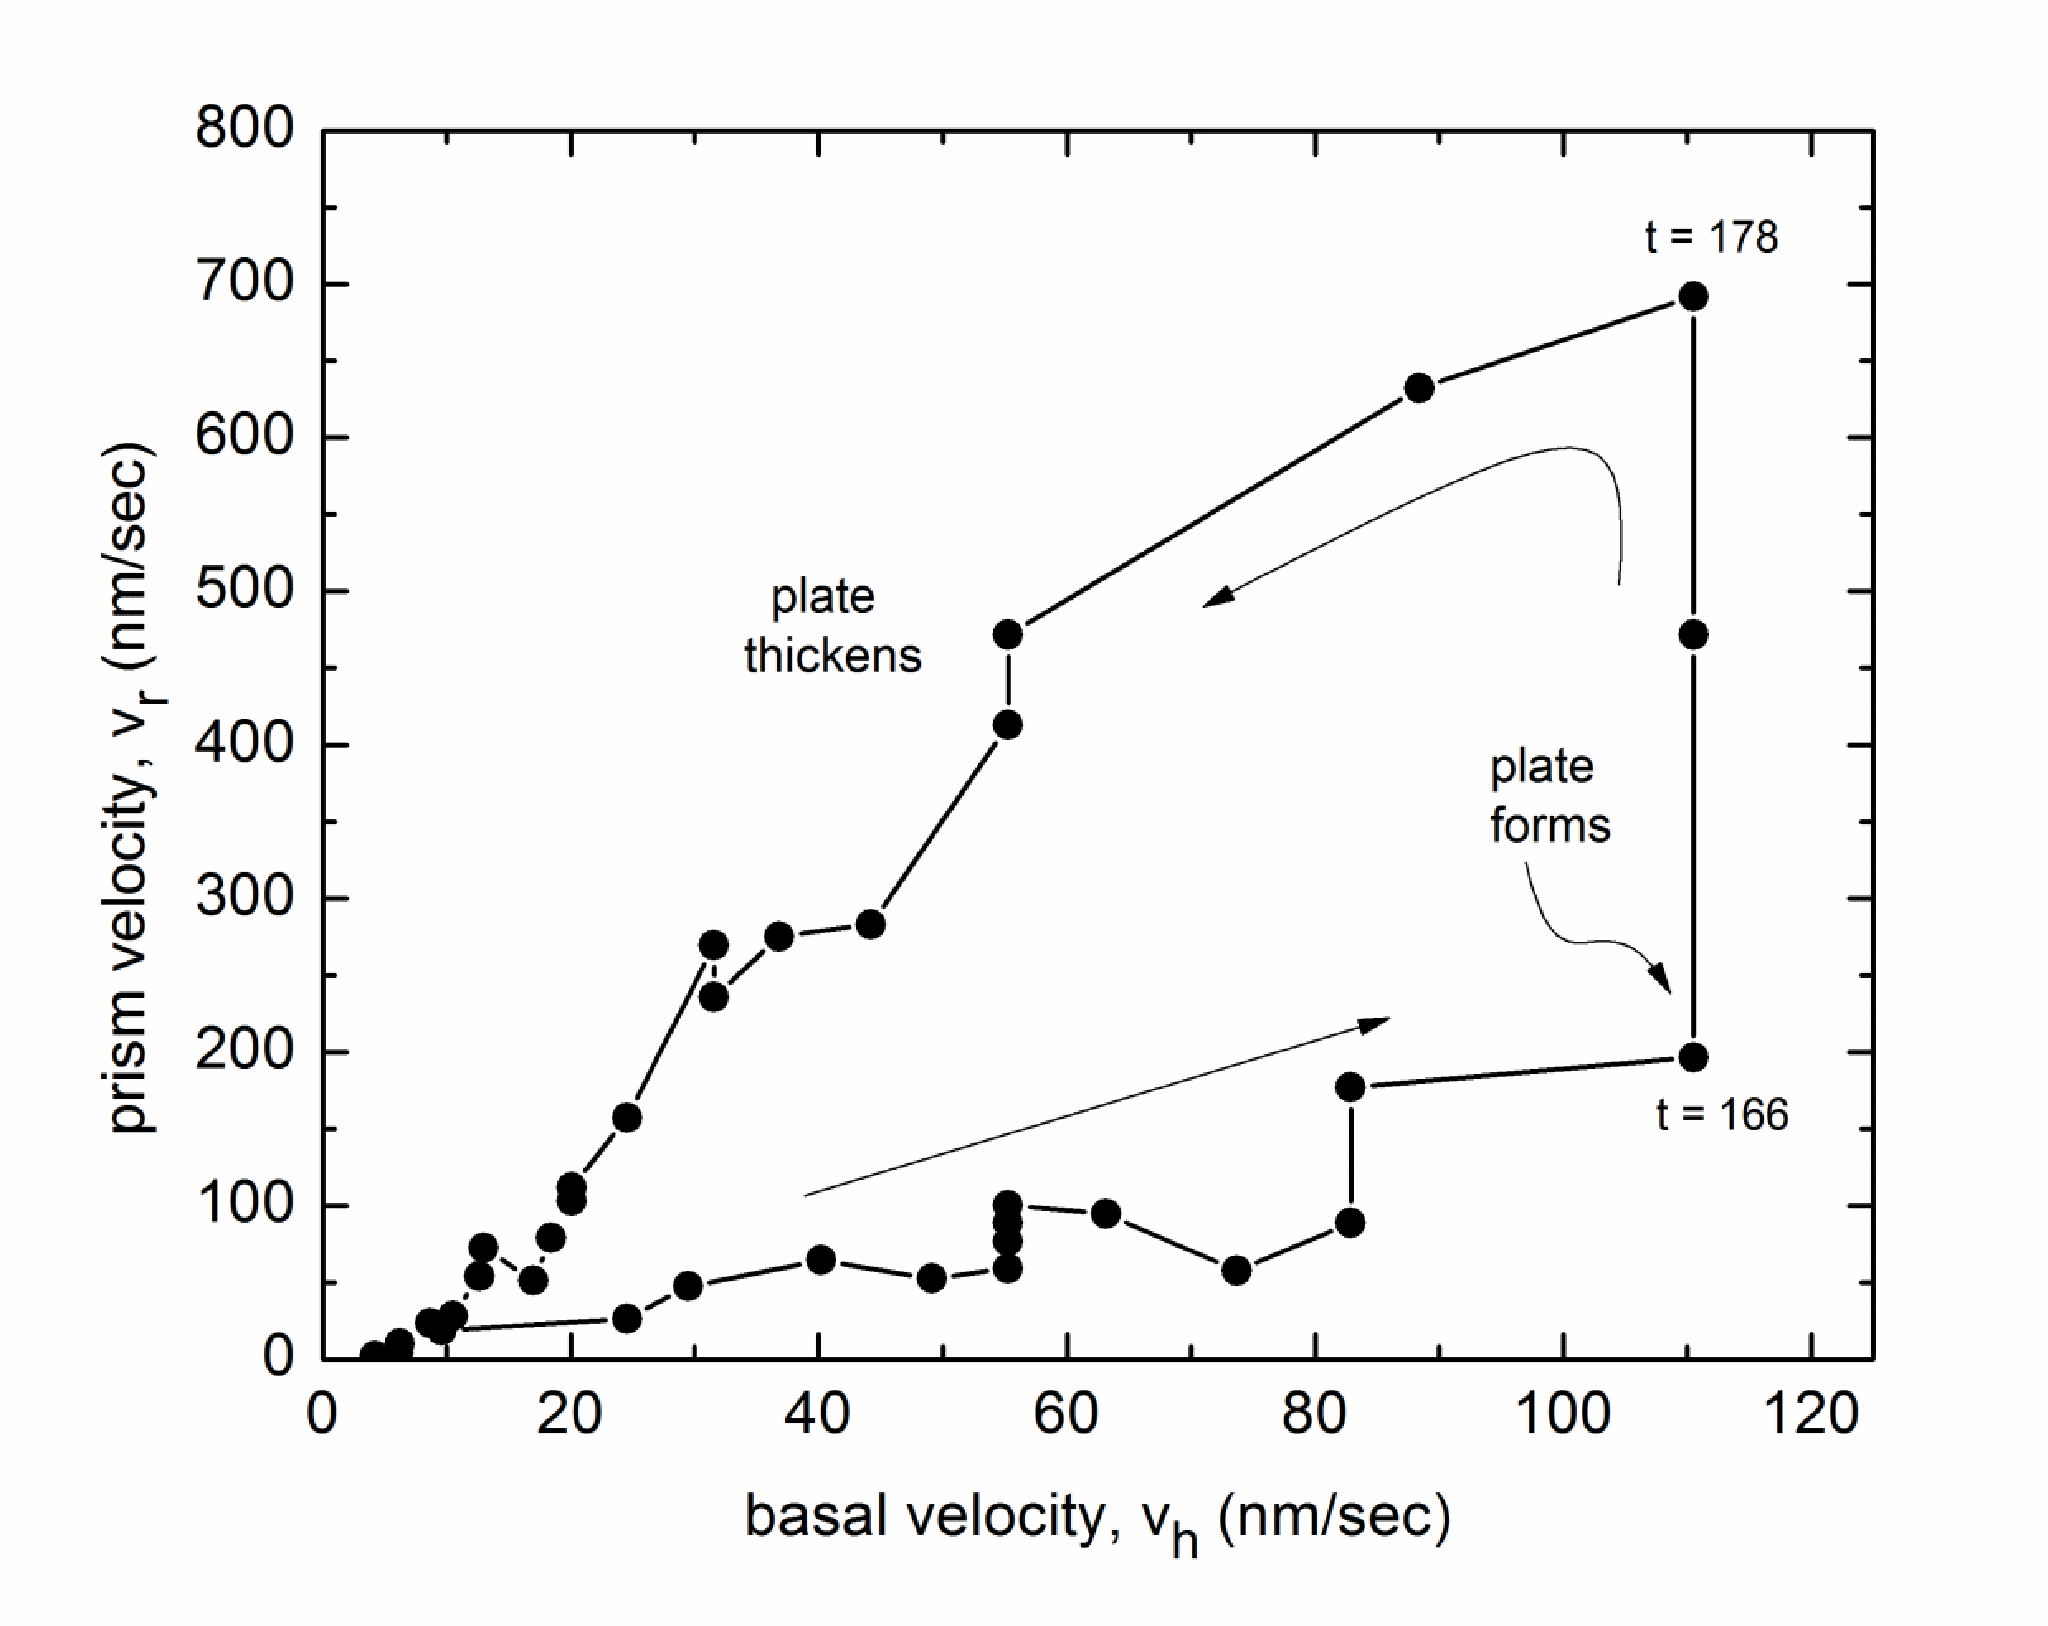
It is instructive to examine a - plot of the crystal growth shown in Figure 4, as this exhibits a characteristic hysteresis behavior. In the early stages of the experiment, both and increased slowly as was increased, in this case with Since the prism facets were in contact with the substrate during this phase of the growth, was likely influenced by substrate interactions that increased nucleation on the prism facets and thus increased compared to that for a free-standing prism facet surface. Had substrate interactions been absent, we would expect because By the thin plate had begun to grow out from the top edge of the ice prism, which changed the structure of the prism surface from a broad facet surface to a sharp edge. According to our interpretation of the subsequent growth behavior, the sharp edge of the prism surface resulted in a higher (and thus a higher because of the SDAK effect. This brought into play a growth instability that sharpened the edge of the plate further, leading to a rapid increase in while (and thus the supersaturation near the crystal surface) remained essentially constant. Around the supersaturation was reduced as shown in Figure 2, which caused to drop. Because the edge of the plate was still sharp, however, (and thus ) remained high. As was reduced further, eventually the edge of the plate thickened and dropped back down as it approached the intrinsic value for a flat facet.
The supersaturation field around the growing crystal was determined by diffusion, and we had no direct measure of However we can use the flat basal facet as a “witness surface” to estimate as follows. Since we know from other measurements of the growth of large basal facets, we can determine from this and the measured basal velocity using Equation 1. The result is plotted in the bottom panel of Figure 2. We then further assume that and use and Equation 1 to estimate with the result shown in Figure 5. Although somewhat crude, this quantitative estimate clearly confirms our hypothesis that the rapid increase in when the thin plate formed is indicative of a rapid increase in Modeling the attachment coefficient as this indicates that on the edge of the thin plate, as expected from the SDAK mechanism.


A key point in this analysis is an examination of what happened to this test crystal around What caused to suddenly increase while remained essentially constant, as seen in Figure 4? Essentially the only change that occurred was that a plate-like appendage began growing on the top edge of the prism facet, as seen in Figure 3. This alone would not substantially alter the diffusion field around this small crystal, as is evidenced by the fact that remains roughly unchanged. Since the diffusion field did not change abruptly near , the rapid increase in means that increased threefold while remained essentially constant. Our conclusion, therefore, is that depends on the structure of the prism facet, which confirms our original hypothesis of structure-dependent attachment kinetics.
Figures 6 and 7 show another example where was increased more gradually as the plate developed. In this case the plate initially formed at a lower compared to the previous example, and the maximum was lower. Again the - plot shows significant hysteresis, indicative of the SDAK mechanism. Here we see that increased by a factor of four as the thin plate developed, while during this same time (and thus declined slightly. Modeling as before yields a broad dip with a minimum value of at seconds.
We observed similar plate-on-pedestal growth behaviors at other temperatures ranging from -12 C to -17 C. The hysteresis in the - plots was most pronounced at -15 C, and we observed that the minimum needed to produce a transition to plate-like growth was approximately two times higher at -17 C than at the other temperatures. Overall these observations are consistent with what we know from the morphology diagram, namely that the growth of thin, plate-like crystals is most pronounced near -15 C, as shown in Figure 1.

3 Modeling
It is also instructive to examine computer models of growing crystals as and other parameters are varied, in order to compare with our observations. To this end we used a cylindrically symmetric cellular automata model [13] for which the functions and were inputs in the code. For these computations we used with percent and with a constant for each model. These models cannot reproduce the full SDAK growth instability, or the observed hysteresis, because was assumed to have a constant value independent of the structure of the crystal. Therefore we used the models mainly to examine the transition to plate-like growth as a function of and
Figure 8 shows one example of a set of models as was varied. The figure shows that the models produced thin plate-like crystals growing from the initial pedestal only when was quite low, confirming the low values we inferred from our measurements. From this and additional model calculations we reached two conclusions: 1) both the observed plate-on-pedestal morphology and the measured values were approximately reproduced with values that were consistent with those inferred from our experimental data, and 2) the initial growth phase with no thin plate was reproduced only with larger values, again roughly consistent with our measured values. Although these constant- models cannot reproduce the full behavior of our observed crystals, they nevertheless support our overall conclusions regarding the SDAK mechanism and the resulting edge-enhancing growth instability.
To produce a full model of the SDAK instability, it would be necessary for to vary with the structure of the crystal, as this is an inherent feature of structure-dependent attachment kinetics. One possibility would be to let where is the radius of curvature of the edge of the crystal plate. The model would assume , where is the measured value for flat prism facets. At smaller would become smaller, as seen in Figure 5. Realizing such a dynamical model would require some guesses for the correct functional form for , as this function is not determined from our measurements or from theoretical considerations. Without more constraints on this and other model inputs, we believe a full dynamical model would be of limited use at this time, other than as a proof-of-principle that the SDAK instability can exhibit a hysteresis behavior that approximates what we observed. However, additional experiments like those described here may yield a useful measurement of , so additional progress in quantitative dynamical modeling is certainly possible.
4 Discussion
To summarize, the data and modeling presented above provide strong evidence for structure-dependent attachment kinetics and an edge-enhancing growth instability at -15 C. Our ice crystal growth measurements and modeling indicate that:
1) For the growth of flat facet surfaces near -15 C, the condensation coefficients for both the basal and prism facets are well described by the functional form where is the supersaturation at the surface and is a constant.
2) For flat facet surfaces we have measured percent and percent at -15 C. Because , this suggests that the intrinsic growth morphology at -15 C is a columnar prism.
3) The measurements suggest that the values of and are independent of background air pressure, at least for the range 0.01 – 1 bar. We also expect there would be no intrinsic pressure dependence in the attachment kinetics from theoretical considerations, since these pressures are too low to substantially affect the ice surface.
4) While chemical contamination of the ice surface is always present at some level in experiments, we have found that contamination levels must be quite high to affect ice growth [14]. Furthermore, chemical contamination typically suppresses the growth of thin plates at -15 C [14], suggesting that contamination is not an important factor in the observations described here.
5) Our observations of plate-on-pedestal growth show a rather abrupt transition to plate-like growth. Using the basal facet as a “witness surface” allowed us to estimate as described above. During plate growth we found
6) Computer modeling confirms that is necessary for plate-like growth.
7) Hysteresis in the - plots requires that is not a simple single-valued function independent of crystal morphology. Instead, must be large at the edge of a thin plate and smaller on the edges of thick plates or on flat facet surfaces.
Together these considerations strongly support the SDAK mechanism we proposed earlier, and indicate the presence of an edge-enhancing growth instability. Beginning with a crystal prism containing only large facets, we initially have and At low pressures the prism and basal facets remain large and the SDAK mechanism is absent, giving the roughly isometric growth that has been observed. But at higher pressures, diffusion causes the top edge of the crystal to grow a bit faster than other parts of the crystal, so the edge sharpens slightly. This sharper edge leads to a reduced which causes the edge growth to increase further. A positive feedback results: as reduces, the edge grows faster and becomes sharper, thus reducing more, and so on. This positive feedback is the hallmark of a growth instability, and the end result is the formation of a thin plate.
An edge-enhancing instability driven by the SDAK mechanism is a relatively simple physical explanation that nicely explains all the observations. The existence of a growth instability of this nature may also explain why ice crystal morphologies change so abruptly with temperature in the morphology diagram. If the instability tips only slightly in the direction of fast prism growth, then thin plates will form. But if the same instability tips toward fast basal growth, then hollow columns (which, like plates, also have thin edges) become the preferred morphology. Even small changes in the underlying nature of the instability can result in large changes in the final crystal morphologies.
We do not yet understand the molecular mechanisms that produce the SDAK effect, although structure-dependent surface premelting may be playing a role. We also do not yet understand the temperature dependence of this instability, and why it is especially prevalent at -15 C. Nevertheless, it appears that this instability is responsible for the formation of thin plates at -15 C, which is a dominant feature in the morphology diagram. Additional observations may yield more insights into the underlying molecular processes responsible for shaping the growth of snow crystals under different conditions.
References
- [1] Libbrecht, K. G., “The physics of snow crystals,” Rep. Prog. Phys., 68, 855-895 (2005).
- [2] Nakaya, U., “Snow Crystals: Natural and Artificial,” (Cambridge: Harvard University Press) (1954).
- [3] Nelson, J., “Growth mechanisms to explain the primary and secondary habits of snow crystals,” Philos. Mag. A 81, 2337-73 (2001).
- [4] Pruppacher, H. R. and Klett, J. D., “Microphysics of clouds and precipitation,” (Dordrecht; Kluwer Academic Publishers), end of chapter 13 (1997).
- [5] Sei, T., and Gonda, T., “The growth mechanism and the habit change of ice crystals growing from the vapor phase,” J. Cryst. Growth 94, 697-707 (1989).
- [6] Beckman, W., Lacmann, R., and Blerfreund, A., “Growth rates and habits of ice crystals grown from the vapor phase,” J. Phys. Chem. 87, 4142-4146 (1983).
- [7] Lamb, D. and Scott, W. D., “Linear growth rates of ice crystals grown from the vapor phase,” J. Cryst. Growth 12, 21-31 (1972).
- [8] Libbrecht, K. G., “Explaining the formation of thin ice crystal plates with structure-dependent attachment kinetics,” J. Cryst. Growth 258, 168-175 (2003).
- [9] Libbrecht, K. G., and Rickerby, M. E., “Measurements of growth rates of (0001) ice crystal surfaces,” arXiv: 1110.5828v1 (2011).
- [10] Libbrecht, K. G., unpublished (2011).
- [11] Swanson, B. D., Bacon, M. J., Davis, E. J., et al., “Electrodynamic trapping and manipulation of ice crystals,” Quart. J. Roy. Meteor. Soc. 125, 1039-1058 (1999).
- [12] Libbrecht, K. G., “An improved apparatus for measuring the growth of ice crystals from water vapor,” arXiv: 1109.1511 (2011).
- [13] Libbrecht, K. G., “Physically derived rules for simulating faceted crystal growth using cellular automata,” arXiv:0807.2616v1 (2008).
- [14] Libbrecht, K. G., and Bell, R., “Chemical influences on ice crystal growth from vapor,” arXiv:1101.0127v1 (2010).