Systematic investigation of the rotational bands in nuclei with using a particle-number conserving method based on a cranked shell model
Abstract
The rotational bands in nuclei with are investigated systematically by using a cranked shell model (CSM) with the pairing correlations treated by a particle-number conserving (PNC) method, in which the blocking effects are taken into account exactly. By fitting the experimental single-particle spectra in these nuclei, a new set of Nilsson parameters ( and ) and deformation parameters ( and ) are proposed. The experimental kinematic moments of inertia for the rotational bands in even-even, odd- and odd-odd nuclei, and the bandhead energies of the 1-quasiparticle bands in odd- nuclei, are reproduced quite well by the PNC-CSM calculations. By analyzing the -dependence of the occupation probability of each cranked Nilsson orbital near the Fermi surface and the contributions of valence orbitals in each major shell to the angular momentum alignment, the upbending mechanism in this region is understood clearly.
pacs
21.60.-n; 21.60.Cs; 23.20.Lv; 27.90.+bI Introduction
Since the importance of shell effects on the stability of superheavy nuclei (SHN) was illustrated [1] and the existence of an island of stability of SHN was predicted around and [2, 3, 4, *Nilsson1969_PLB28-458, *Nilsson1969_NPA131-1, 7, *Grumann1969_ZPA228-371], a lot of efforts have focused on the exploration of SHN. Great experimental progresses have been made in synthesizing the superheavy elements (SHE). Up to now, SHE’s with have been synthesized via cold and hot fusion reactions [9, 10, 11, *Oganessian2010_PRL104-142502]. However, these SHN are all neutron deficient with neutron numbers less by at least 7 than the predicted next neutron magic number 184. Therefore, one still can not make a definite conclusion about the location of the island of stability.
The single particle shell structure is crucial for the location of the island of stability. For example, whether the next shell closure of protons appears at or 120 is mainly determined by the splitting of the spin doublets . Experimentally one can not investigate directly the single particle level structure of SHN with because the production cross sections of these nuclei are tiny which makes the spectroscopy experiment impossible at present. Theoretically different models usually predict different closed shells beyond 208Pb; even within the same model there are parameter-dependent predictions [13]. For examples, the macroscopic-microscopic models or the extended Thomas-Fermi-Strutinsky integral approach predict that the next shell closure for the proton is at [14, 15, 16]; the relativistic mean field models predict or 120 to be the next proton magic number [17, *Bender1999_PRC60-034304, *Kruppa2000_PRC61-034313, 20, 21, 22]; predictions from non-relativistic mean field models with Skyrme forces are , 120, 124, or 126, depending on the parametrization [17, *Bender1999_PRC60-034304, *Kruppa2000_PRC61-034313]. The shell structure of SHN is important not only for the location of the island of stability, but also for the study of the synthesis mechanism of SHN [23, *Adamian2004_PRC69-011601, *Zubov2009_PPN40-847, 26, 27, 28, 29, 30, 31, *Liu2009_PRC80-034601, *Liu2009_SciChinaG52-1482, 34, *Zagrebaev2005_JPG31-825, *Zagrebaev2008_PRC78-034610, 37, *Du2009_SciChinaG52-1489, 39, *Shen2002_PRC66-061602R, *Shen2009_SciChinaG52-1458], particularly for the survival probability of the excited compound nuclei [42, *Adamian2009_PRC79-054608, 44].
To learn more about the shell structure of SHN, an indirect way is to study lighter nuclei in the deformed region with and . The strongly downsloping orbitals originating from the spherical subshells and active in the vicinity of the predicted shell closures may come close to the Fermi surface in these deformed nuclei. The rotational properties of nuclei in this mass region are affected strongly by these spherical orbitals. For examples, the and orbitals are of particular interest since they stem from the spherical spin doublets orbtials.
Both the in-beam spectroscopy and spectroscopy following the decay of isomeric states or alpha decays have been used to study nuclei with [45, 46, 47, *Herzberg2008_PPNP61-674, 49]. These nuclei are well deformed; for examples, the quadrupole deformation parameter for 250Fm and 252,254No [50, 51, 52]. Many high-spin rotational bands in even-even nuclei (e.g., 248,250,252Cf [53], 250Fm [51] 252,254No [52, 50]) and odd- nuclei (e.g., 247,249Cm and 249Cf [54], 253No [55, 56], 251Md [57], 255Lr [58]) have been established in recent years. The study of these nuclei is certainly also very interesting in itself. The rotational spectra in these nuclei can reveal detailed information on the single-particle configurations, the shell structure, the stability against rotation, the high- isomerism, etc..
Theoretically, the deformations, the shell structure, the rotational properties, and high- isomeric states have been studied by using the self-consistent mean field models [59, 60, 61, 62, *Adamian2011_PRC84-024324], the macroscopic-microscopic models [64, 65, 66, 67, 68, 69, *Adamian2010_PRC82-054304, 62, *Adamian2011_PRC84-024324], the projected shell model [71, 72, 73], the cranked shell models [74, 75, 76], the quasiparticle (qp) phonon model [77], the particle-triaxial-rotor model [78], the heavy shell model [79], etc.. Continuing the recently published Rapid Communication [76], in this work, we present results of a systematic study of the single particle structure and rotational properties of nuclei with . The cranked shell model (CSM) with pairing correlations treated by a particle-number conserving (PNC) method [80, 81] is used. In contrary to the conventional Bardeen-Cooper-Schrieffer (BCS) or Hartree-Fock-Bogolyubov (HFB) approach, in the PNC method, the Hamiltonian is solved directly in a truncated Fock-space [82]. So the particle-number is conserved and the Pauli blocking effects are taken into account exactly. Noted that the PNC scheme has been implemented both in relativistic and nonrelativistic mean field models [83, 84] in which the single-particle states are calculated from self-consistent mean field potentials instead of the Nilsson potential.
The paper is organized as follows. A brief introduction of the PNC treatment of pairing correlations within the CSM and applications of the PNC-CSM are presented in Sec. II. The numerical details, including a new set of Nilsson parameters (), the deformation parameters and pairing parameters are given in Sec. III. The PNC-CSM calculation results for even-even, odd- and odd-odd nuclei are presented in Sec. IV. A brief summary is given in Sec. V.
II Theoretical framework
The cranked Nilsson Hamiltonian of an axially symmetric nucleus in the rotating frame reads [81, 85],
| (1) |
where is the Nilsson Hamiltonian [6], is the Coriolis interaction with the cranking frequency about the axis (perpendicular to the nuclear symmetry axis). is the pairing interaction:
| (2) | |||||
| (3) |
where () labels the time-reversed state of a Nilsson state (), is the diagonal element of the stretched quadrupole operator, and and are the effective strengths of monopole and quadrupole pairing interactions, respectively.
Instead of the usual single-particle level truncation in common shell-model calculations, a cranked many-particle configuration (CMPC) truncation (Fock space truncation) is adopted which is crucial to make the PNC calculations for low-lying excited states both workable and sufficiently accurate [82, 86]. An eigenstate of can be written as
| (4) |
where is a CMPC (an eigenstate of the one-body operator ). By diagonalizing in a sufficiently large CMPC space, sufficiently accurate solutions for low-lying excited eigenstates of are obtained.
The angular momentum alignment of can be separated into the diagonal and the off-diagonal parts,
| (5) |
and the kinematic moment of inertia (MOI) of is
| (6) |
Considering to be a one-body operator, the matrix element for is nonzero only when and differ by one particle occupation [81, 87]. After a certain permutation of creation operators, and can be recast into
| (7) |
where the ellipsis stands for the same particle occupation, and , according to whether the permutation is even or odd. Therefore, the kinematic MOI of can be written as
| (8) |
where
and
| (9) |
is the occupation probability of the cranked orbital , if is occupied in , and otherwise.
We note that because , , the signature scheme breaks the quantum number . However, it has been pointed out that [81, 88], although , . Thus we can construct simultaneous eigenstates of (). Each CMPC in Eq. (4) is chosen as a simultaneous eigenstate of (). It should be noted that, though the projection of the total angular momentum of a deformed spheroidal nucleus is a constant of motion, can not keep constant when the rotational frequency is non-zero due to the Coriolis interaction. However, in the low- region, may be served as an useful quantum number characterizing a low-lying excited rotational band.
The PNC-CSM treatment has been used to describe successfully the high-spin states of the normally deformed nuclei in the rare-earth and the actinide region, and the superdeformed nuclei in region. The multi-qp high- isomer states are investigated in detail in the well-deformed Lu (=71), Hf (=72) and Ta (=73) isotopes [89, 90]. The backbendings in Yb (=70) and Tm (=68) isotopes are understood clearly, especially the occurrence of sharp backbending in some nuclei [91, 92]. The upbending mechanisms in the actinide nuclei 251Md and 253No are also analyzed [75]. In the superdeformed nuclei around region, the effects of the quadrupole pairing on the downturn of dynamic MOI’s are analyzed [85], the evolution of the dynamic MOI’s and the alignment additivity, which come from the contributions of the interference terms, have been investigated [93].
Some general features in nuclear structure physics have also been explained well in the PNC-CSM scheme, e.g., the large fluctuations of odd-even differences in MOI’s [87], the nonadditivity in MOI’s [94], the microscopic mechanism of identical bands in normally deformed nuclei and super-deformed nuclei [95, 96], the non-existence of the pairing phase transition [97], etc..
III Numerical details
III.1 A new set of Nilsson parameters
| 4 | 0,2,4 | 0.0670 | 0.654 | ||||
|---|---|---|---|---|---|---|---|
| 5 | 1 | 0.0250 | 0.710 | 6 | 0 | 0.1600 | 0.320 |
| 3 | 0.0570 | 0.800 | 2 | 0.0640 | 0.200 | ||
| 5 | 0.0570 | 0.710 | 4,6 | 0.0680 | 0.260 | ||
| 6 | 0,2,4,6 | 0.0570 | 0.654 | 7 | 1,3,5,7 | 0.0634 | 0.318 |
The conventional Nilsson parameters () proposed in Refs. [6, 98] are optimized to reproduce the experimental level schemes for the rare-earth and actinide nuclei. However, these two sets of parameters can not describe well the experimental level schemes of nuclei studied in this work. By fitting the experimental single-particle levels in the odd- nuclei with , we obtained a new set of Nilsson parameters (, ) which are dependent on the main oscillator quantum number as well as the orbital angular momentum [76]. Here for the completeness, we include them again in Table 1. Note that the readjustment of Nilsson parameters is also necessary in some other mass regions of the nuclear chart [99, 100, 101] and the -dependence was already included in Refs. [99, 100].
III.2 Deformation parameters

| 240Cm | 242Cm | 244Cm | 246Cm | 248Cm | 250Cm | |
| 0.225 | 0.230 | 0.235 | 0.240 | 0.245 | 0.240 | |
| 0.015 | 0.010 | 0.005 | 0.000 | 0.005 | 0.01 | |
| 242Cf | 244Cf | 246Cf | 248Cf | 250Cf | 252Cf | |
| 0.230 | 0.235 | 0.240 | 0.245 | 0.250 | 0.245 | |
| 0.01 | 0.005 | 0.000 | 0.005 | 0.010 | 0.015 | |
| 244Fm | 246Fm | 248Fm | 250Fm | 252Fm | 254Fm | |
| 0.235 | 0.240 | 0.245 | 0.250 | 0.255 | 0.250 | |
| 0.005 | 0.000 | 0.005 | 0.010 | 0.015 | 0.02 | |
| 246No | 248No | 250No | 252No | 254No | 256No | |
| 0.240 | 0.245 | 0.250 | 0.255 | 0.260 | 0.255 | |
| 0 | 0.005 | 0.010 | 0.015 | 0.020 | 0.025 |
There are not enough experimental values of the deformation parameters for the very heavy nuclei with 100. According to the data, the quadrupole deformation parameter for 250Fm [51], 252,254No [52]. The values used in various calculations or predicted by different models are quite different. Figure. 1 shows the experimental quadrupole deformation (pink stars in Fig. 1) and those predicted in the macroscopic-microscopic (MM) model [64, 66] (blue triangles in Fig. 1) and the finite range droplet model (FRDM) [15] (red solid circles in Fig. 1). The deformation parameters given in these two MM models [64, 66] are very close to each other, hence we only show the results given in Ref. [66]. From Fig. 1 we can see that the deformation parameters from MM and FRDM do not agree with the experimental values, especially those from the FRDM. One can find a general trend in Fig. 1, i.e., both the experimental values and the predicted values indicate that the deformations reach maximum at 254No ( and ) partly according to which we fix the deformation parameters used in the present study.
The deformations are input parameters in the PNC-CSM calculations (black squares in Fig. 1). They are chosen to be close to existed experimental values and change smoothly according to the proton and the neutron number. The deformation parameters and used in our PNC-CSM calculations for even-even nuclei with are listed in Table 2. The deformations of odd- and odd-odd nuclei are taken as the average of the neighboring even-even nuclei. These parameters we choose may have some discrepancy from the empirical values which may lead to some deviations in the single-particle levels, if the single particle levels are very close to each other. For example, the level sequence of the 1-qp bands will change in an isotonic or an isotropic chain (e.g., see Figs. 6 and 11) due to the deformation staggering in the neighboring nuclei. From Fig. 1 it can be seen that this staggering existed in the FRDM. Some previous calculations have shown that the octupole correlations play important roles in this mass region [102, 72, 103]. In the present work, the octupole deformation is not included yet. We note that the octupole effect may modify the single-particle level scheme. One example will be discussed later for the low excitation energy of the states in the isotones in Sec. IV.2.
III.3 Pairing strengthes and the CMPC space

The effective pairing strengths and can be determined by the odd-even differences in nuclear binding energies. They are connected with the dimension of the truncated CMPC space. The CMPC space for the heavy nuclei studied in this work is constructed in the proton shells and the neutron shells. The dimensions of the CMPC space for the nuclei with are about 1000 both for protons and neutrons. The corresponding effective monopole and quadrupole pairing strengths are shown in Table 3. As we are only interested in the yrast and low-lying excited states, the number of the important CMPC’s involved (weight ) is not very large (usually ) and almost all the CMPC’s with weight are included in.
The stability of the PNC calculation results against the change of the dimension of the CMPC space has been investigated in Refs. [81, 96, 86]. A larger CMPC space with renormalized pairing strengths gives essentially the same results. The calculated MOI’s of the ground state band (GSB) in 248Cm using different dimensions of the CMPC space (1000 and 1500, respectively) are compared in Fig. 2. The red dotted line is the result calculated with the dimensions of CMPC space about 1500 both for protons and neutrons. The effective pairing strengths used in the calculation are = 0.35 MeV, = 0.03 MeV, = 0.27 MeV, and = 0.013 MeV, which are a little smaller than those used when the CMPC dimensions are about 1000, i.e., = 0.40 MeV, = 0.035 MeV, = 0.30 MeV, and = 0.020 MeV (see Table 3). We can see that these two results agree well with each other and they both also agree well with the experiment. So the solutions to the low-lying excited states are quite satisfactory.
| even-even | odd- | odd- | odd-odd | |
|---|---|---|---|---|
| (MeV) | 0.40 | 0.40 | 0.25 | 0.25 |
| (MeV) | 0.035 | 0.035 | 0.010 | 0.010 |
| (MeV) | 0.30 | 0.25 | 0.30 | 0.25 |
| (MeV) | 0.020 | 0.015 | 0.020 | 0.015 |
IV Results and discussions
IV.1 Cranked Nilsson levels

Figure 3 shows the calculated cranked Nilsson levels near the Fermi surface of 250Fm. The positive (negative) parity levels are denoted by blue (red) lines. The signature () levels are denoted by solid (dotted) lines. For protons, the sequence of single-particle levels near the Fermi surface is exactly the same as that determined from the experimental information of 249Es [48]. The sequence of single-neutron levels near the Fermi surface is also very consistent with the one determined from the experimental information of 251Fm [48], with the only exception of the orbital which will be discussed in next subsection.
From Fig. 3 it is seen that there exist a proton gap at and a neutron gap at , which is consistent with the experiment and the calculation by using a Woods-Saxon potential [104, *Chasman1978_RMP50-173]. The position of the proton orbitals and is very important, because they stem from the spherical spin partners orbitals. The magnitude of the spin-orbital splitting of these spin partners determines whether the next proton magic number is or 120. Noted that the cranked relativistic Hartree-Bogoliubov theory has been used to investigate the spin-orbital splitting of this spin partners in Ref. [59]. The calculated proton levels indicate that the gap is large whereas the gap is small.
The neutron orbital is the highest-lying neutron orbital from above the spherical subshell (), based on which a high-spin rotational band has been established in 249Cm [54]. This orbital also brings new information toward studying those states close to the next closed shell for neutrons.
IV.2 1-qp bandhead energies
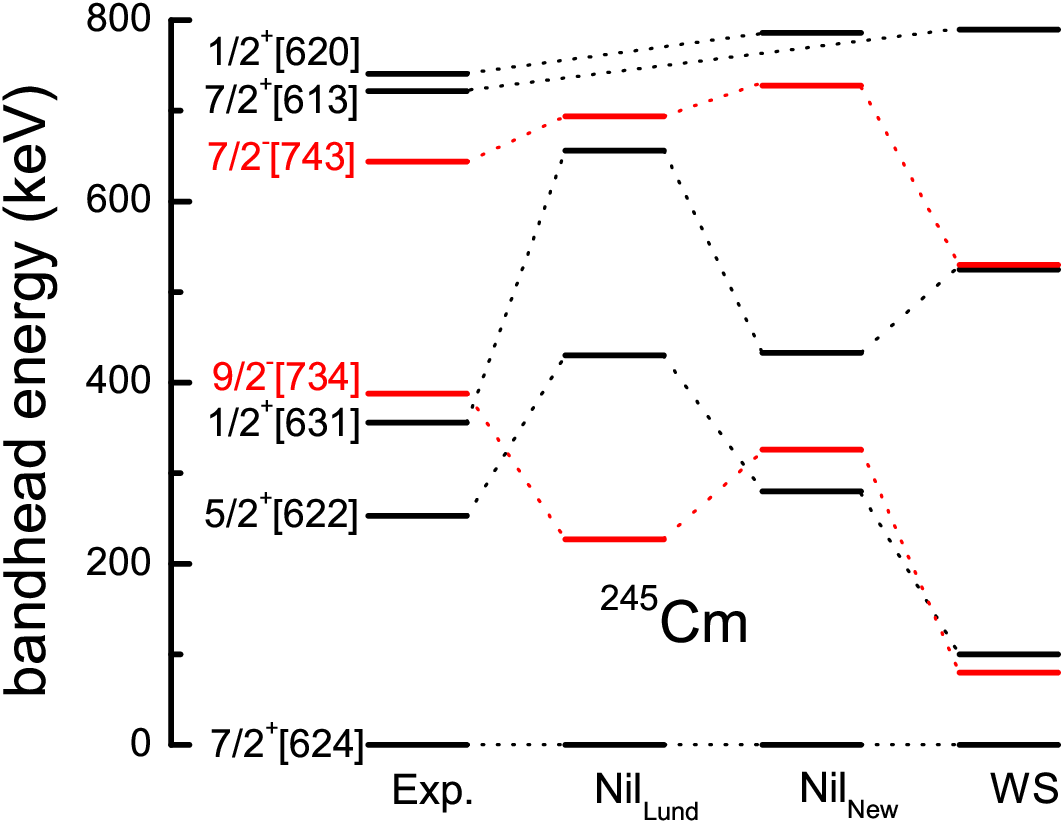
First we choose 245Cm as an example to show the comparison of theoretical 1-qp bandhead energies with the data in Fig. 4. It can be seen that the calculated results obtained by using the conventional Nilsson parameters [6] deviate from the experimental values very much. With the modified parameters given in Table 1, a remarkably good agreement with the data can be achieved. For comparison, the results from the Woods-Saxon (WS) potential [68] is also given (the bandhead energies are taken from Table II of Ref. [68] except that that of is taken from Fig. 1 of the same article). It should be noted that generally speaking, for the 1-qp spectra of nuclei with the Woods-Saxon potential gives a better agreement with the data. For example, the root-mean-square deviation of theoretical 1-qp bandhead energies from the experimental values is about 270 keV for neutrons by using the modified Nilsson parameters, while this deviation is about 200 keV by using the Woods-Saxon potential [68].
Figures 5-12 show experimental and calculated bandhead energies of the low-lying 1-qp bands for even- and odd- isotones with (one-quasineutron states) and odd- and even- isotopes with (one-quasiproton states). In these figures, 1-qp states with energies around or less than 0.8 MeV are shown and the positive and negative parity states are denoted by black and red lines, respectively. Generally speaking, the agreement between the calculation and the experiment is satisfactory. Next we discuss these 1-qp states in details.

The experimental and calculated bandhead energies of low-lying one-quasineutron bands for the isotones are compared in Fig. 5. The data are available only for 241Cm [106] and 243Cf [107] and they are reproduced by the theory quite well. The ground state of each isotone studied in this work is . The energy of steadily becomes smaller with increasing both in the experimental spectra and in the calculated ones. The lowering of with increasing is also seen in the experimental spectra but it is not so striking from the calculation. In each of these isotones a low-lying state is predicted which is not observed. We note that this prediction is consistent with Ref. [68].

Low-lying one-quasineutron levels for isotones 243Cm [108], 245Cf [107], and 247Fm [109] were identified experimentally. Their ground states are , , and respectively. However, the ground state for all these isotones is from the PNC-CSM as seen in Fig. 6. The same is obtained recently by using a two-center shell model [63]. In our calculations, the energies of these three levels are very close to each other, a small change in the deformation parameters would modify the order of these levels. This might be one of the reasons for the disagreement in the ground state configuration between the theory and the experiment. Similar situation happens in the Bk and Es isotopes, in which the energies of and are very close to each other and these two one-quasiproton levels cross each other at .

Low-lying one-quasineutron levels for isotones 245Cm [110], 247Cf [111], 249Fm [112] and 251No [109] were identified experimentally. All their ground states are . The comparison with the experiment is shown in Fig. 7. Nearly all of these 1-quasineutron bandhead energies are well reproduced by the PNC-CSM calculations. The energy of is much lower in 251No than that in 245Cm, but in our calculations this level seems almost unchange with the proton number increasing. The calculated results are very similar with that in Ref. [113]. For each observed level, the energy reaches maximum in 247Cf, which can not be reproduced by our calculations.

Many theoretical models predict that the first excited state in isotones should be (see, e.g., Ref. [68]). This is not consistent with experimental results, i.e., the first excited state in isotones is . The low excitation energy of the states in the isotones have been interpreted as a consequence of the presence of a low-lying octupole phonon state [117]. Noted that in Ref. [59], by using the cranked relativistic Hartree-Bogoliubov theory, the level sequence in isotones is consistent with the experiment, but it can not reproduce the level sequence in isotones. It can be seen in Fig. 8 that, the level sequence in most nuclei is consistent with the experimental data, with the obviously exception of the orbital. The level observed in 253No at 355 keV is from Ref. [55]. A recent experiment [56] observed a very similar level scheme which was, however, assigned as the configuration. This will be discussed in Sec. IV.

The experimental and calculated bandhead energies of low-lying one-quasineutron bands for the isotones are compared in Fig. 9. The one-quasineutron levels for 249Cm [118], 251Cf [119], 253Fm [120] and 255No [121] were identified experimentally. The ground states for all these isotones are in our calculations, which is consistent with the data. But the level order of and from our calculation is inversed according to the data. This also happens in the Ref. [68]. Another problem is that states in all the isotones from our calculation are systematically higher than the experiment values. In each of these isotones a low-lying state is predicted which is not observed.

Low-lying one-quasiproton levels for Bk () isotopes 243,245Bk [122], 247Bk [123], 249Bk [124] and 251Bk [125] were identified experimentally. The comparison between the data and our calculation is shown in Fig. 10. The two levels and are very close to each other, usually the energy difference is less than 50 keV. The ground states are for all Bk isotopes except 249Bk. In our calculations the ground states are all . The deviation in 249Bk may be due to the staggering of the deformation. Nearly all the calculated 1-quasiproton energies in the Bk isotopes are a little larger than the experimental values.

Low-lying one-quasineutron levels for Es () isotopes 245,247,249,251,253Es [126, 127] were identified experimentally. The comparison between the data and our calculation is shown in Fig. 11. The ground states are for all Es isotopes except 251Es. In our calculations the ground states are all . The deviation in 251Es may be also due to the staggering of the deformation. Our calculations show that the bandhead energies of the negative parity states are all very small (less than 400 keV), which is consistent with the experiment.

With the proton number increasing, the data become less and less. Fig. 12 shows the comparison between the experimental values and our calculation for the Md and Lr isotopes. The data are available only for 251Md [129], 255Md [128] and 251Lr [129] and they are reproduced by the theory quite well.
From the above discussions, we see that the new Nilsson parameters can describe satisfactorily the 1-qp spectra of nuclei with . But there are still some discrepancies. According to our experience, it is quite difficult to improve this situation in the framework of the Nilsson model. One way out might be to use the Woods-Saxon potential instead of the Nilsson potential.
IV.3 Even-even nuclei

The experimental kinematic MOI’s for each band are extracted by
| (10) |
separately for each signature sequence within a rotational band. The relation between the rotational frequency and the angular momentum is
| (11) |
where , is the projection of nuclear total angular momentum along the symmetry axis of an axially symmetric nuclei.
Figure 13 shows the experimental and calculated MOI’s of the GSB’s in even-even Cm, Cf, Fm, and No isotopes. The experimental (calculated) MOI’s are denoted by solid circles (solid lines). The experimental MOI’s of all these GSB’s are well reproduced by the PNC-CSM calculations. For some nuclei, there is no data (i.e., 252Cm), we only show the PNC-CSM results. It can be seen from Fig. 13 that with increasing proton number in any isotonic chain, the upbendings in each nuclei become less pronounced. It is well known that the backbending is caused by the crossing of the GSB with a pair-broken band based on high- intruder orbitals [130], in this mass region the and orbitals. But in several nuclei, there is no evidence for a alignment. It has been pointed out in Ref. [76] that, for the nuclei with , among the neutron orbitals of parentage, only the high- (deformation aligned) and are close to the Fermi surface. The diagonal parts in Eq. (5) of these two orbitals contribute no alignment to the upbending, only the off-diagonal parts in Eq. (5) contribute a little if the neutron orbital is not blocked.
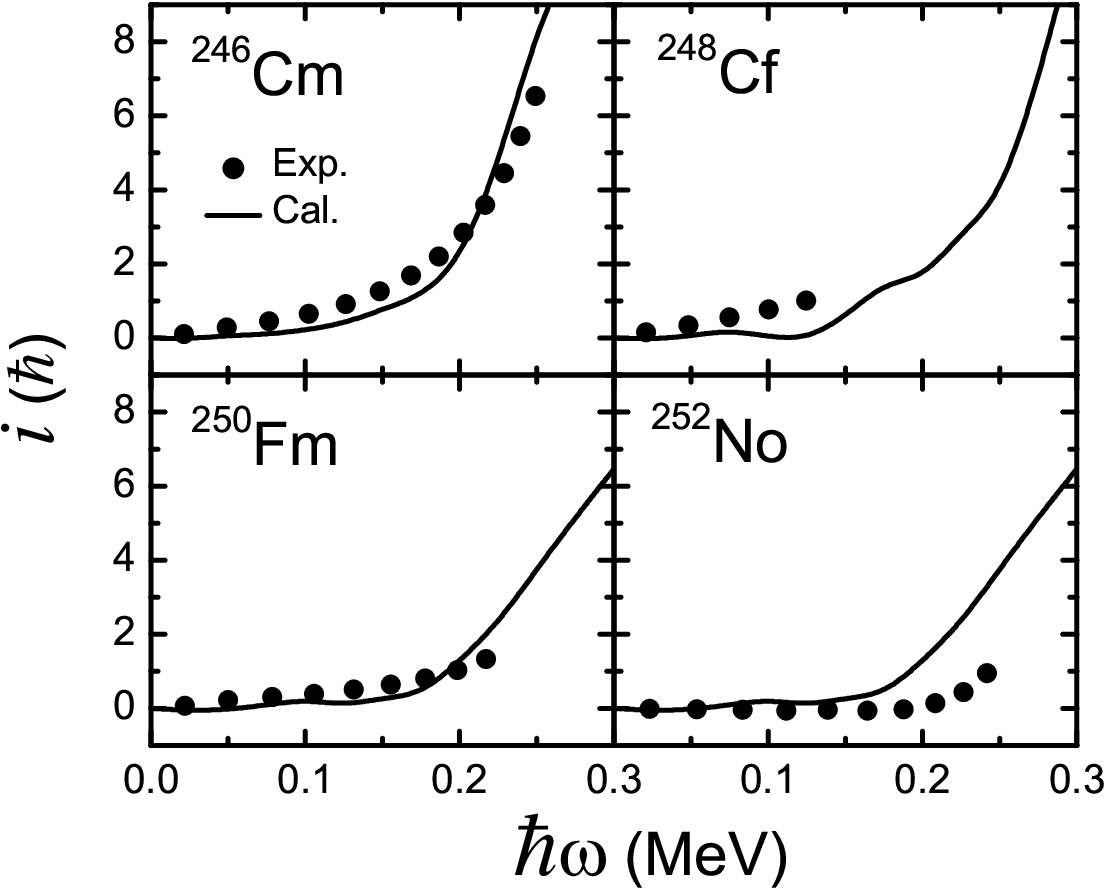
To see the upbending in these even-even nuclei more clearly, we show the experimental (solid circles) and calculated (solid lines) alignment for the GSB’s in isotones in Fig. 14. For other isotones the results are very similar, so we do not shown them here. It can be seen that the upbending frequencies of these GSB’s are about MeV.

One of the advantages of the PNC method is that the total particle number is exactly conserved, whereas the occupation probability for each orbital varies with rotational frequency . By examining the -dependence of the orbitals close to the Fermi surface, one can learn more about how the Nilsson levels evolve with rotation and get some insights on the upbending mechanism. Fig. 15 shows the occupation probability of each orbital near the Fermi surface for the GSB’s in the isotones. The top and bottom rows are for the protons and neutrons, respectively. The positive (negative) parity levels are denoted by blue solid (red dotted) lines. The orbitals in which do not change much (i.e., contribute little to the upbending) are denoted by black lines. The Nilsson levels far above the Fermi surface () and far below () are not shown. We can see from Fig. 15 that the occupation probability of () drops down gradually from 0.5 to nearly zero with the cranking frequency increasing from about MeV to MeV, while the occupation probabilities of some other orbitals slightly increase. This can be understood from the cranked Nilsson levels shown in Fig. 3. The is slightly above the Fermi surface at . Due to the pairing correlations, this orbital is partly occupied. With increasing , this orbital leaves farther above the Fermi surface. So after the band-crossing frequency, the occupation probability of this orbital becomes smaller with increasing . Meanwhile, the occupation probabilities of those orbitals which approach near to the Fermi surface become larger with increasing . This phenomenon is even more clear in 248Cf, but the band-crossing occurs at MeV, a little larger than that of 246Cm. So the band-crossings in both cases are mainly caused by the orbitals. For 250Fm and 252No, the occupation probabilities of orbitals increase slowly with the cranking frequency increasing from about MeV to MeV. So there is no sharp bandcrossing from the proton orbitals. Now we focus on the occupation probability of the neutron orbitals (bottom row). The four figures in the bottom row of Fig. 15 show a very similar pattern. It can be seen that, with increasing, the of orbitals increase slowly and that of the high- (deformation aligned) orbitals () decrease slowly. Thus only a small contribution is expected from neutrons to the upbendings for the GSB’s in the isotopes. The bandcrossing frequencies for neutrons are about MeV, very close to the proton bandcrossing frequencies. So neutrons and protons from the high- orbits compete strongly in rotation-alignment as pointed out in Ref. [73].

The contribution of each proton (top row) and neutron (bottom row) major shell to the angular momentum alignment for the GSB’s in the isotones is shown in Fig. 16. The diagonal and off-diagonal parts in Eq. (5) from the proton and the neutron shells are shown by dashed lines. Note that in this figure, the smoothly increasing part of the alignment represented by the Harris formula () is not subtracted (cf. the caption of Fig. 14). It can be seen clearly that the upbendings for the GSB’s in 246Cm at 0.20 MeV and in 248Cf at 0.25 MeV mainly come from the contribution of the proton shell. Furthermore, the upbending for the GSB in 246Cm is mainly from the off-diagonal part of the proton shell, while both the diagonal and off-diagonal parts of the proton shell contribute to the upbending for the GSB in 248Cf. The off-diagonal part of the neutron shell only contributes a little to the upbending. It is very different from 250Fm and 252No. For these two nuclei, the contribution to the upbending from the off-diagonal parts of the proton shell and the off-diagonal part of the neutron shell is nearly the same. This is because that, with the proton number increasing, the Fermi surface leaves further and further from the orbital. In this case, the high- but high- orbital (deformation aligned) becomes close to the Fermi surface.

In order to have a more clear understanding of the upbending mechanism, the contribution of intruder proton orbitals (top row) and intruder neutron orbitals (bottom row) to the angular momentum alignments is presented in Fig. 17. The important diagonal (off-diagonal) part [] in Eq. (5) is denoted by blue solid (red dotted) lines. The orbitals that have no contribution to the upbending (some of these orbitals contribute to the steady increase of the alignment) are denoted by black lines. Near the proton Fermi surfaces of 246Cm and 248Cf, the proton orbitals are and . Other orbitals of parentage are either fully occupied or fully empty (cf. Fig. 15) and have no contribution to the upbending (only contribute to the steady increase of the alignment). For 246Cm, the PNC calculation shows that after the upbending ( 0.20 MeV) the off-diagonal part changes a lot. The alignment gain after the upbending mainly comes from this interference term. For 248Cf, the main contribution to the alignment gain after the upbending comes from the diagonal part and the off-diagonal part . Again this tells us that the upbending in both cases is mainly caused by the orbitals. As to 250Fm and 252No, only the off-diagonal part contributes a little to the upbending. The absence of the alignment of neutrons in nuclei in this mass region can be understood from the contribution of the intruder neutron orbitals () to . For the nuclei with , among the neutron orbitals of parentage, only the high- (deformation aligned) and are close to the Fermi surface. The diagonal parts of these two orbitals contribute no alignment to the upbending, only the interference terms contribute a little to the alignment. So we can see the strong competition in rotation-alignment between the high- protons and neutrons in 250Fm and 252No, which is consistent with the result in Ref. [73].
IV.4 Odd- nuclei
It is well known that there exist large fluctuations in the experimental odd-even differences in MOI’s . If a high- intruder orbital near the Fermi surface is blocked is quite large (sometime larger than 100%). It is very hard to reproduce the large fluctuations with the conventional BCS method which predicts that is about [131]. One of the advantages of the PNC-CSM is that the Pauli blocking effects are treated exactly. So the odd-even differences in the MOI’s can be reproduced quite well and this has been shown for rare-earth-nuclei [87]. There are two high- orbitals involved in the present calculations, namely, () and (). To show the blocking effects we study the following four nuclei and compare the calculated odd-even differences in MOI’s with the data,
It can be seen that the experimentally observed large odd-even difference in MOI’s induced by the high- intruder orbitals can be reproduced quite well.

Figure 18 shows the experimental and calculated MOI’s of the GSB’s for odd- Cm, Cf, Fm, and No isotopes (). The experimental MOI’s are denoted by solid squares (signature ) and open squares (signature ), respectively. The calculated MOI’s are denoted by solid lines (signature ) and dotted lines (signature ), respectively. The experimental MOI’s of all these 1-qp bands are well reproduced by the PNC-CSM calculations, which in turn strongly support the configuration assignments for them. The GSB’s in the bracket denote the PNC-CSM calculated results which have not been observed. We should note that the pairing strength used in Ref. [76] is a little different with what we used now. This is because the pairing strengths are considered as an average for all of these odd- nuclei.

In the isotones, our calculations predict a significant signature splitting at the low rotational frequency ( MeV) for the orbital. In the isotones, the signature splitting of the orbital is well reproduced by our calculation, too. It is understandable from the behavior of the cranked Nilsson orbital and in Fig. 3. In Ref. [76], we have already analyzed the upbending mechanism for the high-spin rotational GSB’s of 247,249Cm and 249Cf observed in Ref. [54].
Figure 19 shows the results of excited 1-qp bands observed in the odd- Cm, Cf, Fm, and No isotopes. They are all well reproduced by the PNC-CSM calculation. It is interesting to noted that, in an earlier experiment for 253No, rotational band has been established and the configuration was assigned as . In a latter experiment, a similar rotational band has been observed [56], but the configuration was assigned as . It can be seen that, the experimental MOI’s extracted from [55] using these two configurations can be reproduced by the PNC calculations. So from our calculation, it can not be distinguished which configuration assignment is correct.

Figure 20 is the experimental and calculated GSB’s of the odd- nuclei, including Bk, Es, and Md isotopes (). The data for these odd- nuclei are very rare. Most of the data are well reproduced, except the band in 253Es. The MOI of this band seems extremely large, is larger than 120 MeV-1. Our calculations show that the has a small signature splitting at the higher rotational frequency ( MeV). Figure. 21 shows the results of excited 1-qp bands observed in the odd- Bk, Es, and Md isotopes.

In some nuclei there exists a upbending around MeV in the (signature ) band according to the PNC calculations (i.e., the Bk isotopes). We show the occupation probabilities of the of each orbital near the Fermi surface of the () band in 249Bk. The top and bottom rows are for protons and neutrons respectively. The positive (negative) parity levels are denoted by blue solid (red dotted) lines. It is clearly to see that the occupation probabilities of and orbitals drop sharply at MeV, while of increases sharply. The occupation probabilities of the neutron orbitals change slowly with increasing , indicating little contribution to the upbending. Figure. 23 shows the contribution of each proton (top row) and neutron (bottom row) major shell to the angular momentum alignment for the () band in 249Bk. The diagonal and off-diagonal parts in Eq. (5) from the proton and neutron shells are shown by dashed lines. It can be seen from Fig. 23 that, both the diagonal and off-diagonal part from proton shell contribution to the upbending. PNC calculation shows that the upbending comes from the diagonal parts and , and the off-diagonal parts and .


IV.5 Odd-odd nuclei

When an unpaired proton and an unpaired neutron in a deformed odd-odd nucleus are coupled, the projections of their total angular momentum on the nuclear symmetry axis, and , can produce two states with and . They follow the Gallagher-Moszkowski (GM) coupling rules [133]:
The rotational bands in odd-odd nuclei in the transfermium region are very rare. The most recent experiment is 250Bk [132]. In [132], the energy splittings between parallel and antiparallel coupled neutron and proton states were measured for six pairs of states. Because the residual proton-neutron interaction is not included in our calculations, the energies of the 2-qp bands in odd-odd nuclei are the sum of the quasiproton and the quasineutron, that is to say, there is no energy splitting between states with parallel and antiparallel coupling.
Figure 24 shows the experimental and calculated MOI’s of 250Bk. The energy of neutron orbital is too high in our calculation, so we do not take into account the () bands observed in Ref. [132]. The up (down) triangles denote the experimental value of () bands. The filled (open) triangles denote the signature = 0 (1) bands. The solid (dotted) lines denote the calculated results with signature = 0 (1) bands. Most of the data are reproduced quite well. The calculated MOI’s are a little smaller in the bands than the experimental values, while much larger in the band.
The MOI’s of a and the corresponding bands are usually the same. But the MOI’s of band are much larger than those of the band. This is because for the band, the neutron component is , whereas for the band, the neutron component is and the signature splitting of is very large. The calculated results are very close to the data. Similarly, our calculation predicts that this signature splitting results in a big differences between the MOI’s of the and bands. However, this is not the case in the experiment. It is well known that when one of the nucleons is in an orbital, the GM doublet has , accordingly the two bands are expected to be Coriolis admixed. This effect can be very significant in the band, which has been identified in the odd-odd rare-earth nuclei [134, 135]. The similar MOI’s in the and bands may be from this mixing and need further exploration both experimentally and theoretically.
V Summary
In summary, the rotational bands in the mass region are investigated using a cranked shell model (CSM) with the pairing correlations treated by a particle-number conserving (PNC) method. In the PNC method for the pairing correlations, the blocking effects are taken into account exactly. By fitting the experimental single-particle spectra in these nuclei, a new set of Nilsson parameters ( and ) and deformation parameters ( and ) are proposed. The bandhead energies of 1-qp states with energies less than 0.8 MeV are reproduced satisfactorily. The experimentally observed variations of MOI’s for the even-even, odd-, and odd-odd nuclei are reproduced very well by the PNC-CSM calculations. By analyzing the -dependence of the occupation probability of each cranked Nilsson orbital near the Fermi surface and the contributions of valence orbitals in each major shell to the angular momentum alignment, the upbending mechanism in this region is understood clearly. For Cm and Cf isotopes, the upbending in the GSB’s is mainly caused by the intruder proton () orbitals. For Fm and No isotopes, neutrons and protons from the high- orbits compete strongly in rotation-alignment. The 2-qp states in the odd-odd nuclei 250Bk are analyzed in detail.
Acknowledgements.
Helpful discussions with G. Adamian, N. Antonenko, B. A. Brown, N. V. Giai, R. V. Jolos, J. Meng, P. Ring, F. Sakata, Y. Sun, and D. Vretenar are gratefully acknowledged. This work has been supported by NSFC (Grant Nos. 10705014, 10875157, 10975100, 10979066, 11175252, and 11120101005), MOST (973 Project 2007CB815000), CAS (Grant Nos. KJCX2-EW-N01 and KJCX2-YW-N32), and FRF for NUAA (Grant No. NS2010157). The computation of this work was supported by Supercomputing Center, CNIC of CAS.References
- [1] W. D. Myers and W. J. Swiatecki, Nucl. Phys. 81, 1 (1966).
- [2] A. Sobiczewski, F. Gareev, and B. Kalinkin, Phys. Lett. 22, 500 (1966).
- [3] H. Meldner, Arkiv Fysik 36, 593 (1967), in Proc. of the Lysekil Symposium: Nuclides far off the Stability Line, Aug. 21-27, 1966, Sweden.
- [4] S. G. Nilsson, J. R. Nix, A. Sobiczewski, Z. Szymanski, S. Wycech, C. Gustafson, and P. Möller, Nucl. Phys. A 115, 545 (1968).
- [5] S. G. Nilsson, S. G. Thompson, and C. F. Tsang, Phys. Lett. B 28, 458 (1969a).
- [6] S. G. Nilsson, C. F. Tsang, A. Sobiczewski, Z. Szymanski, S. Wycech, C. Gustafson, I.-L. Lamm, P. Möller, and B. Nilsson, Nucl. Phys. A 131, 1 (1969b).
- [7] U. Mosel and W. Greiner, Z. Phys. A 222, 261 (1969).
- [8] J. Grumann, U. Mosel, B. Fink, and W. Greiner, Z. Phys. A 228, 371 (1969).
- [9] S. Hofmann and G. Münzenberg, Rev. Mod. Phys. 72, 733 (2000).
- [10] K. Morita, K. Morimoto, D. Kaji, T. Akiyama, S.-i. Goto, H. Haba, E. Ideguchi, R. Kanungo, K. Katori, H. Koura, H. Kudo, T. Ohnishi, A. Ozawa, T. Suda, K. Sueki, H.-S. Xu, T. Yamaguchi, A. Yoneda, A. Yoshida, and Y.-L. Zhao, J. Phys. Soc. Jpn. 73, 2593 (2004).
- [11] Y. Oganessian, J. Phys. G: Nucl. Phys. 34, R165 (2007).
- [12] Y. T. Oganessian, F. S. Abdullin, P. D. Bailey, D. E. Benker, M. E. Bennett, S. N. Dmitriev, J. G. Ezold, J. H. Hamilton, R. A. Henderson, M. G. Itkis, Y. V. Lobanov, A. N. Mezentsev, K. J. Moody, S. L. Nelson, A. N. Polyakov, C. E. Porter, A. V. Ramayya, F. D. Riley, J. B. Roberto, M. A. Ryabinin, K. P. Rykaczewski, R. N. Sagaidak, D. A. Shaughnessy, I. V. Shirokovsky, M. A. Stoyer, V. G. Subbotin, R. Sudowe, A. M. Sukhov, Y. S. Tsyganov, V. K. Utyonkov, A. A. Voinov, G. K. Vostokin, and P. A. Wilk, Phys. Rev. Lett. 104, 142502 (2010).
- [13] A. Sobiczewski and K. Pomorski, Prog. Part. Nucl. Phys. 58, 292 (2007).
- [14] S. Cwiok and A. Sobiczewski, Z. Phys. A 342, 203 (1992).
- [15] P. Möller, J. R. Nix, W. D. Myers, and W. J. Swiatecki, At. Data Nucl. Data Tables 59, 185 (1995).
- [16] A. Mamdouh, J. M. Pearson, M. Rayet, and F. Tondeur, Nucl. Phys. A 679, 337 (2001).
- [17] K. Rutz, M. Bender, T. Burvenich, T. Schilling, P.-G. Reinhard, J. A. Maruhn, and W. Greiner, Phys. Rev. C 56, 238 (1997).
- [18] M. Bender, K. Rutz, P.-G. Reinhard, J. A. Maruhn, and W. Greiner, Phys. Rev. C 60, 034304 (1999).
- [19] A. T. Kruppa, M. Bender, W. Nazarewicz, P.-G. Reinhard, T. Vertse, and S. Cwiok, Phys. Rev. C 61, 034313 (2000).
- [20] G. A. Lalazissis, M. M. Sharma, P. Ring, and Y. K. Gambhir, Nucl. Phys. A 608, 202 (1996).
- [21] W. Zhang, J. Meng, S. Zhang, L. Geng, and H. Toki, Nucl. Phys. A 753, 106 (2005).
- [22] J. Meng, H. Toki, S. G. Zhou, S. Q. Zhang, W. H. Long, and L. S. Geng, Prog. Part. Nucl. Phys. 57, 470 (2006a).
- [23] G. G. Adamian, N. V. Antonenko, W. Scheid, and V. V. Volkov, Nucl. Phys. A 633, 409 (1998).
- [24] G. G. Adamian, N. V. Antonenko, and W. Scheid, Phys. Rev. C 69, 011601 (2004).
- [25] A. Zubov, G. Adamian, and N. Antonenko, Phys. Part. Nucl. 40, 847 (2009).
- [26] W. Li, N. Wang, J. F. Li, H. Xu, W. Zuo, E. Zhao, J. Q. Li, and W. Scheid, Europhys. Lett. 64, 750 (2003).
- [27] E. G. Zhao, N. Wang, Z. Q. Feng, J. Q. Li, S. G. Zhou, and W. Scheid, Int. J. Mod. Phys. E 17, 1937 (2008), in Proceedings of International Workshop on Nuclear Dynamics in Heavy-ion Reactions and Neutron Stars, Beijing, July 9-14, 2007.
- [28] J.-Q. Li, Z.-Q. Feng, Z.-G. Gan, X.-H. Zhou, H.-F. Zhang, and W. Scheid, The 10th International Conference on Nucleus-Nucleus Collisions (NN2009), Nucl. Phys. A 834, 353c (2010).
- [29] Z.-Q. Feng, G.-M. Jin, and J.-Q. Li, Nucl. Phys. Rev. 28, 1 (2011).
- [30] W. J. Swiatecki, K. Siwek-Wilczynska, and J. Wilczynski, Phys. Rev. C 71, 014602 (2005).
- [31] Z. H. Liu and J.-D. Bao, Phys. Rev. C 76, 034604 (2007).
- [32] Z. H. Liu and J.-D. Bao, Phys. Rev. C 80, 034601 (2009a).
- [33] Z. H. Liu and J.-D. Bao, Sci. China Ser. G-Phys. Mech. Astron. 52, 1482 (2009b).
- [34] V. I. Zagrebaev, Phys. Rev. C 64, 034606 (2001).
- [35] V. Zagrebaev and W. Greiner, J. Phys. G: Nucl. Part. Phys. 31, 825 (2005).
- [36] V. Zagrebaev and W. Greiner, Phys. Rev. C 78, 034610 (2008).
- [37] B.-A. Bian, F.-S. Zhang, and H.-Y. Zhou, Nucl. Phys. A 829, 1 (2009).
- [38] S. S. Du, B. A. Bian, M. Liu, Z. Q. Feng, and F. S. Zhang, Sci. China Ser. G-Phys. Mech. Astron. 52, 1489 (2009).
- [39] Y. Abe, C. Shen, G. Kosenko, and D. Boilley, Phys. At. Nucl. 66, 1057 (2003).
- [40] C. Shen, G. Kosenko, and Y. Abe, Phys. Rev. C 66, 061602R (2002).
- [41] C. W. Shen, Y. Abe, Q. F. Li, and D. Boilley, Sci. China Ser. G-Phys. Mech. Astron. 52, 1458 (2009).
- [42] G. G. Adamian, N. V. Antonenko, S. P. Ivanova, and W. Scheid, Phys. Rev. C 62, 064303 (2000).
- [43] G. G. Adamian, N. V. Antonenko, and V. V. Sargsyan, Phys. Rev. C 79, 054608 (2009).
- [44] C.-J. Xia, B.-X. Sun, E.-G. Zhao, and S.-G. Zhou, Sci. China-Phys. Mech. Astron. 54 (Suppl. 1), 109 (2011), arXiv: 1101.2725 [nucl-th].
- [45] M. Leino and F. P. Hessberger, Annu. Rev. Nucl. Part. Sci. 54, 175 (2004).
- [46] D. Ackermann, Acta Phys. Pol. B 42, 577 (2011).
- [47] R.-D. Herzberg, J. Phys. G: Nucl. Phys. 30, R123 (2004).
- [48] R.-D. Herzberg and P. Greenlees, Prog. Part. Nucl. Phys. 61, 674 (2008).
- [49] P. T. Greenlees, Acta Phys. Pol. B 42, 587 (2011).
- [50] P. Reiter, T. L. Khoo, C. J. Lister, D. Seweryniak, I. Ahmad, M. Alcorta, M. P. Carpenter, J. A. Cizewski, C. N. Davids, G. Gervais, J. P. Greene, W. F. Henning, R. V. F. Janssens, T. Lauritsen, S. Siem, A. A. Sonzogni, D. Sullivan, J. Uusitalo, I. Wiedenhover, N. Amzal, P. A. Butler, A. J. Chewter, K. Y. Ding, N. Fotiades, J. D. Fox, P. T. Greenlees, R.-D. Herzberg, G. D. Jones, W. Korten, M. Leino, and K. Vetter, Phys. Rev. Lett. 82, 509 (1999).
- [51] J. E. Bastin, R.-D. Herzberg, P. A. Butler, G. D. Jones, R. D. Page, D. G. Jenkins, N. Amzal, P. M. T. Brew, N. J. Hammond, R. D. Humphreys, P. J. C. Ikin, T. Page, P. T. Greenlees, P. M. Jones, R. Julin, S. Juutinen, H. Kankaanpaa, A. Keenan, H. Kettunen, P. Kuusiniemi, M. Leino, A. P. Leppanen, M. Muikku, P. Nieminen, P. Rahkila, C. Scholey, J. Uusitalo, E. Bouchez, A. Chatillon, A. Hurstel, W. Korten, Y. L. Coz, C. Theisen, D. Ackermann, J. Gerl, K. Helariutta, F. P. Hessberger, C. Schlegel, H. J. Wollerscheim, M. Lach, A. Maj, W. Meczynski, J. Styczen, T. L. Khoo, C. J. Lister, A. V. Afanasjev, H. J. Maier, P. Reiter, P. Bednarczyc, K. Eskola, and K. Hauschild, Phys. Rev. C 73, 024308 (2006).
- [52] R.-D. Herzberg, N. Amzal, F. Becker, P. A. Butler, A. J. C. Chewter, J. F. C. Cocks, O. Dorvaux, K. Eskola, J. Gerl, P. T. Greenlees, N. J. Hammond, K. Hauschild, K. Helariutta, F. Hessberger, M. Houry, G. D. Jones, P. M. Jones, R. Julin, S. Juutinen, H. Kankaanpaa, H. Kettunen, T. L. Khoo, W. Korten, P. Kuusiniemi, Y. Le Coz, M. Leino, C. J. Lister, R. Lucas, M. Muikku, P. Nieminen, R. D. Page, P. Rahkila, P. Reiter, C. Schlegel, C. Scholey, O. Stezowski, C. Theisen, W. H. Trzaska, J. Uusitalo, and H. J. Wollersheim, Phys. Rev. C 65, 014303 (2001).
- [53] R. Takahashi, T. Ishii, M. Asai, D. Nagae, H. Makii, K. Tsukada, A. Toyoshima, Y. Ishii, M. Matsuda, A. Makishima, T. Shizuma, T. Kohno, and M. Ogawa, Phys. Rev. C 81, 057303 (2010).
- [54] S. K. Tandel, P. Chowdhury, S. Lakshmi, U. S. Tandel, I. Ahmad, M. P. Carpenter, S. Gros, R. V. F. Janssens, T. L. Khoo, F. G. Kondev, J. P. Greene, D. J. Hartley, T. Lauritsen, C. J. Lister, D. Peterson, A. Robinson, D. Seweryniak, and S. Zhu, Phys. Rev. C 82, 041301R (2010).
- [55] P. Reiter, T. L. Khoo, I. Ahmad, A. V. Afanasjev, A. Heinz, T. Lauritsen, C. J. Lister, D. Seweryniak, P. Bhattacharyya, P. A. Butler, M. P. Carpenter, A. J. Chewter, J. A. Cizewski, C. N. Davids, J. P. Greene, P. T. Greenlees, K. Helariutta, R.-D. Herzberg, R. V. F. Janssens, G. D. Jones, R. Julin, H. Kankaanpaa, H. Kettunen, F. G. Kondev, P. Kuusiniemi, M. Leino, S. Siem, A. A. Sonzogni, J. Uusitalo, and I. Wiedenhover, Phys. Rev. Lett. 95, 032501 (2005).
- [56] R. Herzberg, S. Moon, S. Eeckhaudt, P. Greenlees, P. Butler, T. Page, A. Afanasjev, N. Amzal, J. Bastin, F. Becker, M. Bender, B. Bruyneel, J. Cocks, I. Darby, O. Dorvaux, K. Eskola, J. Gerl, T. Grahn, C. Gray-Jones, N. Hammond, K. Hauschild, P. Heenen, K. Helariutta, A. Herzberg, F. Hessberger, M. Houry, A. Hürstel, R. Humphreys, G. Jones, P. Jones, R. Julin, S. Juutinen, H. Kankaanpaa, H. Kettunen, T. Khoo, W. Korten, P. Kuusiniemi, Y. LeCoz, M. Leino, A. Leppanen, C. Lister, R. Lucas, M. Muikku, P. Nieminen, M. Nyman, R. Page, T. Page, J. Pakarinen, A. Pritchard, P. Rahkila, P. Reiter, M. Sandzelius, J. Saren, C. Schlegel, C. Scholey, C. Theisen, W. Trzaska, J. Uusitalo, A. Wiens, and H. Wollersheim, Eur. Phys. J. A 42, 333 (2009).
- [57] A. Chatillon, C. Theisen, E. Bouchez, P. A. Butler, E. Clement, O. Dorvaux, S. Eeckhaudt, B. J. P. Gall, A. Gorgen, T. Grahn, P. T. Greenlees, R.-D. Herzberg, F. Hessberger, A. Hurstel, G. D. Jones, P. Jones, R. Julin, S. Juutinen, H. Kettunen, F. Khalfallah, W. Korten, Y. L. Coz, M. Leino, A.-P. Leppanen, P. Nieminen, J. Pakarinen, J. Perkowski, P. Rahkila, M. Rousseau, C. Scholey, J. Uusitalo, J. N. Wilson, P. Bonche, and P.-H. Heenen, Phys. Rev. Lett. 98, 132503 (2007).
- [58] S. Ketelhut, P. T. Greenlees, D. Ackermann, S. Antalic, E. Clement, I. G. Darby, O. Dorvaux, A. Drouart, S. Eeckhaudt, B. J. P. Gall, A. Gorgen, T. Grahn, C. Gray-Jones, K. Hauschild, R.-D. Herzberg, F. P. Hessberger, U. Jakobsson, G. D. Jones, P. Jones, R. Julin, S. Juutinen, T.-L. Khoo, W. Korten, M. Leino, A.-P. Leppaenen, J. Ljungvall, S. Moon, M. Nyman, A. Obertelli, J. Pakarinen, E. Parr, P. Papadakis, P. Peura, J. Piot, A. Pritchard, P. Rahkila, D. Rostron, P. Ruotsalainen, M. Sandzelius, J. Saren, C. Scholey, J. Sorri, A. Steer, B. Sulignano, C. Theisen, J. Uusitalo, M. Venhart, M. Zielinska, M. Bender, and P.-H. Heenen, Phys. Rev. Lett. 102, 212501 (2009).
- [59] A. V. Afanasjev, T. L. Khoo, S. Frauendorf, G. A. Lalazissis, and I. Ahmad, Phys. Rev. C 67, 024309 (2003).
- [60] M. Bender, P. Bonche, T. Duguet, and P. H. Heenen, Nucl. Phys. A 723, 354 (2003).
- [61] J.-P. Delaroche, M. Girod, H. Goutte, and J. Libert, Nucl. Phys. A 771, 103 (2006).
- [62] G. G. Adamian, N. V. Antonenko, L. A. Malov, B. N. Lu, S. G. Zhou, and W. Scheid, Phys. Part. Nucl. 41, 1101 (2010a).
- [63] G. G. Adamian, N. V. Antonenko, S. N. Kuklin, B. N. Lu, L. A. Malov, and S. G. Zhou, Phys. Rev. C 84, 024324 (2011).
- [64] S. Cwiok, S. Hofmann, and W. Nazarewicz, Nucl. Phys. A 573, 356 (1994).
- [65] I. Muntian, Z. Patyk, and A. Sobiczewski, Phys. Rev. C 60, 041302 (1999).
- [66] A. Sobiczewski, I. Muntian, and Z. Patyk, Phys. Rev. C 63, 034306 (2001).
- [67] A. Parkhomenko and A. Sobiczewski, Acta Phys. Pol. B 35, 2447 (2004).
- [68] A. Parkhomenko and A. Sobiczewski, Acta Phys. Pol. B 36, 3115 (2005).
- [69] G. G. Adamian, N. V. Antonenko, and W. Scheid, Phys. Rev. C 81, 024320 (2010b).
- [70] G. G. Adamian, N. V. Antonenko, S. N. Kuklin, and W. Scheid, Phys. Rev. C 82, 054304 (2010c).
- [71] Y. Sun, G.-L. Long, F. Al-Khudair, and J. A. Sheikh, Phys. Rev. C 77, 044307 (2008).
- [72] Y.-S. Chen, Y. Sun, and Z.-C. Gao, Phys. Rev. C 77, 061305R (2008).
- [73] F. Al-Khudair, G.-L. Long, and Y. Sun, Phys. Rev. C 79, 034320 (2009).
- [74] F. R. Xu, E. G. Zhao, R. Wyss, and P. M. Walker, Phys. Rev. Lett. 92, 252501 (2004).
- [75] X.-T. He, Z.-Z. Ren, S.-X. Liu, and E.-G. Zhao, Nucl. Phys. A 817, 45 (2009).
- [76] Z.-H. Zhang, J.-Y. Zeng, E.-G. Zhao, and S.-G. Zhou, Phys. Rev. C 83, 011304R (2011), arXiv: 1101.3607v1 [nucl-th].
- [77] R. V. Jolos, L. A. Malov, N. Y. Shirikova, and A. V. Sushkov, J. Phys. G: Nucl. Part. Phys. 38, 115103 (2011).
- [78] K. Zhuang, Z.-B. Li, and Y.-X. Liu, “Rotational property of 249Cm in the particle-triaxial-rotor model,” Commun. Theor. Phys., in press.
- [79] J.-W. Cui, X.-R. Zhou, F.-Q. Chen, Y. Sun, C.-L. Wu, and H. Zhao, “Study on the band structure of the actinide-region nuclei by heavy shell model,” in preparation.
- [80] J. Y. Zeng and T. S. Cheng, Nucl. Phys. A 405, 1 (1983).
- [81] J. Y. Zeng, T. H. Jin, and Z. J. Zhao, Phys. Rev. C 50, 1388 (1994a).
- [82] C. S. Wu and J. Y. Zeng, Phys. Rev. C 39, 666 (1989).
- [83] J. Meng, J.-y. Guo, L. Liu, and S.-q. Zhang, Frontiers Phys. China 1, 38 (2006b).
- [84] N. Pillet, P. Quentin, and J. Libert, Nucl. Phys. A 697, 141 (2002).
- [85] X. B. Xin, S. X. Liu, Y. A. Lei, and J. Y. Zeng, Phys. Rev. C 62, 067303 (2000).
- [86] H. Molique and J. Dudek, Phys. Rev. C 56, 1795 (1997).
- [87] J. Y. Zeng, Y. A. Lei, T. H. Jin, and Z. J. Zhao, Phys. Rev. C 50, 746 (1994b).
- [88] C. S. Wu and J. Y. Zeng, Phys. Rev. C 41, 1822 (1990).
- [89] Z. H. Zhang, X. Wu, Y. A. Lei, and J. Y. Zeng, Nucl. Phys. A 816, 19 (2009a).
- [90] Z. H. Zhang, Y. A. Lei, and J. Y. Zeng, Phys. Rev. C 80, 034313 (2009b).
- [91] S. X. Liu, J. Y. Zeng, and L. Yu, Nucl. Phys. A 735, 77 (2004).
- [92] B. R. Chen, T. Li, and S. X. Liu, Sci. China Ser. G-Phys. Mech. Astron. 52, 1542 (2009).
- [93] X. He, S. Yu, J. Zeng, and E. Zhao, Nucl. Phys. A 760, 263 (2005).
- [94] S. X. Liu and J. Y. Zeng, Phys. Rev. C 66, 067301 (2002).
- [95] J. Y. Zeng, S. X. Liu, Y. A. Lei, and L. Yu, Phys. Rev. C 63, 024305 (2001).
- [96] S. X. Liu, J. Y. Zeng, and E. G. Zhao, Phys. Rev. C 66, 024320 (2002).
- [97] X. Wu, Z. H. Zhang, J. Y. Zeng, and Y. A. Lei, Phys. Rev. C 83, 034323 (2011).
- [98] T. Bengtsson and I. Ragnarsson, Nucl. Phys. A 436, 14 (1985).
- [99] T. Seo, Z. Phys. A 324, 43 (1986).
- [100] J.-y. Zhang, Y. Sun, M. Guidry, L. L. Riedinger, and G. A. Lalazissis, Phys. Rev. C 58, R2663 (1998).
- [101] Y. Sun, J.-y. Zhang, M. Guidry, J. Meng, and S. Im, Phys. Rev. C 62, 021601 (2000).
- [102] T. M. Shneidman, G. G. Adamian, N. V. Antonenko, and R. V. Jolos, Phys. Rev. C 74, 034316 (2006).
- [103] B.-N. Lu and S.-G. Zhao, En-Guangand Zhou, “Potential energy surfaces of actinide nuclei from a multi-dimensional constraint covariant density functional theory: Barrier heights and saddle point shapes,” arXiv: 1110.6769 [nucl-th] (2011), Phys. Rev. C, in press.
- [104] R. R. Chasman, I. Ahmad, A. M. Friedman, and J. R. Erskine, Rev. Mod. Phys. 49, 833 (1977).
- [105] R. R. Chasman, I. Ahmad, A. M. Friedman, and J. R. Erskine, Rev. Mod. Phys. 50, 173 (1978).
- [106] M. Martin, Nucl. Data Sheets 106, 89 (2005).
- [107] F. P. Hessberger, S. Hofmann, D. Ackermann, P. Cagarda, R. D. Herzberg, I. Kojouharov, P. Kuusiniemi, M. Leino, and R. Mann, Eur. Phys. J. A 22, 417 (2004).
- [108] T. H. Braid, R. R. Chasman, J. R. Erskine, and A. M. Friedman, Phys. Rev. C 4, 247 (1971).
- [109] F. Hessberger, S. Hofmann, D. Ackermann, S. Antalic, B. Kindler, I. Kojouharov, P. Kuusiniemi, M. Leino, B. Lommel, R. Mann, K. Nishio, A. Popeko, B. Sulignano, S. Saro, B. Streicher, M. Venhart, and A. Yeremin, Eur. Phys. J. A 30, 561 (2006a).
- [110] R. Firestone, C. M. Baglin, and S. Y. Frank Chu, Table of Isotopes: 1999 Update with CD-ROM (Wiley, New York, 1999).
- [111] Y. A. Akovali, Nucl. Data Sheets 102, 515 (2004).
- [112] F. P. Hessberger, Eur. Phys. J. D 45, 33 (2007).
- [113] M. Asai, K. Tsukada, H. Haba, Y. Ishii, T. Ichikawa, A. Toyoshima, T. Ishii, Y. Nagame, I. Nishinaka, Y. Kojima, and K. Sueki, Phys. Rev. C 83, 014315 (2011).
- [114] I. Ahmad, R. R. Chasman, J. P. Greene, F. G. Kondev, E. F. Moore, E. Browne, C. E. Porter, and L. K. Felker, Phys. Rev. C 68, 044306 (2003).
- [115] H. Makii, T. Ishii, M. Asai, K. Tsukada, A. Toyoshima, M. Matsuda, A. Makishima, J. Kaneko, H. Toume, S. Ichikawa, S. Shigematsu, T. Kohno, and M. Ogawa, Phys. Rev. C 76, 061301 (2007).
- [116] A. Lopez-Martens, K. Hauschild, A. Yeremin, O. Dorvaux, A. Belozerov, C. Briancon, M. Chelnokov, V. Chepigin, D. Curien, P. Desesquelles, B. Gall, V. Gorshkov, M. Guttormsen, F. Hanappe, A. Kabachenko, F. Khalfallah, A. Korichi, A. Larsen, O. Malyshev, A. Minkova, Y. Oganessian, A. Popeko, M. Rousseau, N. Rowley, R. Sagaidak, S. Sharo, A. Shutov, S. Siem, L. Stuttge, A. Svirikhin, N. Syed, and C. Theisen, Eur. Phys. J. A 32, 245 (2007).
- [117] S. W. Yates, R. R. Chasman, A. M. Friedman, I. Ahmad, and K. Katori, Phys. Rev. C 12, 442 (1975).
- [118] T. Ishii, H. Makii, M. Asai, K. Tsukada, A. Toyoshima, M. Matsuda, A. Makishima, S. Shigematsu, J. Kaneko, T. Shizuma, H. Toume, I. Hossain, T. Kohno, and M. Ogawa, Phys. Rev. C 78, 054309 (2008).
- [119] I. Ahmad, J. P. Greene, E. F. Moore, F. G. Kondev, R. R. Chasman, C. E. Porter, and L. K. Felker, Phys. Rev. C 72, 054308 (2005a).
- [120] M. Asai, K. Tsukada, M. Sakama, S. Ichikawa, T. Ishii, Y. Nagame, I. Nishinaka, K. Akiyama, A. Osa, Y. Oura, K. Sueki, and M. Shibata, Phys. Rev. Lett. 95, 102502 (2005).
- [121] F. Hessberger, S. Hofmann, D. Ackermann, S. Antalic, B. Kindler, I. Kojouharov, P. Kuusiniemi, M. Leino, B. Lommel, R. Mann, K. Nishio, A. Popeko, B. Sulignano, S. Saro, B. Streicher, M. Venhart, and A. Yeremin, Eur. Phys. J. A 29, 165 (2006b).
- [122] H. Yuichi, O. Tsutomu, S. Keisuke, N. Hiromichi, K. Isao, M. Masaaki, S. Nobuo, H. L. Hall, R. A. Henderson, C. M. Gannet, J. A. Leyba, R. B. Chadwick, K. E. Gregorich, D. Lee, M. J. Nurmia, and D. C. Hoffman, Nucl. Phys. A 500, 90 (1989).
- [123] I. Ahmad, S. W. Yates, R. K. Sjoblom, and A. M. Friedman, Phys. Rev. C 20, 290 (1979).
- [124] I. Ahmad, F. G. Kondev, E. F. Moore, M. P. Carpenter, R. R. Chasman, J. P. Greene, R. V. F. Janssens, T. Lauritsen, C. J. Lister, D. Seweryniak, R. W. Hoff, J. E. Evans, R. W. Lougheed, C. E. Porter, and L. K. Felker, Phys. Rev. C 71, 054305 (2005b).
- [125] J. Tuli, S. Singh, and A. K. Jain, Nucl. Data Sheets 107, 1347 (2006).
- [126] I. Ahmad, R. K. Sjoblom, A. M. Friedman, and S. W. Yates, Phys. Rev. C 17, 2163 (1978).
- [127] F. Hessberger, S. Antalic, B. Streicher, S. Hofmann, D. Ackermann, B. Kindler, I. Kojouharov, P. Kuusiniemi, M. Leino, B. Lommel, R. Mann, K. Nishio, S. Saro, and B. Sulignano, Eur. Phys. J. A 26, 233 (2005).
- [128] I. Ahmad, R. R. Chasman, and P. R. Fields, Phys. Rev. C 61, 044301 (2000).
- [129] A. Chatillon, C. Theisen, P. Greenlees, G. Auger, J. Bastin, E. Bouchez, B. Bouriquet, J. Casandjian, R. Cee, E. Clement, R. Dayras, G. de France, R. de Toureil, S. Eeckhaudt, A. Goergen, T. Grahn, S. Grevy, K. Hauschild, R. Herzberg, P. Ikin, G. Jones, P. Jones, R. Julin, S. Juutinen, H. Kettunen, A. Korichi, W. Korten, Y. Le Coz, M. Leino, A. Lopez-Martens, S. Lukyanov, Y. Penionzhkevich, J. Perkowski, A. Pritchard, P. Rahkila, M. Rejmund, J. Saren, C. Scholey, S. Siem, M. Saint-Laurent, C. Simenel, Y. Sobolev, C. Stodel, J. Uusitalo, A. Villari, M. Bender, P. Bonche, and P. Heenen, Eur. Phys. J. A 30, 397 (2006).
- [130] F. S. Stephens, Rev. Mod. Phys. 47, 43 (1975).
- [131] A. Bohr and B. R. Mottelson, Nuclear Structure, 1st ed., Vol. II (Benjamin, New York, 1975).
- [132] I. Ahmad, F. G. Kondev, Z. M. Koenig, W. C. McHarris, and S. W. Yates, Phys. Rev. C 77, 054302 (2008).
- [133] C. J. Gallagher and S. A. Moszkowski, Phys. Rev. 111, 1282 (1958).
- [134] R. O’neil and D. Burke, Nucl. Phys. A 195, 207 (1972).
- [135] A. K. Jain, R. K. Sheline, D. M. Headly, P. C. Sood, D. G. Burke, I. Hrivnacova, J. Kvasil, D. Nosek, and R. W. Hoff, Rev. Mod. Phys. 70, 843 (1998).