Dynamics in dense hard-sphere colloidal suspensions
Abstract
The dynamic behavior of a hard-sphere colloidal suspension was studied by X-ray Photon Correlation Spectroscopy and Small Angle X-ray Scattering over a wide range of particle volume fractions. The short-time mobility of the particles was found to be smaller than that of free particles even at relatively low concentrations, showing the importance of indirect hydrodynamic interactions. Hydrodynamic functions were derived from the data and for moderate particle volume fractions ( 0.40) there is a good agreement with earlier many-body theory calculations by Beenakker and Mazur [C.W.J. Beenakker and P. Mazur, Physica A 120, 349 (1984)]. Important discrepancies appear at higher concentrations, above 0.40, where the hydrodynamic effects are overestimated by the Beenakker-Mazur theory, but predicted accurately by an accelerated Stokesian dynamics algorithm developed by Banchio and Brady [A.J. Banchio and J. F. Brady, J. Chem. Phys. 118, 10323 (2003)]. For the relaxation rates, good agreement was also found between the experimental data and a scaling form predicted by Mode Coupling Theory. In the high concentration range, with the fluid suspensions approaching the glass transition, the long-time diffusion coefficient was compared with the short-time collective diffusion coefficient to verify a scaling relation previously proposed by Segrè and Pusey [P.N. Segrè and P.N. Pusey, Phys. Rev. Lett. 77, 771 (1996)]. We discuss our results in view of previous experimental attempts to validate this scaling law [L. Lurio et al., Phys. Rev. Lett. 84, 785 (2000)].
pacs
83.80.Hj, 61.05.cf, 64.70.pv, 64.70.qjI Introduction
The dynamical behavior of colloidal suspensions is a very rich research area with borderlines to many fields of fundamental research and important industrial applications. High density colloidal suspensions provide, for instance, invaluable model systems for the study and understanding of dynamics in atomic glasses. Prototypical model systems consist in suspensions of spherical particles with low size polydispersity. They are stabilized against aggregation due to van der Waals attractive forces by coating the surface with a short-chained polymer (steric stabilization) or with a charged ionic layer (charge stabilization). The present study focusses on the dynamics of sterically-stabilized suspensions. For such suspensions, the inter-particle forces are well described by a hard-sphere interaction potential with no detectable long-range interactions and an infinite repulsion when two particle centers are separated by one diameter.
The experimental study of dynamics in dense colloidal suspensions was pioneered by P. N. Pusey, W. van Megen and collaborators (see e.g. [1, 2, 3, 4, 5, 6]), using Dynamic Light Scattering (DLS). The phase behavior of a hard-sphere suspension depends on a single parameter - the packing fraction, or particle volume fraction, . In the low volume fraction limit, with on the order of a few percent or less, the dynamics of individual particles is essentially Brownian. The relaxation times measured by DLS yield a -independent diffusion coefficient equal to that of free particles i.e. the Stokes-Einstein free diffusion coefficient. However, as soon as the volume fraction is increased, the dynamics is slowed down by both direct interactions between the particles and by indirect hydrodynamic interactions mediated by the solvent. These interactions are highly dependent on the structural properties of the system and thus on the scattering vector . In order to minimize effects introduced by multiple scattering of light, the DLS studies use elaborate refraction index matching procedures between the colloidal particles and the solvent or complex scattering techniques such as two-color DLS (TCDLS) [7]. The TCDLS work described in Ref. [5] studies the dynamics of hard-sphere colloidal suspensions. The - and time-dependent short-time diffusion coefficient obtained from the intensity autocorrelation functions could be related, via the static structure factor , to the hydrodynamic functions predicted by a many-body theory derived by Beenakker and Mazur (BM) [8, 9]. The study in Ref. [5] showed and excellent match between TCDLS measurements and the BM predictions in fluid suspensions of relatively low ( 0.35) volume fractions. On the contrary, at higher concentrations () the TCDLS data deviated significantly from the BM theory.
In the present study we further investigate these phenomena using a complementary experimental technique, that is X-ray Photon Correlation Spectroscopy (XPCS) (for some recent reviews, see [10, 11, 12] and references therein). XPCS is the equivalent of DLS in the X-ray domain. It is not affected by problems related to multiple scattering and access to larger momentum transfers is possible thanks to the shorter wavelength. An important consequence of the access to higher values is that the static structure factor can be experimentally determined and modeled, e.g. by the Percus–Yevick formalism. XPCS can only be performed at the latest generation synchrotron radiation sources where the coherent flux is large enough to perform scattering experiments and obtain a good signal-to-noise ratio of the correlation functions. Damage to the sample induced by the X-ray beam can be a nuisance, especially when studying soft-matter or biological systems, and during an experiment one must carefully monitor the state of the sample.
II Experimental details
The XPCS experiments were performed using partially coherent X-rays at the ID10A beamline (Troïka) of the European Synchrotron Radiation Facility (ESRF) in Grenoble, France. A single bounce Si(111) crystal monochromator was used to select 8 keV X-rays, having a relative bandwidth of . Higher order light was suppressed by a Si mirror placed in the monochromatic beam. A transversely partially coherent beam was defined by using a set of high heat-load secondary slits placed at 33 m from the undulator source, a beryllium compound refractive lens (CRL) unit placed at 34 m from the source thereby focusing the beam near the sample location, at 46 m, and by a set of high precision pinhole slits with highly polished cylindrical edges, placed just upstream of the sample, at 45.5 m (see figure 1). The final beam size selected by the beam-defining pinhole slits was 10 x 10 m2. The parasitic scattering from the slits was suppressed by a guard slit placed a few cm upstream of the sample. Under these conditions, the partial coherent flux on the sample was ph/s.
The static scattering from the colloidal suspensions was recorded by a charge-coupled device (CCD) with 22 m pixels size located 2.2 m downstream of the sample. The dynamic information was obtained with a scintillation detector (Cyberstar) connected to a multiple-tau FLEX01-08D hardware correlator from Correlator.com. The detection area was limited to a size corresponding to a few speckles by precision slits placed in front of the point detector. Typical detector slit settings during these experiments were between 50 x 50 m2 and 100 x 100 m2.

The colloidal suspension was prepared by A. Schofield of the University of Edinburgh and consisted in poly(methyl methacrylate) (PMMA) spherical particles coated with a thin layer of poly-12-hydroxy steric acid, suspended in decalin. A net electric charge on the colloidal particles can typically be produced in low polarity solvents by the addition of surfactants or charge-control additives [18]. However, as prepared, the particles suspended in decalin are expected to show no detectable traces of residual charges (see e.g. [19]) and interact as almost perfect hard spheres. This assumption is supported by the XPCS measurements presented below which are in good agreement with theories assuming a hard sphere interaction potential. The batch solution had a measured volume fraction of = 0.327. Higher concentration suspensions were obtained using a centrifugation process, while lower concentration were prepared by adding more decalin solvent.
The sample cell consisted in a 1.5 mm diameter Kapton tube with wall thickness of 80 m. A syringe pump purchased from Harvard Apparatus connected through Teflon tubing and leak tight fittings purchased from Upchurch Scientific was used to fill the Kapton tube. This experimental setup has the advantage of allowing measurements under continuous flow as explored previously [20]. However, all the measurements reported here were performed on stationary, non flowing samples. Our results on the dynamics under continuous flow will be described in a subsequent publication. The flow option was only used to periodically renew the sample by bringing fresh particles into the beam. Through many repeated measurements it was found that flowing the samples introduces new time scales in the measured correlation functions [21, 22] that, in particular, can affect the long-time decays, even for a long time after the flow was stopped. As a consequence, a stabilization time was always allowed after renewing the samples or filling the flow cell.
In the high-dilution limit, hydrodynamic or direct interactions between the particles are negligible and the colloids undergo Brownian motion with a diffusion coefficient described by the Stokes-Einstein diffusion relationship
| (1) |
where is the viscosity and the hydrodynamic radius. was measured by DLS on samples with . It should be mentioned that with this sample concentration, it is impossible to perform XPCS measurements due to the weak scattering of X-rays. The DLS measurements were performed at several scattering angles and wavelengths of =532 nm and 633 nm. The time constants were obtained by fitting the correlation functions with simple exponentials, and the momentum transfer was calculated from the scattering angle using
| (2) |
Here =1.48 is the index of refraction of the solvent - decalin, a mixture of 50/50 cis- and trans-decalin as determined using the viscosity measurements described below [23, 24]. According to Fick’s law, the mean square displacement of Brownian particles from their position at =0 is with being the diffusion coefficient. In reciprocal space, this corresponds to a dependence of the correlation time , and a diffusion coefficient . As seen if figure 2 this quantity is independent of the scattering angle, leading to a diffusion coefficient for the PMMA particles in decalin of =9 Å2/s.

As a cross-check, was measured also for a second sample, consisting of the same PMMA particles suspended in pure cis-decalin, which has a nominal viscosity of 3.06 cP (at 24 ∘C, [23]). The results of the DLS measurements, are summarized in Table 1. The viscosity of the dilute suspensions was directly measured for both samples using a U-tube viscometer, hence allowing to determine from equation 1. The hydrodynamic radii measured in the two different solvents are equal within the error bars.
| solvent | (cP) | ||
|---|---|---|---|
| decalin | |||
| cis-decalin |
III Results
III.1 Static properties
SAXS measurements, performed at the ID10A beamlines (ESRF), were corrected for background scattering contributions from the solvent, the Kapton tubes of the sample environment, etc. The static data was fitted using the Percus–Yevick (PY) closure [25] for the structure factor , and a form factor for spherical particles obtained from the fits on the lower concentration suspensions. The expressions for and are calculated assuming a particle size polydispersity described by the Schultz distribution function [26]. In addition, the resulting form for the scattered intensity was convoluted with a Gaussian function describing the instrumental resolution. An example of the resulting fits for is shown in figure 3 for the sample. The same procedure was applied for all samples. The fitting parameters are the particle radius =89012 Å with a size distribution standard deviation =8911 Å, the volume fraction of each individual suspension, and an overall multiplicative factor measuring the scattering cross section of each sample which is not discussed here. On a subset of the samples, additional SAXS measurements were performed on the SAXS beamline ID02 at ESRF. The data measured on the two different instruments (ID10 and ID02) are in excellent agreement.

The PY SAXS analysis procedure described above provides a fitted form factor for the PMMA particles and a fitted structure factor for each of the suspensions. An “experimental structure” factor is not directly accessible from the data but, assuming that the decoupling approximation works well for the relatively monodiperse suspension of spherical particles studied here [27], a good estimate for it can be obtained by dividing the experimental scattered intensity with the fitted form factor,
| (3) |
The structure factors for several samples with different concentrations can be seen in figure 4, where the fitted (continuous lines) are shown together with the ones calculated form the experimental data points using equation 3. The fitted volume fraction is indicated on the graph for each of the individual samples. The agreement is very good for all concentrations and over the whole -range. We attribute the small discrepancies that appear in some of the fits to experimental artifacts such as parasitic scattering.

III.2 Dynamic behavior
The intensity fluctuation autocorrelation functions
| (4) |
where measured for wave vectors around the main peak in the structure factor in a range of 1.56.
Assuming a Gaussian distribution of the temporal fluctuations at a fixed , the normalized dynamic structure factor, or intermediate scattering function (ISF),
| (5) |
is related to the intensity autocorrelation functions via the Siegert relationship,
| (6) |
Here, is the optical contrast, which depends on the transverse coherence lengths of the X-ray source and the sample, and on geometrical parameters such as the pinhole size and the detector slit opening. In the experiments described here, the contrast was around 2-5%.
In low concentration samples, the ISF measured at a wave vector is a simple exponential decay, with the relaxation rate depending on the single particle diffusion coefficient and
| (7) |
For higher concentration suspensions, both direct interactions (DI) acting via the hard-sphere interparticle potential and hydrodynamic interactions (HI) between colloids mediated by the solvent start playing an increasingly important role, slowing down the diffusive dynamics of the particles. While the quasi-instantaneous HI between particles are related to the structure factor they do not, themselves, determine the equilibrium static structure, nor do they shift the glass transition concentration (see e.g. [28]). However, the effects of the HI are very important, even at relatively low volume fraction as they slow down considerably the short-time relaxations. Our XPCS results on this complex many-body process are shown in the following sections.
III.2.1 Short-time dynamics and Hydrodynamic Interactions
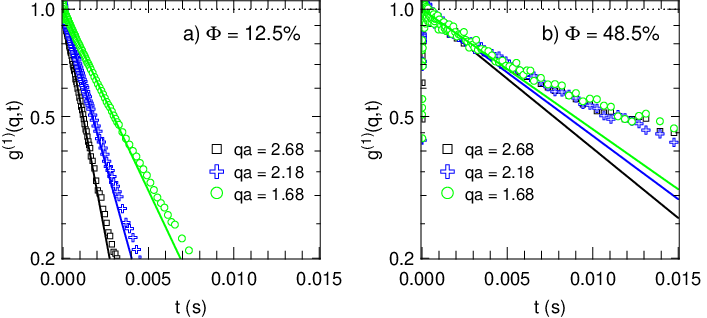
An important time scale arising in dense colloidal suspensions is the short time limit . This is usually associated with the random motion of individual particles in cages formed by neighboring particles. For the diffusive motion is slowed down by both HI and DI between the particles. At , the motion is still diffusive but faster, as it is slowed down only by HI and not yet by DI. This effect can be clearly seen in figure 5. The ISFs are plotted here for three different values of and two different samples - a low-concentration one, =12.5 %, and a high concentration one - =48.5 %.
While the low concentration sample shows single exponential decays, in the high concentration samples two distinct relaxation rates are observed. On the semi-logarithmic scale used in figure 5, the exponential ISFs appear as straight lines, with the relaxation rates measured by their slopes. A short-time of 2 ms can be estimated from the change in slope obvious with the high concentration sample (but absent in the low concentration one). A physical interpretation of this time scale emerging in high density suspensions, was given by Segré, Behrend, and Pusey [5]. There, is the time required for a particle to diffuse away from the position at =0 to a distance equal to its radius. With our experimental parameters, this leads to ms. While this is within the same order of magnitude with the value observed experimentally, the agreement is clearly not very good. An obvious problem associated with this estimate for is associated with the fact that the free diffusion coefficient was used while the diffusion is known to be slowed down by HI. Replacing with a slower diffusion coefficient (e.g. - see discussion below) makes the disagreement between the experimentally observed and the calculated one even stronger. This is, however, not surprising, because the length scale over which the particles can move before being affected by DI should be dependent on the volume fraction, and is not necessarily equal to the particle radius. A different estimate of the short time can be achieved using an expression for the frequency of collisions derived from a theory by M. Smoluchowsky which is usually used to describe coagulation kinetics (although here we assume that coagulation is prevented by the steric stabilization of the particles). For a suspension of colloidal particles in a solvent of dynamics viscosity and a total volume , the rate of collisions is given by (see for e.g. [29, 30] and references therein),
| (8) |
With a particle radius , and volume fraction , this results in a time between collisions, identified here with of
| (9) |
For =48.5 %, and using the values of and from Table 1, equation 9 leads to a short time of ms. Since even on these short time scales the dynamics is considerably slowed down by HI the actual time is expected to be slower. Considering a factor of 10 for this slowing down, in agreement with data shown further below for the 48.5 % sample, a time scale of 5 ms can be estimated, which is in better agreement with the data in Figure 5.

In the short-time limit, the ISFs can be described in terms of a -dependent diffusion coefficient [4],
| (10) |
with the (short-time) diffusion coefficient given by,
| (11) |
Here, the hydrodynamic function describes the HI. In the high dilution limit, and , leading to . A non-unitary hydrodynamic function, is a hallmark of HI. The short–time diffusion coefficients were determined by a first cumulant analysis [31] in which the initial decay of the correlation function was fitted to an exponential form. The fits were performed in two stages. First, the correlation functions are fitted over the entire time range with a stretched exponential form,
| (12) |
to obtain accurate values for the experimental contrast and baseline (with for all the correlation functions). Subsequently, these parameters are being fixed in a second fit, performed only for the initial decays , with a simple exponential form,
| (13) |
where the -dependent short-time diffusion coefficient is the only free parameter. In these ergodic systems where the intensity fluctuations are well described by Gaussian statistics, equations 13 and 10 are equivalent.
The - expansion proposed by the BM theory [9] provides one of the most successful tools to date describing HI in dense but fluid colloidal suspensions. The only input parameter required is the static structure factor . The BM theory predictions were verified by XPCS in several different charge-stabilized suspensions with screened electrostatic interactions [17, 15]. In the case of sterically-stabilized suspensions, interacting via a hard-sphere potential, the predictions of BM theory where verified by the two-color DLS experiments described in [5]. One problem associated with using light scattering is that in general it is impossible to reach high enough values of the scattering vector to obtain accurate structural information, hence calculated values for (using the PY closure) are usually taken as input. In X-ray scattering experiments, access to down to a fraction of the colloidal length scale is straightforward so here the hydrodynamic functions were calculated from equation 11 using measured static and dynamic data. One of the problems encountered in XPCS experiments is that accurate dynamic data can only be obtained in relatively small -range (e.g. compared to DLS) because the signal-to-noise is often limited by the decreasing scattering cross section at high (or, equivalently, by a limited intensity of the coherent X-ray beam). The results for can be seen in figure 6 for a wide range of volume concentrations and a range of covering 2.14Å 6.44Å-1 (or 26). Experimental data measured at different concentrations are shown by the different symbols specified in the legend. Continuous lines show predictions of the - expansion with no adjustable parameters other than the corresponding volume fractions resulted from the fits. The agreement between theory and experiment is excellent for solutions with 0.4 which is well in line with the earlier observations in Ref. [5]. The - expansion employed in the calculation is expected to break down for suspensions at high volume fractions [9]. This is indeed confirmed by our data, which shows a clear overestimate of at =48.5 %.


Figure 7 shows the value of the Hydrodynamic function near the structure factor maximum as a function of the volume fraction. Within the - expansion, the -dependence of the peak value of for hard spheres with PY input for and is well parametrized by a quadratic form
| (14) |
represented by the continuous solid line in figure 7. The results are also compared with predictions of numerical calculations using the Accelerated Stokesian Dynamics (ASD) algorithm by Banchio et al. [32, 33] for the HI of hard spheres. Their numerical results predict a linear dependence of as a function of well approximated by
| (15) |
which is represented by the dashed straight line in figure 7. As it can be seen, the ASD numerical simulations provide good predictions over the entire range of concentrations and really excellent predictions above 0.4 where the - theory fails. This is in agreement with the results reported in [17] for charged-stabilized particles with screened electrostatic interactions.
The dynamic of fluctuations in suspensions with increasing volume fraction, is also expected the be well described by the Mode Coupling Theory (MCT) of the glass transition in hard-sphere colloids [34, 35]. In its lowest order in the separation parameter , the MCT predicts the existence of two divergent time scales describing the dynamics in different windows of time - the -relaxation at fast time scales and the -relaxation at slower time scales. The short-time diffusion coefficient corresponding to the fast -relaxation measured near follows a power scaling law,
| (16) |
This form is valid both in the liquid, (the systems probed here) or glass, states [34]. The fundamentally different -process, which is completely frozen in the glassy state, restores ergodicity in the high concentration liquid phase with a characteristic long-time diffusion coefficient following
| (17) |
The slow relaxation process in the high density fluids described here is analyzed in more detail in the following section. Here we investigate the scaling forms proposed by the MCT - equations 16, 17 - for the diverging short-time and long-time relaxations. The results can be seen in figure 8. For the low density suspensions, the diffusion coefficients obtained from single exponential fits are shown by the open black squares. The short-time diffusion coefficients obtained from the high density suspensions using the first-cumulant analysis described above are shown by the solid black squares. We also show additional data (solid black triangles) for the short time diffusion coefficient previously obtained by Zontone, Moussaïd et al. [36] in a very similar system - PMMA hard sphere particles suspended in cis-decalin. All the data follows well the scaling law predicted by the MCT and represented by the black continuous line in figure 8 with .
To date, there are fewer points available for the long-time diffusion coefficients. These are shown in figure 8 by the grey solid circles, which are also in good agreement with the MCT scaling form (grey dashed power law). The slow diffusion coefficients were obtained from the fits shown in figure 9, and described in the following section.
The experiments presented in this section provide further evidence for two important results on the dynamics in high density colloidal suspensions interacting with a hard-sphere potential:
i) At moderate concentrations (i.e. 40 %) the short time diffusion coefficients and HI are well described quantitatively by the BM theory. At higher concentrations, only the ASD numerical results by Banchio et al. provide accurate results.
ii) The MCT of the colloidal glass transition provides correct accurate quantitative predictions for both the short-time and the long-time diffusion coefficients in colloidal suspensions of higher concentrations ().
III.2.2 Long–time and short–time behavior


In this section we take advantage of the fact that both the short-time and long-time diffusion coefficients are readily available from the XPCS data, to test an approximate scaling law, first proposed by Segré and Pusey [37]. By using the aforementioned TCDLS technique, they evidenced a proportionality between the short- and long-time diffusion coefficients measured in concentrated suspensions with 0.46 and higher, over a broad range of values (excluding the smallest s). This proportionality results in a collapse on a single master curve of the entire intermediate scattering functions measured at different values when scaled by their short-time decays. This finding suggests that the structural relaxations of particles or “cages of particles” are both related to self-diffusion, which contradicts a MCT picture where the - and -relaxations have different physical origins. However, subsequent MCT results [28] provided a semi-quantitative argument for the approximate collapse of the ISFs on a single master curve at high-enough values of and low-enough values of time, where the non-diffusive character of the -relaxations is not very pronounced and the two modes hence follow similar decays. The MCT results also point to the fact that this scaling form is not expected to be valid in charge-stabilized suspensions due to the long-range repulsive nature of the potential. This was indeed observed experimentally in previous XPCS experiments by Lurio, Lumma, Mochrie et al. [13, 14]. Interestingly, a recent study by Martinez et al. [38] using XPCS and DLS did not manage to unambigously detect the long-time dynamics away from the peak of in high concentration suspensions of PMMA particles, and hence could not validate the Segré-Pusey scaling. However, their study, together with an earlier experiment by Riese et al. [16] provide a clear experimental proof of the equivalence between XPCS and DLS measurements.
The results presented here are obtained on a system very similar to that used by Segré and Pusey, or more recently by Martinez et al. [38], namely sterically stabilized PMMA uniform spheres (albeit about 1/2 the size), and by use of XPCS. As pointed out before, with the smaller particles, the higher concentration suspensions show clearly two different relaxation time scales within the time and length scales accessible in the XPCS experiments. In order to extract them from the experimental data, the ISFs are fitted with double exponential decays
| (18) |
The fits for the two high concentration suspensions studied here with =41.3 % and =48.5 % can be seen in figure 9. From this procedure, both and , the short-time and long-time diffusion coefficients, associated with the MCT - and -relaxations, respectively, are readily available.
In order to test the Segré-Pusey scaling relationship between and , are plotted in figure 10 as a function of time like in the original reference [37]. These are the exactly the same correlation functions as shown in figure 9, except that the above scaling has been performed and a log-lin scale is used. As it can be seen, the correlation functions measured over more than two decades in time collapse on a single master curve, in agreement with the scaling proposed by Segré and Pusey. The insets in figure 10 show the ratios between the short- and the long-time diffusion coefficients at several values of . As expected according to the putative scaling behavior this ratio is a -independent constant within the experimental error bars.
We conclude that the Segré-Pusey scaling behavior is validated within the combination of length- and time scales accessed here, for dense colloidal suspensions with 40-50 % interacting via a hard-sphere potential.
IV Conclusions
In summary, we have used a combination of XPCS, SAXS and DLS data to measure the -dependent short time diffusion coefficients and the hydrodynamics interaction functions in dense colloidal suspensions with a hard-sphere interaction potential. Our results show good agreement with the BM analytical theory at moderate volume fractions (0.4). The XPCS data shows good agreement with the ASD numerical scheme proposed by Banchio et al. over the entire concentration range, and in particular above 40 % where the BM theory is less accurate.
The short time diffusion coefficients measured at different volume fractions scale with the separation parameter as predicted by the Mode Coupling Theory.
Finally, the XPCS results for the short-time and long-time dynamics in high density suspensions are in good agreement with the scaling relationship proposed by Segré and Pusey.
We wish to acknowledge the ESRF ID10 and ID02 beamlines for providing the beamtime, T. Narayanan for help with the ID02 SAXS experiments and A. Schofield for the sample preparation. The work at Brookhaven National Laboratory was performed under Contract No. DE-AC02-98CH10886 with the U.S. Department of Energy.
References
- [1] P. N. Pusey and W. van Megen, Nature 320, 340 (1986).
- [2] W. van Megen, R. H. Ottewill, S. M. Owens, and P. N. Pusey, The Journal of Chemical Physics 82, 508 (1985).
- [3] W. van Megen and P. N. Pusey, Phys. Rev. A 43, 5429 (1991).
- [4] P. N. Pusey, in Liquids, Freezing and Glass Transition, Les Houches Session LI, edited by J. P. Hansen, D. Levesque, and J. Zinn-Justin (Elsevier, Amsterdam, 1991), chap. 10, pp. 763–942.
- [5] P. N. Segrè, O. P. Behrend, and P. N. Pusey, Phys. Rev. E 52, 5070 (1995).
- [6] W. van Megen, T. C. Mortensen, S. R. Williams, and J. Müller, Phys. Rev. E 58, 6073 (1998).
- [7] P. N. Segré, W. van Megen, P. N. Pusey, K. Schätzel, and W. Peters, Journal of Modern Optics 42, 1929 (1995).
- [8] C. W. J. Beenakker and P. Mazur, Physica A: Statistical and Theoretical Physics 120, 388 (1983).
- [9] C. W. J. Beenakker and P. Mazur, Physica A: Statistical and Theoretical Physics 126, 349 (1984).
- [10] G. Grübel, A. Madsen, and A. Robert, in Soft-Matter Characterization, edited by R. Borsali and R. Pecora (Springer, 2008), chap. 18, pp. 953–995.
- [11] M. Sutton, Comptes Rendus Physique 9, 657 (2008), ISSN 1631-0705, synchrotron x-rays and condensed matter.
- [12] F. Livet, Acta Crystallographica Section A 63, 87 (2007).
- [13] L. B. Lurio, D. Lumma, A. R. Sandy, M. A. Borthwick, P. Falus, S. G. J. Mochrie, J. F. Pelletier, M. Sutton, L. Regan, A. Malik, et al., Phys. Rev. Lett. 84, 785 (2000).
- [14] D. Lumma, L. B. Lurio, M. A. Borthwick, P. Falus, and S. G. J. Mochrie, Phys. Rev. E 62, 8258 (2000).
- [15] A. Robert, J. Wagner, W. Härtl, T. Autenrieth, and G. Grübel, The European Physical Journal E - Soft Matter 25, 77 (2008).
- [16] D. O. Riese, G. H. Wegdam, W. L. Vos, R. Sprik, D. Fenistein, J. H. H. Bongaerts, and G. Grübel, Phys. Rev. Lett. 85, 5460 (2000).
- [17] A. J. Banchio, J. Gapinski, A. Patkowski, W. Haussler, A. Fluerasu, S. Sacanna, P. Holmqvist, G. Meier, M. P. Lettinga, and G. Nägele, Phys. Rev. Lett. 96, 138303 (2006).
- [18] R. Kemp, R. Sanchez, K. J. Mutch, and P. Bartlett, Langmuir 26, 6967 (2010).
- [19] R. Besseling, L. Isa, E. R. Weeks, and W. C. K. Poon, Advances in Colloid and Interface Science 146, 1 (2009), ISSN 0001-8686.
- [20] A. Fluerasu, P. Kwasniewski, C. Caronna, F. Destremaut, J.-B. Salmon, and A. Madsen, New Journal of Physics 12, 035023 (2010).
- [21] A. Fluerasu, A. Moussaid, P. Falus, H. Gleyzolle, and A. Madsen, Journal of Synchrotron Radiation 15, 378 (2008).
- [22] S. Busch, T. Jensen, Y. Chushkin, and A. Fluerasu, The European Physical Journal E - Soft Matter 26, 55 (2008).
- [23] W. Seyer and J. Leslie, J. Am. Chem. Soc. 64, 1912 (1942).
- [24] W. F. Seyer and R. D. Walker, J. Am. Chem. Soc. 60, 2125 (1938).
- [25] W. L. Griffith, R. Triolo, and A. L. Compere, Phys. Rev. A 33, 2197 (1986).
- [26] M. Kotlarchyk and S.-H. Chen, The Journal of Chemical Physics 79, 2461 (1983).
- [27] J. S. Pedersen, Advances in Colloid and Interface Science 70, 171 (1997), ISSN 0001-8686.
- [28] M. Fuchs and M. R. Mayr, Phys. Rev. E 60, 5742 (1999).
- [29] H. Holthoff, S. U. Egelhaaf, M. Borkovec, P. Schurtenberger, and H. Sticher, Langmuir 12, 5541 (1996).
- [30] M. Y. Lin, H. M. Lindsay, D. A. Weitz, R. Klein, R. C. Ball, and P. Meakin, Journal of Physics: Condensed Matter 2, 3093 (1990).
- [31] P. N. Segrè and P. N. Pusey, Physica A235, 9 (1997).
- [32] A. J. Banchio and G. Nagele, J. Chem. Phys. 128, 104903 (2008).
- [33] A. J. Banchio, G. Nagele, and J. Bergenholtz, The Journal of Chemical Physics 111, 8721 (1999).
- [34] W. Götze and L. Sjögren, Phys. Rev. A 43, 5442 (1991).
- [35] W. van Megen, Phys. Rev. E 76, 061401 (2007).
- [36] F. Zontone, A. Moussaïd, et al. (2008), unpublished.
- [37] P. N. Segrè and P. N. Pusey, Phys. Rev. Lett. 77, 771 (1996).
- [38] V. A. Martinez, J. H. J. Thijssen, F. Zontone, W. v. Megen, and G. Bryant, The Journal of Chemical Physics 134, 054505 (pages 9) (2011).