Isotope Shifts of the D- P Transition in Trapped Short-Lived 209-214Ra+
Abstract
Laser spectroscopy of short-lived radium isotopes in a linear Paul trap has been performed. The isotope shifts of the D- P transition in 209-214Ra+ were measured, which are sensitive to the short range part of the atomic wavefunctions. The results are essential experimental input for improving the precision of atomic structure calculation. This is indispensable for parity violation in Ra+ aiming at the determination of the weak mixing angle.
Keywords:
Isotope shift, Ra+, laser spectroscopy, atomic parity violation, hyperfine structurepacs
32.30.Bv, 11.30.Er, 31.30.Gs, 32.10.FnA measurement of the isotope shifts of the D- P transition in a series of trapped, short-lived radium isotopes 209-214Ra+ with nuclear spins of I = 0, 1/2 and 5/2 is reported. The shifts are complementary to previously measured isotope shifts in this system [1, 2, *giricjp2011]. They are sensitive to the short range behavior of the atomic wavefunctions. Of particular importance are the S ground state and the metastable D state in connection with a planned measurement of atomic parity violation (APV) using a single trapped radium ion. The information from optical isotope shift measurements are indispensable to improve atomic structure calculations [4, 5, 6, 7, *versolatocjp2011] and their contributions to APV effects.
The concept for an APV experiment based on a single ion has been worked out for Ba+ [9, 10, *koerberjpb03]. However, the relative strength of the APV signal is 20 times larger for Ra+ [7] and an experiment to exploit this enhancement is currently developed within the TRIP research program at KVI. The experiment aims at a 5 fold improved measurement of the weak mixing angle over the sole best APV result in atomic ceasium [12, 13, 14, 15].
The radium isotopes 212-214Ra are produced at the TRIP facility in inverse kinematics by the fusion and evaporation reaction 206Pb + 12C (218-x)Ra + n, where is the number of evaporated neutrons [16]. A 204Pb beam is used for the production of 209-211Ra. The half lives (T1/2) of the isotopes are 4.6(2) s for 209Ra, 3.7(2) s for 210Ra, 13(2) s for 211Ra, 13.0(2) s for 212Ra, 163.8(3.0) s for 213Ra, and 2.46(3) s for 214Ra [17]. The Ra isotopes are separated from the primary beam and other reaction products in a double magnetic separator [18]. Subsequently they are stopped in a Thermal Ionizer (TI) consisting of a stack of 0.75 m thick tungsten foils in a 2500 K hot tungsten cavity [19, *Traykov20084478], and ionized on the hot surfaces. They are electrostatically extracted as a singly charged Ra+ beam with an efficiency 8% [16]. A Wien filter in the ion transport system suppresses other ion species from the TI. The Ra+ beam is injected into a gas-filled Radio Frequency Quadrupole (RFQ) cooler. The segmented linear quadrupole with an electrode tip spacing of 5 mm is operated as a trap by applying suitable potentials to the segments along the axis of the RFQ. An RF amplitude of 190 V at 500 kHz between the opposite electrodes yields an effective potential depth of 13 V. An axial potential depth of 10 V is chosen for optimal trapping efficiency. The ions are thermalized by Ne buffer gas with a pressure of 1-5 10-2 mbar. The typical number of ions in the trap is about 1000 for 212Ra+.

Laser spectroscopy is performed by driving optical transitions at wavelengths and (Fig. 1). Light from two extended cavity diode lasers at wavelength is overlapped and transported to the ion trap in a single mode optical fiber. A separate single mode optical fiber transports light from an extended cavity diode laser at wavelength to the trap. The laser beams at different wavelength are overlapped on a dichroic mirror and aligned along the axis of the trap in order to minimize stray light. Typical laser intensities at the trap center are 200 W/mm2() and 600 W/mm2 (). The transitions are detected by fluorescence at wavelength by an imaging lens system and a photo multiplier tube. A low-pass filter with 80% transmission for wavelengths shorter than 500 nm suppresses unwanted stray light. The setup is shown in Fig. 2.

The wavelengths of the lasers are monitored by two commercial wavelength meters with an absolute frequency uncertainty of 50 MHz. This was achieved by calibrating them against the molecular iodine I2 reference line R116(2-9)a15 at = 419,686,834(3) MHz employing saturated absorption spectroscopy [21]. The laser at wavelength is stabilized to a fraction of the Doppler broadened linewidth of about 300 MHz (FWHM) while the frequency of the laser at is determined with the help of an optical frequency comb. The latter is achieved by employing an auxiliary laser at wavelength , which is referenced against the frequency comb by a beatnote = , where is the frequency of auxiliary laser and is the frequency of the comb line. The signal-to-noise ratio of the beatnote is typically 40 dB with 1 MHz bandwidth. The frequency of the laser which drives the D- P transition is determined by the beatnote frequency = with the auxiliary laser, yielding
| (1) |
Here, is the mode number, = 250,041,000 Hz is the repetition rate and =20,000,000 Hz is the carrier-envelope-offset frequency of the comb. The accuracy of the frequency comb is derived from a GPS stabilized Rb clock to be better than 10-11 which is not limiting the precision of the results presented in this paper. The sign of is either positive or negative depending on the detuning of the scanning laser with respect to the auxiliary laser. The course determination of the frequency with the calibrated wavelength meter yields a mode number = 1111032. The uncertainty is only a fraction (0.2) of one mode spacing due to the calibration accuracy of the wavelength meter. This results in the frequency of the comb line = 277,803,572.31(3) MHz, where the uncertainty arises from the Rb clock.
| 210Ra+ | 212Ra+ | 214Ra+ | |
|---|---|---|---|
| D- P | 200(11) | 1059(2) | 2084(11) |
| D- P | 209Ra+ | 211Ra+ | 213Ra+ |
|---|---|---|---|
| F=4F=3 | 455(30) | 1363(3) | - |
| F=3F=3 | 1130(58) | 2049(10) | - |
| F=2F=3 | 1527(68) | 2456(12) | - |
| F=1F=0 | - | - | 1356(2) |


In the experiment it is sufficient to drive the transitions by one laser at the pump wavelength and one at the repump wavelength for isotopes with I=0. For isotopes with I0, both hyperfine ground states are pumped simultaneously by individual lasers, since the hyperfine splitting of S state of 15-25 GHz is much larger than the observed linewidth. The S- P transition is continuously driven. The excited P state decays into D state with branching ratio of about 1 in 10. The D state decays into the ground state by radiative decay and collision induced transitions which depend on the type of buffer gas and its pressure [22]. This is much slower than the resonant laser driven transfer to the ground state. Furthermore, the buffer gas provides mixing of the hyperfine states, which prevents optical pumping to a dark state. The repump transition is driven by a single laser, since the hyperfine splitting of D state is less than a GHz. To obtain a good signal-to-noise ratio, many scans over the resonances are averaged. A set of D hyperfine states can be populated by selecting S- P hyperfine transitions. The D(F=1) state in 213Ra+(I=1/2) is populated by choosing the S(F=1) - P(F=0) transition, thereby forming a closed cycle. The D(F=2,3,4) states in 209,211Ra+(I=5/2) are populated by selectively pumping via the P(F=3) state. The observed transitions have been calibrated to a common frequency axis (Fig. 3a to 3c). The position of each transition is determined by fitting the data with Gaussian profiles. The measured transitions frequencies are listed in Table 1 and 2. The quoted uncertainties are limited by the statistical precision of the data. The uncertainties due to possible systematic effects such as residual Doppler shifts, pressures shifts, lifetimes, and laser linewidths have been estimated to be on the level of 1 MHz, which is very small compared to the statistical uncertainties.
The isotope shift of a spectral line is commonly parameterized as [23]
| (2) |
where . M and M are the masses of the reference isotope and the isotope of interest respectively, both in atomic mass units. and are the normal and specific mass shift components and is the field shift component. is the difference in mean square nuclear charge radii, which is common to all transitions for a pair of nuclei. Both the specific mass shift and the field shift are characteristic to a particular transition. Here they are defined as the shift of the lower level, minus the shift of the upper level. The normal mass shift can be calculated from the expression , where is the transition frequency and is the mass of electron in atomic mass units.
A King plot analysis [24] is used to separate the specific mass shift and the field shift components. Here the transformed isotope shifts () are used, which are obtained by subtracting the normal mass shift component from the experimentally measured isotope shifts and multiplying both sides of Eq. (2) by . Eq. (2) is rewritten as
| (3a) | ||||
| (3b) | ||||
In a comparison between two different optical transitions and , the transformed isotope shifts can be written as
| (4) |
This is essentially a linear relation of the transformed isotope shifts of one transition () against the corresponding shifts of the other transition (). The slope yields the ratio of field shifts and the difference in specific mass shifts appears as the crossing with the abscissa.
214Ra+ has been chosen as the reference isotope in order to be consistent with previous work [1]. The difference in transition frequencies for the even isotopes yields directly the isotope shift. For 209,211,213Ra+(I0) the isotope shifts are given between the centers of gravity of the D and P states. This requires the magnetic dipole and the electric quadrupole hyperfine constants for those states (Table 3). For the D state, the hyperfine constants have been derived from measured hyperfine intervals [2, 25]. The hyperfine constants for the P state are taken from [1]. For the case of 209Ra+ no value has been reported. It is derived with the nuclear magnetic moments [26] using
| (5) |
The measured isotope shifts for all the even and odd isotopes (209-214Ra+) and the relevant hyperfine constants for the D and P states in case of isotopes with I0 are given in Table 3.
| Mass | A(D) | B(D) | A(P) | |
|---|---|---|---|---|
| Number | MHz | MHz | MHz | MHz |
| 214 | - | - | - | 0 |
| 213 | 528(5) [2] | - | 4525(5) [1] | 707(14) |
| 212 | - | - | - | 1025(12) |
| 211 | 151(2) [25] | 103(6) [25] | 1299.7(0.8) [1] | 1755(14) |
| 210 | - | - | - | 1884(16) |
| 209 | 148(10) [25] | 104(38) [25] | 1276(20)11 1 Calculated using Eq. 5 | 2645(56) |
A King plot of the transformed isotope shifts of the measured D- P transition against the corresponding shifts of the S- P transition in neutral radium [1] is shown in Fig. 4. The values for the atomic masses of the isotopes are taken from [27]. The normal mass shift coefficient of the D- P transition in ionic radium is = 152.4 GHz amu. For the S- P transition in neutral radium, the normal mass shift coefficient is = 340.8 GHz amu. Plotting the transformed isotope shifts against each other show that the data satisfies a linear relation within the measurement uncertainties (Fig. 4). The slope determines the ratio of field shift coefficients, = 0.342(15). The abscissa determines the difference of the specific mass shift to be 1.9(1.1) THz amu.
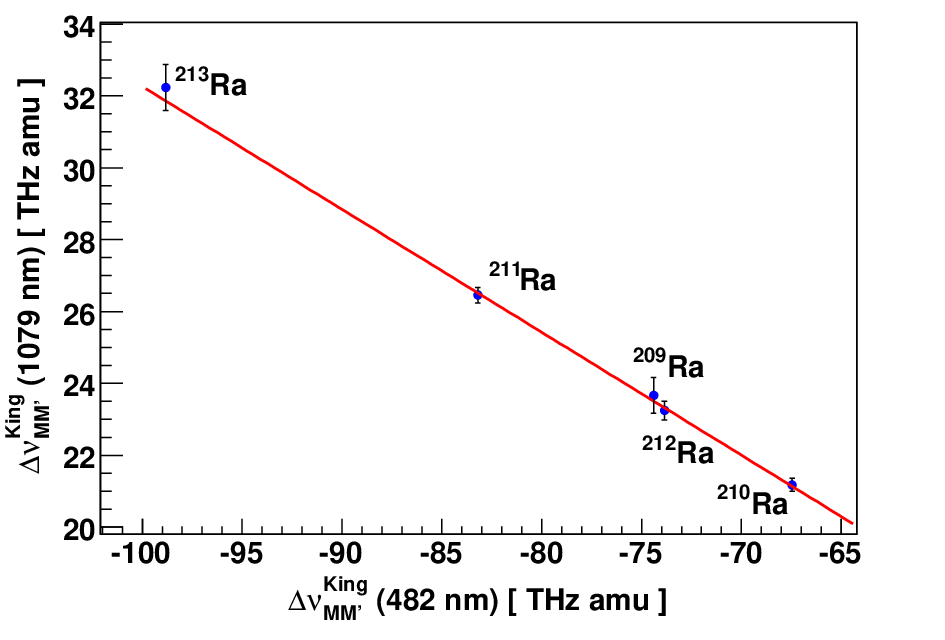
In summary, online laser spectroscopy has been performed using a range of trapped, short-lived radium isotopes 209-214Ra+. Isotope shifts of D- P transition have been determined. A comparison between these isotope shifts with another optical transition is made using a King plot analysis. This yields the ratio of the field shifts and difference in the specific mass shifts between the two transitions. This provides a test of the atomic theory of Ra+ at the few percent level, in particular of the D states which are relevant for an APV measurement.
The authors would like to acknowledge support from KVI technical staff. O. Dermois and L. Huisman have contributed significantly for design and set up of the experiment. This research was supported by the Nederlandse Organisatie voor Wetenschappelijk Onderzoek (NWO) and the Stichting voor Fundamental Onderzoek der Materie (FOM) under program 114 ( TRIP ) and FOM projectruimte 06PR2499.
References
- [1] K. Wendt et al., Z. Phys. D 4, 227 (1987).
- [2] O. O. Versolato et al., Phys. Rev. A 82, 010501(R) (2010).
- [3] G. S. Giri et al., Can. J. Phys. 89, 69 (2011).
- [4] V. A. Dzuba, V. V. Flambaum, and J. S. M. Ginges, Phys. Rev. A 63, 062101 (2001).
- [5] R. Pal, D. Jiang, M. S. Safronova, and U. I. Safronova, Phy. Rev. A 79, 062505 (2009).
- [6] B. K. Sahoo et al., Phys. Rev. A 76, 040504(R) (2007).
- [7] L. W. Wansbeek et al., Phys. Rev. A 78, 050501(R) (2008).
- [8] O. O. Versolato et al., Can. J. Phys. 89, 65 (2011a).
- [9] N. Fortson, Phys. Rev. Lett. 70, 2383 (1993).
- [10] J. A. Sherman, A. Andalkar, W. Nagourney, and E. N. Fortson, Phys. Rev. A 78, 052514 (2008).
- [11] T. W. Koerber, M. Schacht, W. Nagourney, and E. N. Fortson, J. Phys. B 36, 637 (2003).
- [12] C. S. Wood et al., Science 275, 1759 (1997).
- [13] S. C. Bennett and C. E. Wieman, Phys. Rev. Lett. 82, 2484 (1999).
- [14] S. G. Porsev, K. Beloy, and A. Derevianko, Phys. Rev. Lett. 102, 181601 (2009).
- [15] M. A. Bouchiat, J. Guena, L. Hunter, and L. Pottier, Phys. Lett. B 117, 358 (1982).
- [16] P. D. Shidling et al., Nucl. Instr. Meth. A 606, 305 (2009).
- [17] Chart of Nuclides, National Nuclear Data Center, Brookhaven National Laboratory, http://www.nndc.bnl.gov/chart/.
- [18] G. P. A. Berg et al., Nucl. Instr. Meth. A 560, 169 (2006).
- [19] P. D. Shidling et al., Nucl. Instr. Meth. A 622, 11 (2010).
- [20] E. Traykov et al., Nucl. Instr. Meth. B 266, 4478 (2008).
- [21] U. Dammalapati, S. De, K. Jungmann, and L. Willmann, Eur. Phys. J. D 53, 1 (2009).
- [22] A. Hermanni and G. Werth, Z. Phys. D 11, 301 (1989).
- [23] A.-M. MårtenssonPendrill and A. Ynnerman, J. Phys. B 25, 551 (1992).
- [24] W. H. King, J. Opt. Soc. Am. 53, 638 (1963).
- [25] O. O. Versolato et al., In preparation (2011b).
- [26] E. Arnold et al., Phys. Rev. Lett. 59, 771 (1987).
- [27] Atomic Weights and Isotopic Compositions, NIST Standard Reference Database 144, http://www.nist.gov/pml/data/comp.cfm.