Optimizing the energy threshold of light detectors coupled to luminescent bolometers
Abstract
Bolometers have proven to be good detectors for the search of neutrinoless double beta decay. By operating at cryogenic temperatures, they feature excellent energy resolution and low background. The detection of the possible light emitted when particles interact in the bolometer is a promising method to lower the background of the experiments. The different amount of light emitted in and interactions, whether due to scintillation or Cerenkov emission, allows to discriminate the two interaction types. Because of the cryogenic environment, light detectors are often bolometers. In this work we present a software algorithm to lower the energy threshold of bolometric light detectors coupled to luminescent bolometers. The application to data from Ge light detectors coupled to ZnMoO4 and TeO2 bolometers shows that the energy threshold can be lowered substantially, increasing the discrimination power when the amount of emitted light is small.
keywords
Bolometer, Neutrinoless double beta decay, Data analysis1 Introduction
Bolometers are detectors in which the energy from particle interactions is converted to heat and measured via their rise in temperature. They provide excellent energy resolution, though their response is slow compared to electronic or photonic detectors. They are used in particle physics experiments searching for rare processes, such as neutrinoless double beta decay (0DBD) and dark matter (DM) interactions.
The CUORE experiment will search for 0DBD of [1, 2] using an array of 988 bolometers of 750 each. Operated at a temperature of about 10, these detectors maintain an energy resolution of a few keV over their energy range, extending from a few keV up to several MeV. The measured resolution at the Q–value of the decay ( [3]) is about 5; this, together with the low background and the high mass of the experiment, determines the sensitivity to the 0DBD.
To further increase the sensitivity, an intense R&D is being pursued to lower the background in the 0DBD region. The main source of background is due to particles, coming from radioactive contaminations of the materials facing the bolometers. The natural way to discriminate this background is to use a scintillating bolometer [4]. In such a device the simultaneous and independent read out of the heat and the scintillation light permits to discriminate events due to and interactions thanks to their different scintillation yield. Unfortunately is not a scintillator, and different crystals are being studied. Some of them are CdWO4 (0DBD candidate 116Cd, ) [5], ZnSe (87Se, ) [6], and (100Mo, ) [7].
To detect light the scintillating crystal is faced to a high sensitivity dark bolometer [8]. It usually consists in a germanium or silicon slab that absorbs the scintillation photons giving rise to a measurable increase of its temperature. The energy threshold of these devices plays an important role in the identification of and interactions. , for example, is a promising candidate [9] even though the scintillation yield is one of the smallest among the tested crystals. In a 30 bolometer, in fact, only about 1 keV of light is emitted per MeV of particle energy by ’s, and about a tenth by ’s. Currently the energy threshold of light detectors is around 300 eV, so that interactions cannot be completely studied at 3 MeV, where the 0DBD signal is expected. Moreover increasing the mass of the bolometer to the kg scale, as needed by a CUORE like experiment, could substantially reduce the scintillation yield, reducing the separation between ’s and ’s.
In this paper we present a software algorithm that lowers the threshold of the light detectors. The application to data from a bolometer shows substantial improvements. The algorithm was also applied to a bolometer coupled to a bolometric light detector. Thanks to this work, light, probably due to Cerenkov emission, has been detected for the first time, opening the possibility of rejecting the background in a experiment [10].
2 Experimental setup
The data presented in this paper come from a crystal and a one, operated as bolometers in the Gran Sasso National Laboratories in Italy (LNGS), in the CUORE R&D facility [11, 12, 13].
The crystal weighed 29.9 and was a parallelepiped of dimensions . The light detector (LD) consisted of a 36 mm diameter 1 mm thick pure Ge crystal, covered with a 600 layer of SiO2 to ensure good light absorption. A reflecting foil (3M VM2002) was placed around the crystal to enhance the light collection.
The crystal weighed 116.7 and was a parallelepiped of dimensions . The crystal was doped with natural samarium (see details in Ref. [14]), which contains 15% of 147Sm, a long living isotope (T1/2 = 1.071011 y [15]) which undergoes decay with a Q–value of 23101 keV. This decay allows a direct analysis of the behavior of ’s in an energy region close to the 0DBD. As for the , the crystal was surrounded by a reflecting foil. The light was detected with a pure Ge bolometer larger than the one faced to the , its dimensions being 66 mm diameter and 1 mm thickness.
The temperature sensor of the crystal was a Neutron Transmutation Doped (NTD) germanium thermistors [16, 17] of 31.50.4 mm3, thermally coupled to the crystal surface by means of 6 epoxy glue spots of about 0.6 mm diameter and 50 m height. For the the NTD-Ge thermistor had dimensions 31 mm3, and was glued with 9 glue spots. Each LD was equipped with two NTD-Ge thermistors of 31.50.4 mm3. The and crystals and the LDs were held in a copper structure by Teflon (PTFE) supports, thermally coupled to the mixing chamber of a dilution refrigerator which kept the system at a temperature of about 13 mK.
The read–out of the thermistors was performed via a cold pre–amplifier stage, located inside the cryostat, and a second amplification stage, located on the top of the cryostat at room temperature. After the second stage, the signals were filtered by means of an anti-aliasing 6-pole active Bessel filter (120 db/decade), and then fed into a NI PXI-6284 analog-to-digital converter (ADC) operating at a sampling frequency of 2 kHz.
The trigger was software generated on each bolometer. When it fired, waveforms 0.6 s long on the and 2 s long on were saved on disk. The length of the window acquired from the LDs was equal to that of the crystal they faced. If the trigger fired on the or on the , waveforms from the corresponding LD were anyhow saved, irrespective of their trigger. To maximize the signal to noise ratio, waveforms were processed offline with the optimum filter algorithm [18, 19].
The main parameters of the bolometers are reported in Tab. 1. The rise and decay times of the pulses are computed as the time difference between the 10% and the 90% of the leading edge, and the time difference between the 90% and 30% of the trailing edge, respectively. The intrinsic energy resolution of the detector is evaluated from the fluctuation of the detector noise, after the application of the optimum filter.
| [V/MeV] | [keV RMS] | [ms] | [ms] | |
|---|---|---|---|---|
| 321 | 0.5 | 8 | 33 | |
| Ge () | 1.7103 | 0.07 | 4 | 11 |
| 43 | 1.31 | 15 | 116 | |
| Ge () | 2.3103 | 0.10 | 3 | 10 |
To perform the energy calibration and to provide statistics to the sample the detectors were exposed to a 232Th source. The source generates ’s with energy up to 2615, the energy of a -ray from 208Tl. The , together with the 2.3 MeV line from 147Sm, also featured a contamination in 210Po, which undergoes decay with a Q–value of 5.4 MeV. To evaluate the discrimination between ’s and ’s over a wide energy range, a smeared -source was faced to the crystal. The source consisted in 1 of a 0.1% 238U liquid solution, covered with a 6 mylar foil to absorb part of the ’s energy and produce a continuum spectrum in the range 1-4. As in the case, an population at 5.4 MeV from 210Po contamination is visible in the energy spectrum. The LDs were permanently exposed to a 55Fe source, placed on the LD surface opposite to the crystal. The source produces two X-rays at 5.9 and 6.5 keV, which are used for the absolute calibration of the bolometer.
3 Data analysis
As said in the previous section, waveforms acquired by the ADC are processed with the optimum filter. This filter maximizes the signal to noise ratio and improves the energy resolution and the energy threshold of this kind of bolometric detectors (see for example Refs. [20, 21]). The transfer function is built using the signal shape and the noise power spectrum :
| (1) |
where is a normalization constant, is the Fourier transform of and is a parameter to adjust the delay of the filter. The signal shape is estimated by averaging a large number of triggered pulses. On the and bolometers the pulses are selected in the high range of the energy spectrum (), on the LDs the pulses are selected from the peaks of the source. The noise power spectrum is estimated by averaging the power spectra of a large number of waveforms not containing pulses.
Once the waveforms are filtered, the amplitude of a signal is estimated as the maximum of the filtered pulse. As said before, when the trigger fires on a heat bolometer, the waveform from the corresponding LD is acquired. The amplitude of the light signal is estimated, also in this case, as the maximum of the filtered waveform. Signal amplitudes are then corrected for temperature and gain instabilities of the setup [22] and calibrated in energy.
Figure 1 shows two pulses triggered on the bolometer and the corresponding waveforms acquired from the light detector. The pulse on the left is generated by a 2615 -ray interaction, which also induces a visible pulse on the light detector. The pulse on the right is generated by an interaction of a 200 particle ( or ) which, given the low amount of scintillation light produced at this energy, does not induce a clear pulse on the light detector. While in the first case the maximum of the filtered waveform results in a correct estimation of the light signal amplitude, in the second case the maximum could be a fluctuation of the noise, rather than the amplitude of the signal. Therefore, when the amount of emitted light is at the level of the noise or below, the estimation of the signal amplitude with a maximum search algorithm may produce wrong results.


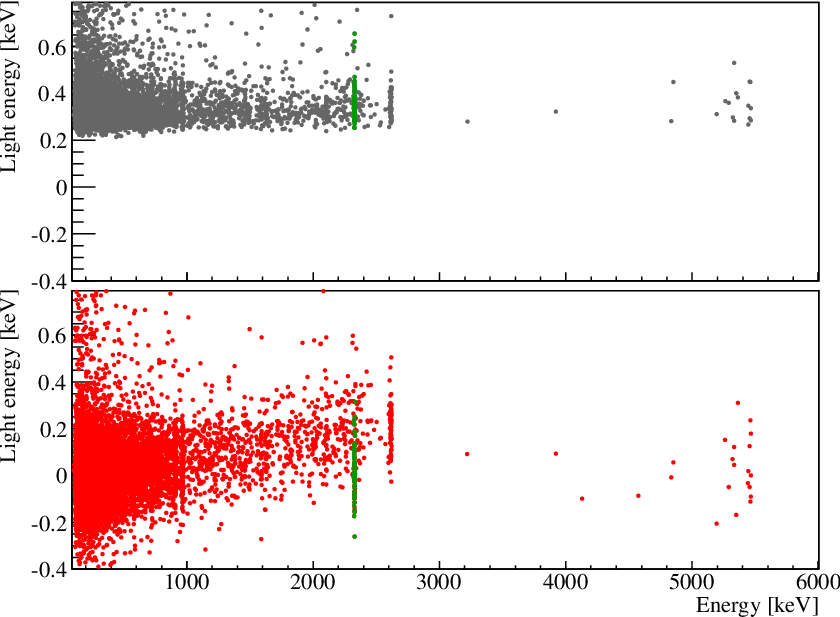
This effect is visible in the distribution of the light detected versus particle energy (Fig. 2). At high energies the light emitted from interactions is proportional to the particle energy. At low energies, below 300, the detected light reaches a constant value at about 250, which is the noise pedestal. This effect is also visible at higher energies, in the interaction of particles which produces less scintillation light than ones. In this case the pedestal is reached when the particle energy is below 3. As it will be shown in Sec. 4.2 the case is even more dramatic. The amount of emitted light is so small that the noise pedestal is measured for all particle energies, irrespective of their or nature.
4 Lowering the energy threshold
The bolometers used in this work are detectors that respond in milliseconds, a time orders of magnitude larger than the process of light emission. Therefore the energy releases into the heat (HD) and light (LD) detectors can be considered synchronous. The time delay between the two signals depends only on the differences between the thermal responses and the readout circuits of the two bolometers, and hence is fixed.
The basic idea of this work is to estimate the amplitude of the signal contained in the LD waveform as the value of the filtered waveform at a fixed time delay with respect to the position of the maximum in the HD waveform.
The time delay can be estimated from a set of events in which the energy released on both bolometers is much higher than the noise. In this case the maximum search algorithm does not fail on the LD, and the time difference between the maximum positions of the signals on the two bolometers is a good estimator of the delay. Taking the as example, the time delay is estimated from events generated by high energy ’s, like the one in Fig. 1 left. Then, instead of looking for a maximum in the LD filtered waveform, the amplitude value found at the estimated time delay with respect to the maximum position in the HD is used.
4.1 Application to the bolometer
The time delay is estimated selecting the events in Fig. 2 with energy in the range 1000-2650 and light energy in the range 1.0-2.5. The distribution of the time difference between the maximum positions of the signals in the and in the LD is shown in Fig. 3. The time delay is not known a priori, so a wide range of time intervals is allowed in the software algorithm. The average of the distribution is at -9, a value which is expected to be negative, since LDs responds faster than HDs (see the rise times of the bolometers in Tab. 1).
In the wide range of times allowed, spurious events lying off the distribution core may occur. We chose to estimate the time delay as the mode of the distribution, which is an estimator resilient to outliers. The average or a Gaussian fit, in fact, are not resilient to outliers, and may produce incorrect results when implemented in automatic software routines. In the case the mode coincides with the average, because there is only one outlier. As it will be shown in the next section, the outliers in the distribution are many and spoil the distribution.

We applied our method to the same waveforms used to produce the scatter plot in Fig. 2, and we show the comparison in Fig. 4. While at high energies the two methods produces compatible results, when the energy goes below 300 the light energy estimated with the new method goes below the noise pedestal and is statistically zero for zero energy released in the HD. The same behaviour is visible on particles.
Bolometers are nonlinear detectors [23], implying that the shape of the signal depends on the energy released. The time delay depends on both the energies released in the HD and in the LD, and in principle the same value cannot be applied to the entire range of energies. We checked this and we observed that the variation of the time delay is small and produces negligible changes in the estimation of the LD amplitude.
The reader should have noticed that the light energy estimated with the new method can take negative values. At a first glance this may seem odd, but it is not. Bolometers are thermal detectors. Fluctuations of the detector baseline corresponds to temperature variations, which may by positive or negative. When the signal is smaller than the noise or null, the estimated energy can be positive or negative as well.
To quantify the improvements reached with the application of our method to the bolometer, we study the threshold of the LD using the events produced by very low energy particles (events with in Fig. 4). In these events the light emitted is negligible, and the energy measured by the LD is dominated by the noise, which sets the ultimate energy threshold. From the distributions shown in Fig. 5 we observe that the light energy measured with the maximum search algorithm has an asymmetric shape, while the energy measured with the new method has a Gaussian shape. The of the noise Gaussian, estimated by means of a fit, is found to be compatible with the intrinsic resolution of the light detector. The 50% of the noise events is below 249 using the old method and below 19 using the new method. The 90% is below 382 using the old method and below 125 using the new method.

4.2 Application to the bolometer
The time delay cannot be estimated for the as in the case of , since, as shown in Fig. 6 (top), the maximum search algorithm clearly fails to find the signal in the LD. The noise pedestal is measured for all particle energies.
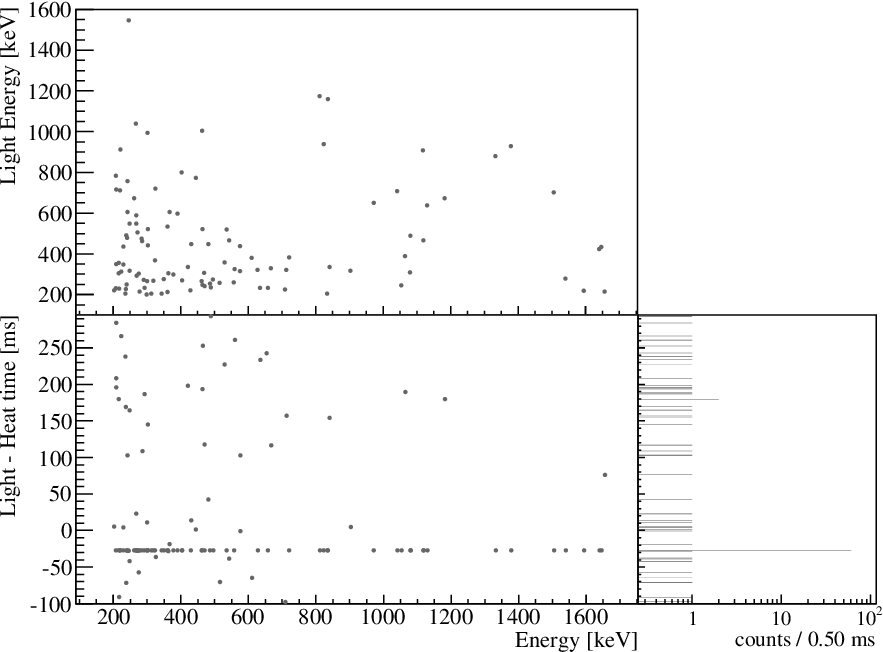
Lacking the signal sample, we estimated the time delay using events generated by particles interacting in both the LD and the HD. Also in this case, even if the nature of the energy release in the LD is different from light, the energy releases on the two bolometers can be considered synchronous. To avoid accidental coincidences, and eliminate noise fluctuations and spikes, we selected events with energy greater than 200 on both detectors. The events selected, due to multiple interacting ’s, and the distribution of their time delay are shown in Fig. 7. The outliers in the time delay distribution are due to residual accidental coincidences between particles interacting in the detectors. The mode is at -27 which is assumed as the value of the time delay. We checked on the that the time delay estimated with events generated by particles interacting on both detectors is compatible with the delay of the light signal.
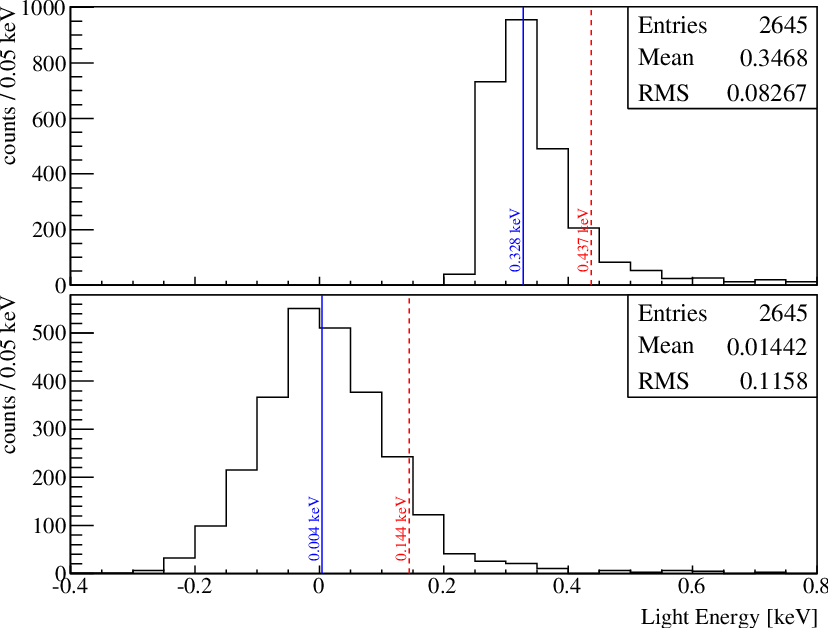
From the distribution of the light estimated with the new method versus particle energy (Fig. 6 bottom) we see that a clear correlation appears in the band. This allows to discriminate these particles from which do not produce a detectable energy. We estimate the threshold of the LD using low energy events (events in Fig. 6 with energy less than 200). The 50% of the noise events is below 328 using the old method and below 4 using the new method. The 90% is below 437 using the old method and below 144 using the new method (Fig. 8).
5 Conclusions
The algorithm we developed improves considerably the results that can be obtained from luminescent bolometers. The search of the light signal through the maximum of the optimum filtered waveform produces wrong results when the signal is at the level of the noise or below. In place of the signal amplitude, the noise pedestal, which is higher, is measured. The new method uses the heat bolometer as reference. The amplitude of the light signal is estimated from the value of the filtered waveform at a fixed time delay with respect to the signal in the heat bolometer. In this way the noise pedestal is eliminated. The amplitude measured is the real signal amplitude, smeared by the noise distribution, which is a Gaussian centered at zero amplitude. With the new method the energy threshold corresponding to a 10% rate of noise resembling signal is reduced by a factor about 3.
Finally, an important feature of our algorithm is that, even if the signal is below the noise, it produces an unbiased estimation of the signal amplitude. By increasing the statistics any small amount of light can be estimated, which is useful to study the features of the light emitted by particles of different nature and energy.
Acknowledgements.
We thank F. Bellini, L. Cardani and F. Ferroni for precious comments on the manuscript.References
- [1] R. Ardito et. al., CUORE: A Cryogenic Underground Observatory for Rare Events, hep-ex/0501010.
- [2] C. Arnaboldi et. al., CUORE: A Cryogenic Underground Observatory for Rare Events, Nucl. Instrum. Meth. A. 518 (2004) 775, [hep-ex/0212053v1].
- [3] M. Redshaw, B. J. Mount, E. G. Myers, and F. T. Avignone, Masses of Te-130 and Xe-130 and Double-beta-Decay Q Value of Te-130, Phys. Rev. Lett. 102 (2009) 212502.
- [4] S. Pirro et. al., Scintillating double beta decay bolometers, Phys. Atom. Nucl. 69 (2006) 2109, [nucl-ex/0510074].
- [5] C. Arnaboldi et. al., CdWO4 scintillating bolometer for Double Beta Decay: Light and Heat anticorrelation, light yield and quenching factors, Astropart.Phys. 34 (2010) 143, [arXiv:1005.1239].
- [6] C. Arnaboldi et. al., Characterization of ZnSe scintillating bolometers for Double Beta Decay, Astropart.Phys. 34 (2011) 344, [arXiv:1006.2721].
- [7] L. Gironi et. al., Performance of crystal as cryogenic scintillating bolometer to search for double beta decay of molybdenum, JINST 5 (2010) P11007, [arXiv:1010.0103].
- [8] S. Pirro, C. Arnaboldi, J. Beeman, and G. Pessina, Development of bolometric light detectors for double beta decay searches, Nucl. Instrum. Meth. A 559 (2006) 361.
- [9] C. Arnaboldi et. al., A novel technique of particle identification with bolometric detectors, Astropart. Phys. 34 (2011) 797, [arXiv:1011.5415].
- [10] J. Beeman et. al., Discrimination of and interactions in a TeO2 bolometer, arXiv:1106.6286. submitted to Astropart. Phys.
- [11] S. Pirro, Further developments in mechanical decoupling of large thermal detectors, Nucl. Instrum. Meth. A 559 (2006) 672.
- [12] C. Arnaboldi, G. Pessina, and S. Pirro, The cold preamplifier set-up of CUORICINO: Towards 1000 channels, Nucl. Instrum. Meth. A 559 (2006) 826.
- [13] C. Arnaboldi et. al., The front-end readout for CUORICINO, an array of macro-bolometers and MIBETA, an array of mu-bolometers, Nucl. Instrum. Meth. A 520 (2004) 578.
- [14] F. Bellini et. al., Response of a bolometer to alpha particles, JINST 5 (2010) P12005, [arXiv:1010.2618].
- [15] K. Kossert, G. Jörg, O. Nähle, and C. L. V. Gostomski, High precision measurement of the half-life of 147Sm, Appl. Radiat. Isotopes 67 (2009) 1702.
- [16] K. M. Itoh et. al., Neutron transmutation doping of isotopically engineered Ge, Appl. Phys. Lett. 64 (1994) 2121.
- [17] N. Wang et. al., Electrical and thermal properties of neutron-transmutation-doped Ge at 20 mK, Phys. Rev. B 41 (1990) 3761.
- [18] E. Gatti and P. F. Manfredi, Processing the signals from solid state detectors in elementary particle physics, Riv. Nuovo Cimento 9 (1986) 1.
- [19] V. Radeka and N. Karlovac, Least-square-error amplitude measurement of pulse signals in presence of noise, Nucl. Instrum. Methods 52 (1967) 86.
- [20] E. Andreotti et. al., 130Te Neutrinoless Double-Beta Decay with CUORICINO, Astropart.Phys. 34 (2011) 822, [arXiv:1012.3266].
- [21] S. Di Domizio, F. Orio, and M. Vignati, Lowering the energy threshold of large-mass bolometric detectors, JINST 6 (2011) P02007, [arXiv:1012.1263].
- [22] A. Alessandrello et. al., Methods for response stabilization in bolometers for rare decays, Nucl. Instrum. Meth. A 412 (1998) 454.
- [23] M. Vignati, Model of the Response Function of Large Mass Bolometric Detectors, J.Appl.Phys. 108 (2010) 084903, [arXiv:1006.4043].