IRAS 12556–7731: a “chamaeleonic” lithium-rich M-giant , Thanks: Based on HARPS observations collected at the La Silla Observations.Thanks: Figures 4 and 5 are only available in electronic form.
Abstract
Aims. In this letter we characterise IRAS 12556–7731 as the first lithium-rich M-type giant. Based on its late spectral type and high lithium content, and because of its proximity in angular distance to the Chamaeleon II star-forming region, the star was misclassified as a young low-mass star in a previous work.
Methods. Based on HARPS data, synthetic spectral modelling, and proper motions, we derive the astrophysical parameters and kinematics of the star and discuss its evolutionary status.
Results. This solar-mass red giant ( K and ) is characterised by a relatively fast rotation ( km s-1), slightly subsolar metallicity and a high-lithium abundance, (Li) dex. We discuss IRAS 12556–7731 within the context of other known lithium-rich K-type giants. Because it is close to the tip of the red giant branch, IRAS 12556–7731 is the coolest lithium-rich giant known so far, and it is among the least massive and most luminous giants where enhancement of lithium has been detected. Among several possible explanations, we cannot preclude the possibility that the lithium enhancement and rapid rotation of the star were triggered by the engulfment of a brown dwarf or a planet.
Key Words.
Stars: late-type, low-mass, fundamental parameters, abundances; Stars: individual: IRAS 12556–77311 Introduction
The source IRAS 12556–7731 was first identified by Prusti et al. (1992) in an IRAS survey of pre-main sequence (PMS) stars in the Chamaeleon II (Cha II) cloud. The source was associated with a relatively bright (12 mag) off-cloud star. A later analysis of the star’s near-IR magnitudes led Larson et al. (1998) to conclude that its IR colours are more similar to those of giants than those of PMS stars. The source was then classified as a young stellar object candidate using selection criteria based on Spitzer mid-IR data (Alcalá et al. 2008), but it lacks the IR-excess (Larson et al. 1998; Alcalá et al. 2008) typical of young stars. Since lithium is efficiently destroyed by convective mixing in the interior of low-mass stars when the temperature at the bottom of the convective layer reaches about 2.5106 K, the presence of strong Li i 6707.8 Å absorption represents an important criterion for identification of low-mass young stars. Thus, a late-type spectrum and the detection of a strong Li i 6707.8 Å absorption in two VLT-FLAMES/Giraffe spectra, have led Spezzi et al. (2008) to assign a young stellar object nature to IRAS 12556–7731. Surprisingly, this star turned out to be over-luminous by about two orders of magnitude on the HR diagram with respect to other young stars in the Cha II cloud (Spezzi et al. 2008). This result and the conclusion by Larson et al. (1998) that IRAS 12556–7731 could be a giant star, triggered a new high-resolution spectroscopic study. We characterise the star as a lithium-rich M-type giant. Several spectroscopic studies of K-type giants in the past two decades have provided evidence of lithium enhancements in the atmosphere of these stars (Kumar et al. 2011, and references therein). We study IRAS 12556–7731 in the context of other well known lithium-rich giants and discuss possible mechanisms for its lithium enhancement.
| [Fe/H] | (Li) | |||||||
| (K) | (dex) | (dex) | (km s-1) | (km s-1) | (dex) | |||
| 346060 | 0.60.2 | 0.080.20 | 83 | 67.680.02 | 2.990.15 | 1.90.2 | 1.00.2 |
2 HARPS spectroscopy
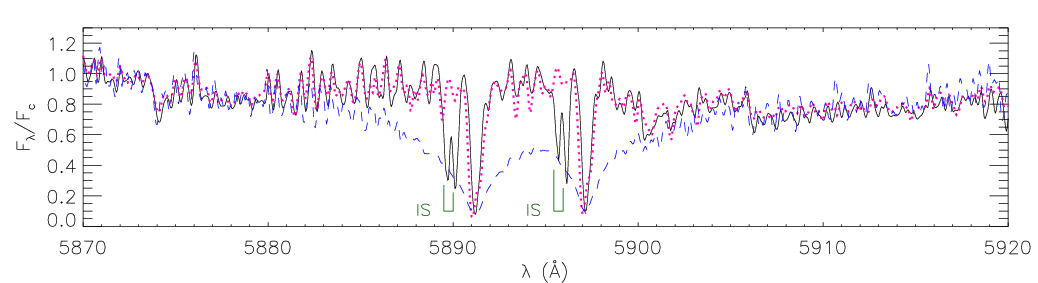
With the aim of ascertaining the nature of IRAS 12556–7731, two high-resolution (R110,000) spectra (range from 3800 Å to 6900 Å), obtained in February 2-3, 2011 with the HARPS (High Accuracy Radial velocity Planet Searcher) spectrograph at the ESO 3.6 m telescope in La Silla (Chile), were combined. The strong Li i absorption line at 6707.8 Å was the first feature to be immediately confirmed, for which we measured an equivalent width of 550(10) mÅ. Likewise, the H line is in absorption. Overall, a number of strong molecular absorption bands, mainly of titanium oxide, can be identified, and they confirm it as a very cool object. The interstellar (IS) Na i D (5890,5996 Å) absorption components, distinguishable from the photospheric ones, are clearly detected (see Fig. 1). The narrower Na i D wings of IRAS 12556–7731 with respect to HD 173740 (see Fig. 1) definitely exclude it as a main sequence star.
The mean radial velocity of IRAS 12556–7731, as drawn from the HARPS spectra, is =0.02 km s-1, which is far beyond the range of the Chamaeleon region (Covino et al. 1997, 15 km s-1;). Likewise, the proper motion components of the star, 5 mas yr-1, 5 mas yr-1, as retrieved from the PPMXL Catalog (Roeser et al. 2010), are not compatible with those of the Chamaeleon young stars (Frink et al. 1998, e.g.,). Therefore, we conclude that the kinematics of IRAS 12556–7731 is inconsistent with those of young stars in the Chamaeleon region and that the star is unrelated to the star-forming cloud. The detection of the interstellar Na i absorption components, for which we measure an km s-1 consistent with the radial velocity of Chamaeleon, is an indication that such interstellar components can be produced by the Cha II cloud itself and that IRAS 12556–7731 must be located at a much greater distance. Because it is unrelated to the star-forming region, IRAS 12556–7731 is most likely a field giant star, far behind the Cha II cloud. This confirms the suggestion by Larson et al. (1998).
3 Physical parameters and lithium abundance
Using the combined (S/N30) HARPS spectrum, we obtained first estimates of the physical parameters by a procedure outlined in detail in Appendix A. This procedure provides us with the best effective temperature, gravity, and metallicity by comparing the combined HARPS spectrum with template spectra of real stars with well known parameters via a minimization criterion. The derived stellar parameters come from a weighted mean of the parameters of the 50 reference stars (10 per each spectral region) that independently match the target spectrum most closely. The results are K, , [Fe/H], and v km s-1. From the vs. relationship by Houdashelt et al. (2000) for solar metallicity giants, we estimate , in fair agreement with the value derived from the minimization.
3.1 Lithium abundance
As pointed out by Gratton & D’Antona (1989), a high value (500 mÅ) of the 6707.8 Å Li i line equivalent width implies that the resonance doublet should be strongly saturated and that deviations from LTE conditions may be important. This requires the use of other lithium lines. The spectral range covered by HARPS also allows us to investigate the 6103.6 Å Li i line.
The Li abundance (Li) was derived by spectral synthesis of the Li i 6103.6 Å line using the MOOG code (Sneden et al. 1973), which assumes LTE conditions, along with the GAIA model atmospheres (Brott & Hauschildt 2010, priv. comm.). The hyperfine line structure has been considered following the guidelines by Wahlgren (2005) to compute the atomic parameters. The atomic and molecular line lists were taken from the VALD22 2 http://vald.astro.univie.ac.at/vald/php/vald.php. database. The physical parameters derived from the minimization explained above were used as starting values for the synthesis. We let metallicity, , (Li), and microturbulence velocity vary, while keeping and fixed. The low temperature of the star makes the spectral synthesis rather difficult, because of the uncertainty on continuum determination caused by several overlapping molecular lines. The continuum was determined by a spline fit made after visually selecting regions free of absorption lines. We estimated that the uncertainty on the continuum determination, which is the main source of error on (Li), is less than 5%. The results are shown in Fig. 2. From our best fit, we obtained values of (Li), [Fe/H], and km s-1 for a microturbulence velocity km s-1. The [Fe/H] and values are in good agreement with those from the minimization, so average values were computed. The final adopted physical parameters are reported in Table 1.
An attempt at spectral synthesis of the lithium line at 6707.8 Å with MOOG (using the Reddy et al. 2002 line list implemented within the VALD database) resulted in large residuals (c.f. Fig. 4), mainly owing to non-LTE conditions, such as the effects of over-ionization, and line asymmetry due to the convective motions, which mainly influence the 6707.8 Å Li i line formation in very cool stars (Carlsson et al. 1994). Since the EW of this line could be measured with high accuracy, we could estimate the non-LTE Li abundance through extrapolating the curves of growth by Lind et al. (2009) to a temperature of 3500 K, which yield 2.5.
We thus conclude that a reliable value for the lithium abundance of IRAS 12556–7731 is (Li). As a result, the low temperature and high lithium abundance of the star make IRAS 12556–7731 the coolest lithium-rich giant known to date. As shown below, our determinations of temperature and gravity place the star close to the tip of the red giant branch (RGB) on the HR diagram.

4 Discussion and conclusions
The stellar parameters of IRAS 12556–7731 indicate that the star is a lithium-rich M-giant. To investigate its evolutionary status in more detail, we used the tracks and isochrones by Girardi et al. (2000) for solar metallicity stars. A comparison of the position of IRAS 12556–7731 in the vs. diagram (Fig. 3) showed that the physical parameters are consistent with an age 10 Gyr. Reasonable values for the stellar luminosity and mass at that age, which are consistent with , are 2.990.15 and 1.00.2, respectively. The position of IRAS 12556–7731 on the HR diagram is shown in Fig. 3, along with several lithium-rich stars, as compiled by Kumar et al. (2011). Most of the known lithium-rich giants are concentrated within a luminosity range of 1.32, with only a minority having 2.2. Among these luminous K-type objects, HD 39853 is the coolest one; nevertheless, IRAS 12556–7731 is about 450 K cooler, placing it among the least massive and most luminous lithium-rich giants known so far. Being close to the tip of the RGB, one should then consider three possibilities for the evolutionary stage of the star: i) giant branch ascent, i.e. H-shell burning phase; ii) AGB phase; or iii) post He-core flash. Unfortunately, the CNO abundances and the 12C/13C carbon isotopic ratios, tracers of the degree of mixing that provide further constraints on the evolutionary status, cannot be derived because the spectral range of HARPS does not include the appropriate wavelength range.


Assuming a distance pc, Spezzi et al. (2008) have derived a luminosity 1. By comparing it with the luminosity estimated above, we conclude that IRAS 12556–7731 should be located at 1.75 kpc from the Sun. By adopting this distance and using the HARPS radial velocity and the proper motion components (cf. Sec. 2), the resulting spatial velocity components of the star in a left-handed coordinate system are ()( km s-1, where , , and are directed towards the Galactic anti-centre, the Galactic rotation direction, and the North Galactic Pole, respectively. According to the criteria of Oort (1926)33 3 30 km s-1 and/or ()65 km s-1., IRAS 12556–7731 can thus be considered as a high-velocity star. The Galactic latitude, distance, and kinematics of the star imply that it most likely belongs to the old thin-disk population, consistent with its almost solar metallicity. But what is the cause of its high lithium content?
Three possible scenarions can be considered to explain the high lithium abundance observed in IRAS 12556–7731: i) the star somehow preserved the original lithium in its atmosphere, ii) lithium has been regenerated in later evolutionary stages by the Cameron--Fowler mechanism44 4 Conversion of 3He to 7Li by -capture with 7Be as a radioactive intermediary. (Cameron & Fowler 1971), iii) lithium was enhanced by the engulfment of a brown dwarf or planetary companion.
As discussed in Fekel & Balachandran (1993), the scenario of the preservation of initial lithium in red giants is very unlikely. They also note that high lithium abundance was not revealed in a sample of 200 F-type stars with masses between 1 and 2 , just evolved off the main sequence. As they point out, if anything, lithium preservation might eventually work in stars of the early-F and A types, that are more massive than IRAS 12556–7731. As a solar mass star, the initial lithium was most likely burned during the pre-main sequence phase.
Depending on the stellar mass and luminosity, the production of lithium via the Cameron–Fowler mechanism supossedly occurs both at the RGB luminosity function bump (Charbonnel & Balachandran 2000) and during the He-core flash (Kumar et al. 2011). It is possible that lithium was synthesized in IRAS 12556–7731 by the Comeron–Fowler mechanism during the luminosity bump, but most likely it had already been destroyed as the star evolved up to the RGB. Although the Sackmann & Boothroyd (1999) model predicts that a high lithium abundance may be preserved all the way up the RGB, their parameterization requires very high mixing rates. It was assumed that rotation could provide such rates, but Palacios et al. (2006) find that a self-consistent model of rotational mixing cannot generate enough circulation to account for the mechanism working efficiently. It has been suggested (de la Reza et al. 1996) that the IR-excess observed in some lithium-rich giants may be due to a dust shell possibly also generated via the Cameron-Fowler mechanism, but for IRAS 12556–7731 there is no evidence of IR excess (Larson et al. 1998; Alcalá et al. 2008). On the other hand, it is unlikely that, assuming an AGB status for the star, lithium has been synthesized during the He-flash phase, because such a process should work for stars within a narrow mass range around 2 (Kumar et al. 2011). A pure Cameron-Fowler mechanism should only provide 7Li, with no 6Li. An attempt at a simultaneous fit of the resonance and subordinate lithium line by including the 6Li/7Li isotopic ratio as a free parameter improves the fit of the 6707.8 line (see Fig. 4), but there is no way to get a good fit for values of 6Li/7Li less than 0.11.
In the brown dwarf/planet engulfment scenario, the accreted matter would also result in a simultaneous enhancement of 6Li, 7Li, and Be. Unfortunately, our HARPS spectrum does not achieve the wavelength range to investigate beryllium, but the suggestion that the 6Li/7Li isotopic ratio may be as high as 0.11 would support the accretion scenario. Also, the large radius of IRAS 12556–7731 in comparison with most of the known lithum-rich giants makes the planet engulfment scenario plausible, because planet ingestion would be more likely to occur when a star evolves more in the RGB and achieves a larger radius.
Finally, in discussing the case of IRAS 12556–7731, we have to consider that its projected rotational velocity, 8 km s-1, is rather high in comparison with other lithium-rich giants. Several authors have argued that accretion of a planet may explain both lithium enhancement and rapid rotation in giants (Denissenkov & Herwig 2004; Calsberg et al. 2009; Calsberg et al. 2010, and references therein). Given its physical properties, we cannot rule out that such a process has led to the lithium enhancement and rapid rotation in IRAS 12556–7731. Some rapidly rotating giants can even become magnetically active and may be detected in X-rays (Guillout et al. 2009), however IRAS 12556–7731 was not detected in a ROSAT pointed observation (Alcalá et al. 2000).
With the observational data available so far, we cannot be conclusive about what process dominates the lithium enhancement in IRAS 12556–7731. Perhaps several mechanisms working at different times along the RGB phase of this star have contributed to its lithium enrichment.
Acknowledgements.
We thank the referee, Dr. P. Bonifacio, for his useful comments and suggestions and for information on the lithium hyperfine line structure. K.B. acknowledges financial support from the INAF Postdoctoral fellowship programme. We also thank V. Andretta, L. Belluzzi, and V. D’Orazi for discussions of hyperfine line structure.References
- Alcalá et al. (2000) Alcalá, J. M., Covino, E., Sterzik, M. F., et al. 2000, A&A, 355, 629
- Alcalá et al. (2008) Alcalá, J. M., Spezzi L., Chapman, N. et al. 2008, ApJ, 676, 427
- Calsberg et al. (2009) Carlberg, J. K., Majewski, S. R., & Arras, P., 2009, ApJ, 700, 832
- Calsberg et al. (2010) Carlberg, J. K., Smith, V. V., Cunha, K., Majewski, S. R., & Rood, R. T. 2010, ApJ, 723, L103
- Cameron & Fowler (1971) Cameron, A. G. W., & Fowler, W. A., 1971, ApJ, 164, 111
- Carlsson et al. (1994) Carlsson, M., Rutten, R. J., Bruls, J. H. M. J., & Shchunkina, N. G. 1994, A&A, 288, 860
- Charbonnel & Balachandran (2000) Charbonnel, C., & Balachandran, S. C. 2000, A&A, 359, 563
- Covino et al. (1997) Covino, E., Alcalá, J. M., Allain, S., et al. 1997, A&A, 328,187
- de la Reza et al. (1996) de La Reza, R., Drake, N. A., & da Silva, L. 1996, ApJ, 456, 115
- Denissenkov & Herwig (2004) Denissenkov, P. A., & Herwig, F. 2004, ApJ, 612, 1081
- Fekel & Balachandran (1993) Fekel, F. C., Balachandran, S., 1993, ApJ 403, 708
- Frasca et al. (2003) Frasca, A., Alcalá J. M., Covino, E. et al. 2003, A&A, 405, 149
- Frink et al. (1998) Frink, S., Roeser, S., Alcalá, J. M., Covino, E., & Brandner, W., 1998, A&A, 338, 442
- Girardi et al. (2000) Girardi, L., Bressan, A., Bertelli, G., & Chiosi, C. 2000, A&AS, 141, 371
- Gratton & D’Antona (1989) Gratton, R. G., & D’Antona, F. 1989, A&A, 215, 66
- Guillout et al. (2009) Guillout, P., Klutsch, A., Frasca, A., et al. 2009, A&A, 504, 829
- Houdashelt et al. (2000) Houdashelt, M. L., Bell, R. A., Sweigart, A. V., & Wing, R. F. 2000, AJ, 119, 1424
- Kumar et al. (2011) Kumar, Y. B., Reddy, B. E., & Lambert, D. L. 2011, ApJ, 730, 12
- Larson et al. (1998) Larson, K. A., Whittet, D. C. B., Prusti, T., & Chiar, J. E. 1998, A&A, 337, 465
- Lind et al. (2009) Lind, K., Asplund, M., & Barklem, P. S. 2009, A&A, 503, 541
- Moultaka et al. (2001) Moultaka, J., Ilovaisky, S. A., Prugniel, P., & Soubiran, C. 2004, PASP, 116, 693
- Neff et al. (1995) Neff, J. E., O’Neal, D., & Saar, S. H. 1995, ApJ, 452,879
- Oort (1926) Oort, J. 1926, Kapteyn Astr. Lab. Groningen Pub., 40
- Palacios et al. (2006) Palacios, A., Charbonnel, C., Talon, S., & Siess, L. 2006, A&A, 453, 261
- Prusti et al. (1992) Prusti, T., Whittet, D. C. B., Assendorp, R., & Wesselius, P. R. 1992, A&A, 260, 151
- Reddy et al. (2002) Reddy, B. E., et al. 2002, M.N.R.A.S., 335, 1005
- Roeser et al. (2010) Roeser, S., Demleitner, M., & Schilbach, E. 2010, AJ, 139, 2440
- Sackmann & Boothroyd (1999) Sackmann, I.-J., & Boothroyd, A. I. 1999, ApJ, 510, 217
- Sneden et al. (1973) Sneden, C. 1973, PhD thesis, Univ. Texas at Austin
- Spezzi et al. (2008) Spezzi, L., Alcalá, J. M., Covino, E., et al. 2008, ApJ, 680, 1295
- Soubiran et al. (2010) Soubiran, C., Le Campion, J.-F., Cayrel de Strobel, G., & Caillo, A. 2010, A&A, 515, 111
- Wahlgren (2005) Wahlgren, G. M. 2005, Mem. S.A.I. Suppl., 8, 108
To be published in electronic form only

Appendix A The ROTFIT procedure
In order to derive the astrophysical parameters of IRAS 12556–7731, we used a minimization procedure developed in the IDL55 5 IDL (Interactive Data Language) is a registered trademark of IT Visual Information Solutions. environment. This procedure, which is a variation of the ROTFIT code described by Frasca et al. (2003), provides us with the best match of the observed spectrum with a grid of high-resolution spectra of real stars with well determined parameters (Soubiran et al. 2010, PASTEL catalogue,) retrieved from the ELODIE archive (Moultaka et al. 2001), which is one of the largest datasets of high-resolution spectra, spanning the wavelength range 4000–6800 Å. Because the spectra are severely affected by molecular bands, it was difficult to perform a safe and homogeneous normalization to the local continuum for both IRAS 12556–7731 and the ELODIE templates. We thus preferred to analyse selected spectral regions, mainly around the strongest TiO bands (4950, 5166, 5450, 6158, 6650, 6680 Å), normalizing the spectrum with respect to the average stellar flux in a window of Å blueward of the band-head (see Fig. 5). This allowed us to fully exploit the high sensitivity to both temperature and gravity of the molecular bands (Neff et al. 1995, see, e.g.,). The Na i D lines, which are very sensitive diagnostics of temperature and gravity, were selected as well (Fig. 1). At the end of this procedure, for each of the five spectral regions investigated, ten templates that best matched the HARPS spectrum of IRAS 12556–7731, based on minimization, were chosen independently, and their known astrophysical parameters were used to compute weighted average values. Such average values were adopted as astrophysical parameters for IRAS 12556–7731. The results are K, dex, [Fe/H] dex, and v km s-1. The errors include the 1 standard deviation on the average and the typical errors of the PASTEL astrophysical parameters added in quadrature. The latter are 50 K, 0.1 dex, 0.1 dex, and 0.5 km s-1 for , , [Fe/H], and v, respectively.
