Formation of Massive Black Holes in Dense Star Clusters. II. IMF and Primordial Mass Segregation
Abstract
A promising mechanism to form intermediate-mass black holes (IMBHs) is the runaway merger in dense star clusters, where main-sequence stars collide and form a very massive star (VMS), which then collapses to a black hole. In this paper we study the effects of primordial mass segregation and the importance of the stellar initial mass function (IMF) on the runaway growth of VMSs using a dynamical Monte Carlo code for -body systems with as high as stars. Our code now includes an explicit treatment of all stellar collisions. We place special emphasis on the possibility of top-heavy IMFs, as observed in some very young massive clusters. We find that both primordial mass segregation and the shape of the IMF affect the rate of core collapse of star clusters and thus the time of the runaway. When we include primordial mass segregation we generally see a decrease in core collapse time (). Although for smaller degrees of primordial mass segregation this decrease in is mostly due to the change in the density profile of the cluster, for highly mass-segregated (primordial) clusters, it is the increase in the average mass in the core which reduces central relaxation time decreasing . The final mass of the VMS formed is always close to of the total cluster mass, in agreement with the previous studies and is reminiscent of the observed correlation between the central black hole mass and the bulge mass of the galaxies. As the degree of primordial mass segregation is increased, the mass of the VMS increases at most by a factor of . Flatter IMFs generally increase the average mass in the whole cluster, which increases . For the range of IMFs investigated in this paper, this increase in is to some degree balanced by stellar collisions, which accelerate core collapse. Thus there is no significant change in for the somewhat flatter global IMFs observed in very young massive clusters.
Keywords:
— Galaxies: star clusters: general — Galaxies: starburst — Methods: numericalI Introduction
I.1 IMBHs
It is generally accepted that there exist two separate classes of black holes (BHs) defined by their mass ranges: stellar-mass BHs of mass [5, 78, 9] that form through the collapse of massive stars, and supermassive BHs (SMBHs) of mass that are found in the centers of most galaxies including the Milky Way [42, 48, 25, 52]. However, this leaves a gap in the mass range from which in recent years seems to have been filled by tentative evidence for intermediate-mass black holes (IMBHs) [62, 29]. This evidence consists of dynamical measurements [22, 24, 75], detection of ultraluminous X-ray sources (ULX) found off-center in galaxies [52], the anomalously high mass-to-light ratio observed in the centers of some globular clusters [52] and the mass segregation quenching in the cores of globular clusters in presence of an IMBH [59].
The possible existence of IMBHs in globular clusters is suggested by the relation for galaxies, where is the mass of the central massive BH, the velocity dispersion of the bulge. Extending this relation down to velocity dispersions typical for globular clusters (), we expect BH masses in the range of . There are several claims in the literature that, indeed, such IMBHs are present in some globular clusters. The evidence is mainly based on measurements of the stellar velocity distribution, with velocity dispersions increasing strongly towards the center if an IMBH is present. The most promising candidates are the clusters G1 [23, 22] and Cen [56]. However, the presence of IMBHs in these clusters is still debated. For instance, based on scaled direct -body models Baumgardt et al. [3] show that there is no need to invoke the presence of an IMBH in the center of G1 in order to explain the observed velocity dispersion profile. On the other hand, Gebhardt et al. [23] point out that, since the region where the IMBH influences the velocity distribution is barely resolved, additional information from higher order velocity moments must be considered. Using orbit-based models to fit both surface brightness and velocity data simultaneously, they find, similar to their earlier results, that only these higher order velocity moments provide sufficient evidence for an IMBH in G1 with a mass of . However, these results must still be confirmed using fully self-consistent evolutionary models that do not rely on assumed mass-to-light ratio profiles.
Numerous ULX sources have been identified by Chandra and XMM-Newton, often associated with starburst environments. These sources have X-ray luminosities of , exceeding the angle-averaged flux of a BH of mass accreting material at the Eddington luminosity, . Although many ULX could be identified as active galactic nuclei at the centers of galaxies, and thus SMBHs, some are clearly off-center with typical projected distances of [52]. For instance, the ULX X41.4+60 in the starburst galaxy M82 [61] has been found 7” away from the galaxy center which corresponds to a distance of . Kaaret et al. [40] argue, therefore, that this X-ray source is unlikely to be an under-luminous SMBH, as dynamical friction would cause it to spiral into the nucleus of the galaxy on timescales much shorter than the age of the galaxy. Based on this argument they derive an upper mass limit of . From the total X-ray luminosity and the assumtion that the ULX source radiates isotropically at the Eddington rate, Kaaret et al. [40] also derive a lower limit of . However, they point out that this value can be lower by a factor of a few when mild beaming is considered, thus bringing it closer to the stellar mass BH range. On the other hand, newer Chandra observations by Kaaret et al. [39] have shown that during an outburst, where X41.4+60 increased its X-ray luminosity by a factor of more than , its X-ray spectrum remained in the so called “hard state”, characterized by a dominant power-law component containing of the total flux [65]. From stellar-mass BH X-ray binaries it is known that their spectra are in the hard state if . If one assumes the same limit for higher-mass BH X-ray binaries, the peak luminosity of inferred from Chandra observations would imply a lower mass limit of [39]. As one can see, even if one considers that the radiation could be mildly beamed, the minimum mass is well above the stellar-mass BH range, making this source a prime IMBH candidate. Another good candidate for an IMBH is the recently found ULX source HLX-1 in the edge-on spiral galaxy ESO 243-49 [15]. With a maximum luminosity of up to in the - band, and accounting for beaming effects, Farrell et al. [15] obtain a conservative lower limit of .
Further indications for the presence of IMBHs in some globular clusters come from unusually high mass-to-light ratios measured in their centers, as inferred from pulsar timing measurements. For instance, the Galactic globular cluster NGC 6752 has five millisecond pulsars; three of which are in the core [10]. Two of these three have negative period derivatives and one has an anomalously high positive period derivative. If the spin derivatives are due to the gravitational potential of the cluster, Ferraro et al. [16] conclude that the mass-to-light ratio in the core is M/L , much higher than inferred for most globular clusters. For comparison, is what one would expect for an old star cluster with standard IMF based on stellar evolution alone [8]. Furthermore, based on the position of one of the pulsars, Ferraro et al. [16] find that there is of underluminous matter within the inner of the cluster. This could be explained by a IMBH in the center of the cluster, but also by an exceptional concentration of dark remnants, or a black hole that is offset but near the projected location of the three millisecond pulsars in the cluster core. As the high spatial resolution in their observations does not show a cusp down to , Ferraro et al. [16] conclude that any central BH must have a mass .
There has been some considerable theoretical work by Gill et al. [26] on observational evidences of IMBHs in star clusters. Mass segregation in star clusters, brings heavier stars towards the centre increasing the average stellar mass in the core. As a diagnostic tool to quantify mass segregation, Gill et al. [26] defined this radial variation of the average stellar mass as , where is the difference of the average mass in the core () and the average mass at the projected half mass radius of the cluster (). A cluster with no IMBH, on a relaxation timescale settles to a quasi-equilibrium configuration with varying degrees of mass segregation (). They found that in simulations of clusters with an IMBH, mass-segregation () is significantly quenched. The idea is that, if there is an IMBH in the core, since the IMBH will be more massive than any of the other massive stars in the core, the IMBH has an extremely high probability of exchanging into a binary in a close three-body encounter. The subsequent interactions of this IMBH in a binary, with other massive stars in the core might kick out or scatter the other massive stars in the core. Since it will be the mass-segregated massive stars which will be scattered out of the core in this way, will decrease. Thus, in a cluster with no central IMBH, mass segregation () will be more pronounced than a cluster with an IMBH. According to the authors this phenomenon of quenching of mass segregation in presence of an IMBH can be observed by high-resolution imaging of the of the cores of a large sample of globular clusters by Hubble Space Telescope [59].
I.2 Pathways to IMBH formation
There are several pathways discussed in the literature through which IMBHs may form. The simplest way is through the core collapse of a massive Population III star formed in a mini dark matter halo at high redshift [45]. At lower redshifts such massive stars must be grown through mergers of lower mass stars, which requires rather large stellar densities, typically [20, 1, 2]. As an alternative to stellar mergers it is also possible to increase the mass of a stellar mass BH by tidally disrupting and accreting other stars; however, this seems to require even larger stellar densities [2].
In a cluster with a broad range of stellar masses, large stellar densities can be achieved through mass segregation, which will drive the most massive objects to the center, while lighter stars spread out to attain kinetic energy equipartition. However, for any reasonable IMF the most massive stars are unable to achieve energy equipartition with the lighter stars and therefore decouple from the rest of the cluster and form a compact subsystem in the cluster center. This process is called Spitzer instability [71] and causes core collapse to be accelerated [71, 76, 77, 32]. As shown by Gürkan et al. [32, hereafter Paper I], for a realistically broad stellar mass spectrum the core collapse time () can be as short as , where is the initial central relaxation time.
Once the most massive objects have segregated, the formation of an IMBH can occur in two different ways: one is when the massive stars have already evolved into stellar-mass BHs at the time of core collapse and these BHs then merge by emitting gravitational waves. The BHs first form BH binaries which then harden through dynamical interactions with other objects until the binary is close enough for gravitational radiation to dissipate sufficient orbital energy until the BHs merge [58, see, e.g.,]. However, growing an IMBH with a mass of through such stellar-mass BH mergers is only realistic for the very massive clusters such as those in galactic nuclei [58]. For smaller systems such as globular clusters Mouri & Taniguchi [54] and O’Leary et al. [58] have shown that this mechanism is rather inefficient. This is because it is much more likely that the stellar mass BHs escape through strong dynamical binary interactions [63] or recoil from asymmetric gravitational wave emission [53, 30, 57] given the low cluster escape speed.
Another way to form an IMBH, which is not restricted to galactic nuclei, is through mergers of massive main-sequence stars that segregate to the center and drive cluster core collapse before formation of stellar BHs. This subsystem of massive stars can enter a phase of rapid collisions, and since the most massive object has the largest cross-section for further collisions, this object is expected to grow in a runaway fashion. The resulting VMS eventually collapses to form an IMBH [64, 32]. As the time it takes for the most massive stars to turn into BHs is approximately [49], an IMBH is only formed through runaway merging if the cluster reaches core collapse within the first of dynamical evolution.
This simple picture has a few important caveats. First, the fate of such a massive merger remnant formed by a runaway is rather uncertain. Direct monolithic collapse to a BH with no or little mass loss is a possible outcome, at least for sufficiently small metallicities [34]. However, it has been suggested that mass loss from stellar winds could dominate the mass increase due to repeated mergers [27]. In this case it might be difficult to form a VMS at all. On the other hand, within the runaway phase, it has been shown that, for clusters like those studied here, the time between collisions is much shorter than the Kelvin-Helmholtz timescale of the collision product, so that the growing VMS must be out of thermal equilibrium. Instead the calculations of Glebbeek et al. [27] were done assuming that each merger remnant behaves exactly like an ordinary massive star in thermal equilibrium. The uncertainty in the final VMS (and IMBH) mass is further increased when considering that a stronger wind mass loss would also lead to a stronger expansion of the cluster core, decreasing the mass growth rate of the VMS by lowering the collision rate. To address this problem, one would need to perform a fully self-consistent simulation coupling the stellar dynamics with detail radiation hydrodynamics of the stellar collisions and mass loss from merger remnants. This is clearly beyond the scope of this paper.
The runaway collision scenario in globular clusters has been extensively investigated in Paper I and in Freitag et al. [20], Freitag et al. [21] using Monte Carlo (MC) simulations for a large variety of initial conditions. Paper I focuses on the dependence of on the shape and the width of the IMF, the presence of a Galactic tidal field, and the cluster density profile. The key result is that for clusters with a broad range of masses, is set by the central relaxation time, , which means that for multi-mass clusters core collapse depends on the local conditions in the core while for single-mass clusters core collapse is a global phenomenon. Furthermore it is clear that depends only weakly on the external tidal field. It was also found that the dependence of on the mass spectrum can be conveniently expressed by a single parameter , where is the maximum and the average stellar mass. For the ratio converges to a constant value for all IMFs and cluster density profiles. Combined with the requirement that be less than , this relation provides a uniform criterion for runaway growth to occur for a large range of possible, unsegregated cluster configurations.
Freitag et al. [20] performed similar simulations but also incorporating collisions explicitly. They quantified the dependence of the onset of the runaway on the initial collision time, and found that runaway growth happens earlier with respect to , the half-mass relaxation time for initially more collisional clusters. Thus, collisions extend the parameter space of initial cluster conditions for runaway to occur. However, as pointed out by the authors, for any standard IMF (Kroupa, Salpeter, Miller-Scalo) this effect is negligible for masses typical for globular clusters. Thus, in this regime, the condition for runaway to occur reduces to the one found in Paper I, based on the central relaxation time alone.
The runaway collision scenario has also been verified numerically by direct -body simulations. In Portegies Zwart & McMillan [64] runaway collisions were produced in sufficiently dense and highly concentrated clusters with only a few stars initially. Portegies Zwart et al. [61] modelled the evolution of MGG-11 with and, in one case, with stars, and found that, similar to Paper I, only clusters with a short enough mass-segregation timescale, or, correspondingly, low enough , are likely to produce a runaway object. However, their results also show that, in addition to a short , these clusters must also be sufficiently concentrated, corresponding to King models with , in order to trigger a runaway object. This might be due to the fact that in the -body simulations binaries formed by three-body interactions [20], a process which is not included in the MC runs, and these binaries dominated the collisional evolution in the core. On the other hand, for Freitag et al. [20] have demonstrated that three-body binaries are of little importance for the collision process. Similarly, Portegies Zwart et al. [61] find for their large run, that the influence of three-body binaries on the collisional evolution is lower than in their lower- runs. Thus, it appears that the nature of collisional runaway growth in a star cluster changes with increasing from being less dominated by binary collisions and involving more and more single-single collisions.
Although, the runaway merger scenario has been extensively investigated for a large variety of initial conditions, almost all of these studies started with unsegregated clusters, that is, clusters, where the stellar mass is not correlated with the radial position within the cluster. However, in recent years observations frequently indicated that many young star clusters with ages of only a few Myr show already a strong degree of mass segregation, suggesting that mass segregation may be primordial and motivating a new study of its effects on collisional runaways.
I.3 Primordial Mass Segregation and Top-Heavy IMF
Significant mass segregation has been found in many young star clusters. Mass segregation can be understood as the tendency towards equipartition of kinetic energies. This tendency for equipartition is a consequence of gravitational encounters, which attempt to drive the local velocity distribution toward a Maxwellian, with [35, Chapter 16]. As a result, massive stars move more slowly, on average, than lighter ones, so the massive stars drop lower in the potential well, while the stars of smaller mass move out and may even escape [35, Chapter 16]. This results in having the more massive members of a gravitationally bound system closer to the center whereas the lighter members are found further away. This dynamical mass segregation acts on a time-scale of the order of the relaxation time of the cluster [35, 69, Section 4.2].
However, there are indications that the degree of mass segregation seen in many young clusters cannot be a result of their dynamical evolution as their ages are much less than their relaxation time [37, 17, 11, 38, 28, 72]. For instance, for NGC330, the richest young star cluster in the small Magellanic Cloud (SMC), observations show that the IMF becomes steeper at increasing distances from the cluster center, with the number of massive stars decreasing from the core to the outskirts of the cluster 5 times more rapidly than the less-massive objects, while the age of NGC330 is 10 times shorter than the expected relaxation time of the cluster [68]. Another example is provided by the Orion nebula Cluster, in which it can be argued from numerical results that the massive stars in the centre cannot have formed in the outer regions. This implies that the stellar mass is to some degree a function of the initial position within the cluster [7]. Interestingly, the continuum observations obtained with the Combined Array for Research in Millimeter-Wave Astronomy (CARMA) of 11 Infrared Dark Cloud (IRDC) cores establishes that mass segregation can be identified at the formative stage of a stellar cluster [60]. All these observations suggest that many clusters may have been formed significantly mass segregated.
Primordial mass segregation has been explained either by the formation of massive stars preferentially in the densest regions of the parent molecular cloud [55] or by competitive gas accretion during the earliest phases of star formation [6]. An additional alternative has been suggested by McMillan et al. [47]. They show that a much higher degree of mass segregation in a cluster can be achieved if the cluster is a result of one or more mergers of smaller clusters. As the smaller clusters have shorter relaxation times, mass segregation proceeds faster. When the clusters merge, this larger degree of mass segregation is preserved in the final cluster.
Primordial mass segregation also has important consequences. It has been shown that, in an initially mass-segregated cluster, the effect of early mass loss due to stellar evolution is, in general, more destructive than for an unsegregated cluster with the same density profile, since this leads to shorter lifetimes, a faster initial evolution toward less concentrated structure and a flattening of the stellar mass function [46].
Recently, Ardi et al. [1] studied the influence of initial mass segregation on the runaway growth of a massive star by means of direct -body simulations of up to stars. Contrary to the expectations from Gürkan et al. [32], they found that, for a given density profile, initial mass segregation does not increase the available parameter space of cluster initial conditions leading to runaway growth. They argue that this is because initial mass segregation the collision rate of stars in the core as, due to the increased average mass, the number density is decreased. This is in line with earlier -body simulations suggesting that runaway growth can occur only when the cluster is initially sufficiently collisional, [61], in contrast to predictions based only on the core collapse time. This result should be tested for larger as the nature of the collisional runaway changes from being dominated by three-body binary formation at low to single-single collisions at high .
One of the main uncertainties in star cluster evolution lies in determining the true initial mass function (IMF). Often it is assumed that the IMF is a standard power-law (or power-laws with different indices in different mass ranges) with no primordial radial variation in the cluster [67, 50, 43, e.g., ]. Deviations from the standard IMFs are observed in many clusters both at the high and low-mass ends [13, e.g., ]. In particular at the high mass end MFs are observed to be generally flatter compared to standard Salpeter power-law in young massive clusters like the Arches cluster [73, 41].
II Numerical Methods
II.1 Monte Carlo code
The numerical method that has been used here to investigate the dynamical evolution of star clusters is the Monte Carlo method, based on the classic work of Hénon [36] and described in detail in Fregeau & Rasio [18, and references therein]. In Monte Carlo simulations, , the total number of stars in the cluster is dependent on the initial half mass relaxation time in the cluster. For a Plummer sphere it is given by [70, eq. 2.63],
| (1) |
where is the coulomb logarithm and is the half mass radius.
Since our code now includes an explicit treatment of all stellar collisions we briefly summarize here the ‘sticky sphere’ method for stellar collisions [19].
In the sticky sphere approximation a collision occurs whenever the centers of two stars pass within a distance , with being the stellar radii. Until this distance is reached, the gravitational influence of other stars as well as any mutual tidal interactions are neglected. The cross section for such a collision is given by Binney & Tremaine [4, section 7.5.8],
| (2) |
where is the largest impact parameter leading to contact, is the relative velocity between two stars and . In a cluster where all stars have the same mass and radius , the average local collision time is given by Binney & Tremaine [4, section 7.5.8]
| (3) |
where is the stellar number density. For a Maxwellian velocity distribution this becomes
| (4) |
where is the velocity dispersion.
In order to resolve collisional processes in a MC simulation we constrain the time step size according to an estimate of the central collision time using
| (5) |
where is a constant chosen small enough to ensure that collisions are sampled sufficiently, and is an estimate of based on equation 4, and given by
| (6) |
with quantities in angular brackets being local averages. The collision probability for two neighboring stars is calculated as
| (7) |
where is a local estimate of the stellar number density. The time step size , is chosen such that . A random number (between and ) is then drawn. If the random number two stars are selected for a collision and they are merged under the assumption of mass and linear momentum conservation.
The units adopted for our simulations are the standard -body units of the MC code, and the same as in Paper I.
II.2 Implementation Of Primordial Mass Segregation and Top-Heavy IMFs
The effect of primordial mass segregation was studied in paper I using a preliminary prescription. However, the recipe in Paper I is not defined with well constrained parameters. In this paper we have used recipes which are more realistically modelled and we do a much more extensive study.
Here we consider with two prescriptions for mass segregation: (i) the prescription of Šubr et al. [74] for generating mass-segregated clusters, in which the degree of mass segregation can be adjusted by a parameter related to the mean inter-particle energy of the stars; and (ii) the Baumgardt et al. [2] prescription, which creates a maximally mass-segregated cluster in virial equilibrium.
From -body models Šubr et al. [74] find that the quantity that is transferred between the light and massive stars is the potential energy, while their average kinetic energy remains nearly constant during the cluster evolution. Therefore, mass segregation is generated in terms of mean inter-particle potentials , which is parameterized as
| (8) |
where and denote the masses of the and particle, denotes the total mass of the cluster, is the total potential energy of the cluster, is the sum of all and is the degree of mass segregation which can have values between and (for a detailed description of the code refer to Šubr et al. [74]). In this recipe implies an unsegregated cluster and a completely mass segregated cluster. Relating to entropy has the lowest entropy and the system is highly symmetric in terms of , while for , all the binding energy is carried by the two most massive stars in the cluster and corresponds to a state of maximum entropy. With this parameterization of the inter-particle potential, quasi-stationary, star-by-star realizations of mass-segregated clusters are generated. The stars are assigned masses according to the Salpeter IMF with maximum and minimum mass of and respectively.
An important property of this mass segregation recipe is that both the density profile and the average mass in the core () is different for each value of , starting from a Plummer sphere for . This has the consequence that which is dependent on density in the core () and changes. This in turn causes to change.
The recipe from Baumgardt et al. [2], on the other hand, does not change the underlying density profile and generates mass-segregated clusters, in comparison, much faster. It essentially sorts all stars such that, for a given density profile, the most massive stars have, on average, the lowest specific total energy.
Figures 5 and 2 show the average mass profile for the initially mass-segregated clusters (and unsegregated clusters also for comparison) using the Šubr et al. [74] and Baumgardt et al. [2] recipes, respectively. As can be seen in these plots, the average mass rises rapidly within one half-mass radius, by up to a factor of (for the Baumgardt et al. (2008) recipe as well as for ) for the initially mass-segregated clusters. Similarly Figures 3 and 4 show the enclosed mass for the same two prescriptions. Comparing the median positions of the massive stars in these models, it becomes clear that the massive stars are on average at much smaller radii in initially mass-segregated clusters compared to non-segregated ones, as expected. The median distance from the cluster center can be up to a factor 4 smaller for stars with mass larger than . Comparing the enclosed stellar mass profiles for the two recipes (Figure 3 and Figure 4) it can be seen that, the Baumgardt et al. [2] recipe agree pretty closely with the Šubr et al. [74] recipe for .


In this paper we also study the effect of flatter IMFs on the runaway collision scenario in young massive star clusters. We introduce a new IMF in this paper motivated by the Arches IMF from Dib et al. [12]. For the rest of the paper, this new IMF will called the “Variable IMF” and we will denote the sections of this IMF () as with corresponding to the high mass tail of the IMF. This Variable IMF is a variation on the Arches IMF [12] by leaving out the middle section from so that the IMF is then more easily compared to the standard Kroupa IMF. The upper mass section of the Variable IMF is much flatter than traditional Salpeter [66], Kroupa [44], or Miller & Scalo [51] IMFs. We therefore expect a greater number of high mass stars, increasing both the average mass as well as the entire cluster mass.
II.3 Initial Conditions
For all the simulations in this paper our code includes physical processes such as two-body relaxation and physical stellar collisions between stars in the ‘sticky sphere’ approximation. In this paper we do not include stellar evolution in our calculations since our aim here to investigate dynamical processes taking place before even the most massive main sequence stars in the cluster have evolved (i.e., ). We have also not included any primordial binaries in our simulations just to keep the simple picture of runaway in presence of primordial mass segregation, and exclude the effects of primordial binaries on runaway collisions [31].
The most important physical properties of all our initial cluster models are given in Table 2 and Table 3. A comparison of the variable IMF with the Arches IMF or with standard Kroupa IMF is given in Table 1. In Table 2 we have listed simulations of clusters with the Variable IMF, varying and . We have also listed the simulations done with Salpeter IMF varying . In all these simulations our focus has been to investigate the effect of IMF on core-collapse of young massive clusters. All our models start with an isolated Plummer sphere and the virial radius has been chosen such that the corresponding cluster has a core-collapse time of .
In Table 3 we have listed simulations of clusters for different values of initial N and initial virial radius, , varying the degree of primordial mass-segregation. Virial radius defined by
| (9) |
where is the total mass and is the total gravitational energy of the cluster. This grid formed by the different values of initial N and initial is referred to as the parameter space in the later part of the paper. For all the simulations listed here our aim has been to investigate the effect of primordial mass-segregation on of young clusters with different initial conditions ( and ). We have calculated based on the central relaxation time defined as
| (10) |
where , n, are the three-dimensional velocity dispersion, number density, and average stellar mass respectively at the cluster center [69, eq. 3.37]. As a typical reference model similar to Paper I, all the simulations in Table 3 are initiated with Plummer models and Salpeter IMF (within and ). Another reason for using Plummer sphere is that the Šubr et al. [74] formalism starts with an isolated Plummer sphere.
III Results
III.1 Primordial Mass segregation
Freitag et al. [20] were the first to study the core collapse and collisional runaway for unsegregated clusters using a MC simulation code including stellar collisions. Similar to Freitag et al. [20] we did not take into account stellar evolution in the simulations since all the simulations were limited to the first , before the most massive stars lose mass in supernovae explosions. If a cluster had a core collapse time more than we implicitly took stellar evolution into account by ending the simulation at . Since our code now includes stellar collisions, we first checked whether we are able to reproduce their results. They found that for all models with , runaway formation of a VMS occured.
Figure 6 is a parameter survey similar to Freitag et al. [20, their Fig. 1], showing for each simulation whether a runaway occurred (filled circles) or not (open circles), for all our unsegregated models varying and the number of stars in the cluster. The solid straight line corresponds to , not including collisions. Simulations of clusters with initial conditions lying below the straight line will have , whereas for simulations with initial conditions above the line. It can be clearly seen in Figure 6 that the initial conditions leading to a runaway fall indeed below this line. Thus we have successfully reproduced the results of Freitag et al. [20] with our code and have reconfirmed the validity of the simple criterion for runaway collisions to occur in young dense star clusters.
We then repeated the same set of simulations for primordially mass-segregated clusters using the recipe from Šubr et al. [74] with . Figure 7 shows our results for mass-segregation parameter . We see that, with primordial mass segregation, the initial cluster can be chosen several times larger compared to unsegregated clusters and still lead to a runaway. Thus, simulations of primordially mass-segregated clusters increase the parameter space (range of in pc) for runaway collisions to happen when compared to simulations of primordially unsegregated clusters.
To further illustrate the effect primordial mass segregation has on the mass growth of the most massive star we compared results of a primordially mass-segregated vs an unsegregated cluster, with otherwise identical initial conditions. Figure 8 shows the growth curve of the most massive star in an unsegregated cluster and in a primordially mass-segregated cluster (), with stars and . The unsegregated cluster does not have a runaway or a very steep mass growth before it reaches core collapse, and only a star is formed within . For the primordially mass-segregated cluster, we clearly see a very steep mass growth leading to a formation of a star within and hence a runaway. A general result, in agreement with Freitag et al. [20], is that only one VMS forms in the cluster and there is no sign of multiple runaways. Note that this result might be different for clusters with significant fractions of primordial binaries [31]. As in this example, we also note in all our simulations that the time of the runaway coincides with the time of core-collapse, which decreases from for the unsegregated cluster, and to for the primordially mass-segregated cluster.
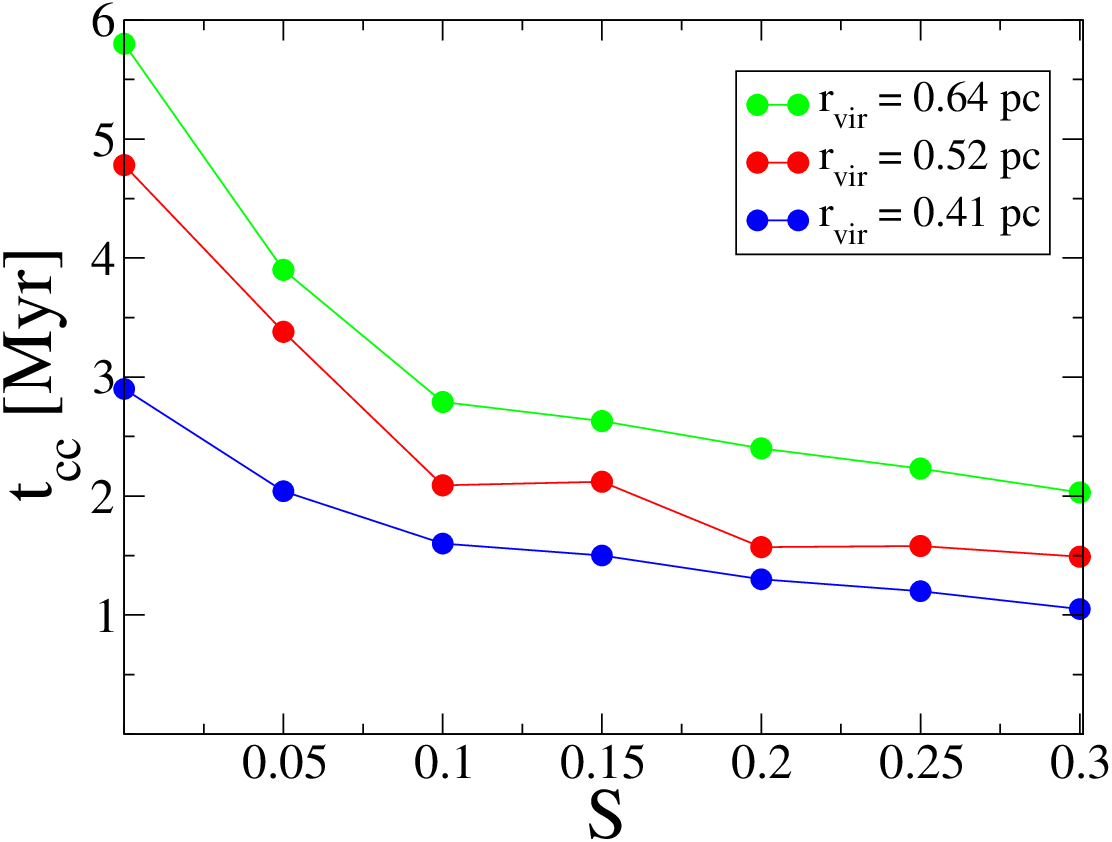
To show how strongly the core collapse time decreases for other values of we plot in Figure 9 the core collapse time for clusters with different initial , against . We clearly see a trend of decreasing with increasing . The decrease in is steepest for , causing a reduction of by a factor of . For the decrease in is weaker, reducing by another . This trend is also illustrated in Table 3 where we have shown that decreases for simulations with primordial mass-segregation, when compared to simulations of initially unsegregated clusters with similar initial conditions.
To analyze this trend further we first check whether the simple relation from Paper I between and () remains still valid for mass segregated clusters. In Figure 10 we plot against S for clusters with different . We see that remains nearly constant at with only a scatter. Thus, we conclude, that the ratio of remains consistent with the value found in Paper I and the strongly decreasing can then only be caused by a decrease in . This is also shown in Figure 11, where we plot against for clusters with different . We notice a very similar decrease in as in , with increasing , so the reason for the shorter must be attributed to shorter .
However, in the Šubr et al. [74] formulation it is not a priori clear whether this decrease in is entirely related to an increase in primordial mass segregation, as the central density () also increases with (). In order to disentangle these effects, we calculate relative contributions of all the factors to . We note that where is the velocity dispersion in the core, and is the average stellar mass in the core. Figure 12 plots the variation of , and , normalized to their values at , against in a cluster with stars. The inverse of the normalized initial central density of the clusters decreases as is increased from to by , and then remains nearly constant for larger S values. The inverse of normalized in the cluster always decreases with the increase in mass segregation, up to a factor of for . The variation of , on the other hand, is only by a factor of , implying that stays almost constant in the core and does not change with . From this it follows that for both the increase in as well as contributes equally to the decrease in . On the other hand, for larger , is dominated by while the contribution from is minimal (). So it is the increase in that mainly causes the low values for larger . Thus the maximum increase in the parameter space for a runaway to occur is driven mainly by “true” primordial mass segregation.
The advantage of including stellar collisions in our code is that we are able to directly determine how much mass eventually ends up in the VMS. Paper I showed that, as the core collapse proceeds, the mass contained in the collapsing core which forms the mass reservoir for the runaway converges to a value , where denotes the total mass of the cluster. In general we find that the fraction of that ends up as a VMS is in a similar mass range as in Paper I. In Figure 13 we show that fraction as a function of for a cluster with stars. It can be clearly seen that the fraction of ending up as a VMS increases almost by a factor of for and hence mass of the VMS increases significantly with primordial mass segregation. Thus primordial mass segregation not only increases the parameter space for runaways to occur, but also produces more massive VMS.
III.2 Top-Heavy IMFs
As discussed previously, there are indications that some young massive star clusters may be born with IMFs flatter than the Salpeter IMF. Here we study how such flatter IMFs influence the available parameter space of cluster initial conditions for a runaway to occur. One crucial result from Paper I is that the ratio of maximum to average stellar mass in the IMF is the most important parameter setting the timescale for the onset of core collapse. From Paper I if , and if , a domain is reached by any realistic IMF where . A flatter IMF increases the number of massive stars, thus increasing the average stellar mass in the cluster, which in turn causes an increase in . This means that, although for flatter IMFs we have more massive stars, the parameter space for runaway collisions to occur actually gets smaller. On the other hand, collisions can reduce by constantly dissipating orbital energy [20]. This means that the increase in seen in simulations without an explicit treatment of stellar collisions, is to some degree compensated by the effect of collisions. In Figure 14 we quantify this effect for flatter IMFs considering a wide range of values. We plot vs with and without collisions. As can be clearly seen, with stellar collisions turned off, increases; but when collisions are included, decreases on average by . Overall this causes for a collisional cluster causes the core collapse to stay close to the value for the standard Salpeter IMF (0.07) all the way to .
We also, studied the combined effects of initial mass segregation and a flat IMF on the evolution of young massive clusters. This is mainly motivated by Espinoza et al. [14] where the global IMF of the Arches cluster is determined to be flatter than Salpeter, while Arches is also known to be strongly mass segregated. Note however that the uncertainity on the slope is such that it may not be incompatible with a Salpeter IMF and there are models of Arches [33] that can explain the degree of mass segregation with a Salpeter IMF and unsegregated initial conditions. On the other hand Harfst et al. [33] do not rule out the possibility that Arches could be primordially mass-segregated. In Figure 14, we show the results for primordially mass-segregated clusters using the Baumgardt et al. [2] recipe, which, unlike the Šubr et al. [74] recipe, can be applied to clusters with arbitrary density profiles. This way the decrease in is only caused by the increase in the average stellar mass at the center of the cluster. From Figure 14 we see that, as in the unsegregated case, the effect of a flatter IMF increases , and for is very close to the standard Salpeter value. The change for is only by . Note that corresponds to either a Salpeter IMF with a high mass cut-off at , or to an IMF with a slope of and a full mass spectrum (from ). This latter slope is precisely the one suggested for the global IMF of Arches by Espinoza et al. [14]. If the global IMF of the Arches star cluster is also representative of the IMFs for much more massive clusters like the Westerlund 1, this would imply that the simple relation from Paper I can be used to determine whether a young massive cluster will undergo a runaway or not, without explicitly accounting for a different global IMF or primordial mass segregation.




IV Summary and Discussions
This work is a continuation of our study of the runaway collision scenario in young dense star clusters. In this paper our goal was to investigate the parameter space for runaway collisions to occur, when the effects of stellar collisions, primordial mass segregation and a globally flatter IMF (as indicated by observations of young massive star clusters) are accounted for. We considered clusters having Plummer density profiles, varying the initial virial radius, the number of stars in the cluster and the IMF. Primordial mass segregation was generated using the Šubr et al. [74] and [2] methods. We naturally expected that primordial mass segregation in a cluster should lead to shorter core-collapse times since the massive stars start their lives closer to the center of the cluster, where the density and therefore collision rates are highest. Indeed, from our simulations we found that the core-collapse time, decreases with increasing the degree of primordial mass segregation. increasing the initial virial radius for runaway collisions to happen, by at least a factor of .
We find that the simple relation between core-collapse and central relaxation times, (), discussed in Paper I, still holds even with primordial mass segregation. The strong decrease in hence implies a similar reduction in , which accelerates the core collapse and enlarges the parameter space for runaway collisions to occur. This decrease in , in both the Šubr et al. [74] and Baumgardt et al. [2] prescriptions, is caused by the strong increase in the average stellar mass in the core. In the Šubr et al. [74] recipe the decrease in is also caused by an increase in central density, which, however, does not contribute much at higher degrees of mass segregation ().
We find that the fraction of the total cluster mass that is eventually accumulated onto the , the possible progenitor of an IMBH is comparable to the mass of the collapsing core, , already determined in Paper I. If IMBHs were indeed formed in massive star clusters, our results show that the ratio of the mass of the IMBH to the total stellar cluster mass follow the ratio.However, the runaway collision scenario imposes the requirement that the IMBH must have formed in a cluster with initial central relaxation time shorter than .
Finally we find that for top-heavy IMFs (in unsegregated clusters) the parameter space for runaway collisions is reduced, since flatter IMFs increase , by a factor for . However this increase is to some degree balanced by collisions, which happen more frequently in clusters with flatter IMFs as we get more massive stars. In addition, primordial mass segregation in these clusters again reduces , and for an IMF with a slope of , as may be present in the Arches cluster [14], this reduced is nearly the same as for an unsegregated cluster with a Salpeter IMF. Thus, if the IMF is Salpeter like, primordial mass-segregation increases the parameter space for runaway collisions to occur, whereas for flatter IMFs the parameter space remains very similar to that in unsegregated clusters with a Salpeter like IMF. From this we can conclude that if young massive star clusters (like Westerlund 1) are primordially mass segregated and have an IMF slope similar to Arches then the results from Paper I are directly applicable.
We thank John Fregeau and Sourav Chatterjee for the useful discussions. This work was supported by NSF Grant AST-060.7498 and NASA Grant NNX08AG66G at Northwestern University.
References
- [1] Ardi, E., Baumgardt, H., & Mineshige, S. 2008, ApJ, 682, 1195
- [2] Baumgardt, H., De Marchi, G., & Kroupa, P. 2008, ApJ, 685, 247
- [3] Baumgardt, H., Makino, J., Hut, P., McMillan, S., & Portegies Zwart, S. 2003, ApJ, 589, L25
- [4] Binney, J. & Tremaine, S. 1987, Galactic dynamics, ed. Binney, J. & Tremaine, S.
- [5] Bolton, C. T. 1972, Nature, 235, 271
- [6] Bonnell, I. A. & Bate, M. R. 2006, MNRAS, 370, 488
- [7] Bonnell, I. A. & Davies, M. B. 1998, MNRAS, 295, 691
- [8] Caputo, F. 1985, Reports on Progress in Physics, 48, 1235
- [9] Casares, J. 2007, in IAU Symposium, Vol. 238, IAU Symposium, ed. V. Karas & G. Matt, 3–12
- [10] D’Amico, N., Possenti, A., Fici, L., Manchester, R. N., Lyne, A. G., Camilo, F., & Sarkissian, J. 2002, ApJ, 570, L89
- [11] de Grijs, R. 1998, MNRAS, 299, 595
- [12] Dib, S., Kim, J., & Shadmehri, M. 2007, MNRAS, 381, L40
- [13] Elmegreen, B. G. 2004, MNRAS, 354, 367
- [14] Espinoza, P., Selman, F. J., & Melnick, J. 2009, A&A, 501, 563
- [15] Farrell, S. A., Webb, N. A., Barret, D., Godet, O., & Rodrigues, J. M. 2009, Nature, 460, 73
- [16] Ferraro, F. R., Possenti, A., Sabbi, E., Lagani, P., Rood, R. T., D’Amico, N., & Origlia, L. 2003, ApJ, 595, 179
- [17] Fischer, P., Pryor, C., Murray, S., Mateo, M., & Richtler, T. 1998, AJ, 115, 592
- [18] Fregeau, J. M. & Rasio, F. A. 2007, ApJ, 658, 1047
- [19] Freitag, M. & Benz, W. 2002, A&A, 394, 345
- [20] Freitag, M., Gürkan, M. A., & Rasio, F. A. 2006a, MNRAS, 368, 141
- [21] Freitag, M., Rasio, F. A., & Baumgardt, H. 2006b, MNRAS, 368, 121
- [22] Gebhardt, K., Rich, R. M., & Ho, L. C. 2002, ApJ, 578, L41
- [23] —. 2005, ApJ, 634, 1093
- [24] Gerssen, J., van der Marel, R. P., Gebhardt, K., Guhathakurta, P., Peterson, R. C., & Pryor, C. 2002, AJ, 124, 3270
- [25] Ghez, A. M., Duchêne, G., Matthews, K., Hornstein, S. D., Tanner, A., Larkin, J., Morris, M., Becklin, E. E., Salim, S., Kremenek, T., Thompson, D., Soifer, B. T., Neugebauer, G., & McLean, I. 2003, ApJ, 586, L127
- [26] Gill, M., Trenti, M., Miller, M. C., van der Marel, R., Hamilton, D., & Stiavelli, M. 2008, ApJ, 686, 303
- [27] Glebbeek, E., Gaburov, E., de Mink, S. E., Pols, O. R., & Portegies Zwart, S. F. 2009, A&A, 497, 255
- [28] Gouliermis, D., Keller, S. C., Kontizas, M., Kontizas, E., & Bellas-Velidis, I. 2004, A&A, 416, 137
- [29] Grindlay, J. E., Heinke, C., Edmonds, P. D., & Murray, S. S. 2001, Science, 292, 2290
- [30] Gültekin, K., Miller, M. C., & Hamilton, D. P. 2004, ApJ, 616, 221
- [31] Gürkan, M. A., Fregeau, J. M., & Rasio, F. A. 2006, ApJ, 640, L39
- [32] Gürkan, M. A., Freitag, M., & Rasio, F. A. 2004, ApJ, 604, 632
- [33] Harfst, S., Portegies Zwart, S., & Stolte, A. 2010, MNRAS, 1319
- [34] Heger, A. & Woosley, S. E. 2002, ApJ, 567, 532
- [35] Heggie, D. & Hut, P. 2003, The Gravitational Million-Body Problem: A Multidisciplinary Approach to Star Cluster Dynamics, ed. P. Heggie, D. & Hut
- [36] Hénon, M. H. 1971, Ap&SS, 14, 151
- [37] Hillenbrand, L. A. 1997, AJ, 113, 1733
- [38] Hillenbrand, L. A. & Hartmann, L. W. 1998, ApJ, 492, 540
- [39] Kaaret, P., Feng, H., & Gorski, M. 2009, ApJ, 692, 653
- [40] Kaaret, P., Prestwich, A. H., Zezas, A., Murray, S. S., Kim, D.-W., Kilgard, R. E., Schlegel, E. M., & Ward, M. J. 2001, MNRAS, 321, L29
- [41] Kim, S. S., Figer, D. F., Kudritzki, R. P., & Najarro, F. 2006, ApJ, 653, L113
- [42] Kormendy, J. & Gebhardt, K. 2001, in American Institute of Physics Conference Series, Vol. 586, 20th Texas Symposium on relativistic astrophysics, ed. J. C. Wheeler & H. Martel, 363–381
- [43] Kroupa, P. 2001, MNRAS, 322, 231
- [44] —. 2002, Science, 295, 82
- [45] Madau, P. & Rees, M. J. 2001, ApJ, 551, L27
- [46] McMillan, S., Vesperini, E., & Portegies Zwart, S. 2008, in IAU Symposium, Vol. 246, IAU Symposium, ed. E. Vesperini, M. Giersz, & A. Sills, 41–45
- [47] McMillan, S. L. W., Vesperini, E., & Portegies Zwart, S. F. 2007, ApJ, 655, L45
- [48] Merritt, D. & Ferrarese, L. 2001, ApJ, 547, 140
- [49] Meynet, G. & Maeder, A. 2000, A&A, 361, 101
- [50] Miller, G. E. & Scalo, J. M. 1979a, ApJS, 41, 513
- [51] —. 1979b, ApJS, 41, 513
- [52] Miller, M. C. & Colbert, E. J. M. 2004, International Journal of Modern Physics D, 13, 1
- [53] Miller, M. C. & Hamilton, D. P. 2002, MNRAS, 330, 232
- [54] Mouri, H. & Taniguchi, Y. 2002, ApJ, 566, L17
- [55] Murray, S. D. & Lin, D. N. C. 1996, ApJ, 467, 728
- [56] Noyola, E., Gebhardt, K., & Bergmann, M. 2008, ApJ, 676, 1008
- [57] O’Leary, R. M., O’Shaughnessy, R., & Rasio, F. A. 2007, Phys. Rev. D, 76, 061504
- [58] O’Leary, R. M., Rasio, F. A., Fregeau, J. M., Ivanova, N., & O’Shaughnessy, R. 2006, ApJ, 637, 937
- [59] Pasquato, M., Trenti, M., De Marchi, G., Gill, M., Hamilton, D. P., Miller, M. C., Stiavelli, M., & van der Marel, R. P. 2009, ApJ, 699, 1511
- [60] Perez Munoz, L. M. & Carpenter, J. M. 2007, in Bulletin of the American Astronomical Society, Vol. 38, Bulletin of the American Astronomical Society, 879–+
- [61] Portegies Zwart, S. F., Baumgardt, H., Hut, P., Makino, J., & McMillan, S. L. W. 2004, Nature, 428, 724
- [62] Portegies Zwart, S. F., Makino, J., McMillan, S. L. W., & Hut, P. 1999, A&A, 348, 117
- [63] Portegies Zwart, S. F. & McMillan, S. L. W. 2000, ApJ, 528, L17
- [64] —. 2002, ApJ, 576, 899
- [65] Remillard, R. A. & McClintock, J. E. 2006, ARA&A, 44, 49
- [66] Salpeter, E. E. 1955, ApJ, 121, 161
- [67] —. 1959, ApJ, 129, 608
- [68] Sirianni, M., Nota, A., De Marchi, G., Leitherer, C., & Clampin, M. 2002, ApJ, 579, 275
- [69] Spitzer, L. 1987a, Dynamical evolution of globular clusters, ed. Spitzer, L.
- [70] —. 1987b, Dynamical evolution of globular clusters, ed. Spitzer, L.
- [71] Spitzer, L. J. 1969, ApJ, 158, L139+
- [72] Stolte, A., Brandner, W., Brandl, B., & Zinnecker, H. 2006, AJ, 132, 253
- [73] Stolte, A., Grebel, E. K., Brandner, W., & Figer, D. F. 2002, A&A, 394, 459
- [74] Šubr, L., Kroupa, P., & Baumgardt, H. 2008, MNRAS, 385, 1673
- [75] van der Marel, R. P., Gerssen, J., Guhathakurta, P., Peterson, R. C., & Gebhardt, K. 2002, AJ, 124, 3255
- [76] Vishniac, E. T. 1978, ApJ, 223, 986
- [77] Watters, W. A., Joshi, K. J., & Rasio, F. A. 2000, ApJ, 539, 331
- [78] Webster, B. L. & Murdin, P. 1972, Nature, 235, 37
| IMF | Range of m | ||
|---|---|---|---|
| () | |||
| Kroupa | |||
| -1.3 | |||
| -2.3 | |||
| Arches | |||
| -1.3 | |||
| -2.3 | |||
| -2.04 | |||
| -1.5 | |||
| -1.72 | |||
| Variable | |||
| -1.3 | |||
| -2.3 | |||
| -2.04 | |||
| -1.72 |
| Name | IMF | ||
|---|---|---|---|
| 01 | Variable | 0.39 | 0.127 |
| 02 | Variable | 0.39 | 0.103 |
| 03 | Variable | 0.39 | 0.092 |
| 04 | Variable | 0.39 | 0.088 |
| 05 | Variable | 0.39 | 0.077 |
| 06 | Variable | 0.39 | 0.081 |
| 07 | Variable | 0.39 | 0.078 |
| 08 | Variable | 0.39 | 0.132 |
| 09 | Variable | 0.39 | 0.125 |
| 10 | Variable | 0.39 | 0.117 |
| 11 | Variable | 0.39 | 0.102 |
| 12 | Variable | 0.39 | 0.099 |
| 13 | Salpeter | 0.39 | 0.067 |
| 14 | Salpeter | 0.39 | 0.073 |
| 15 | Salpeter | 0.39 | 0.0812 |
| 16 | Salpeter | 0.39 | 0.079 |
| 17 | Salpeter | 0.39 | 0.097 |
| 18 | Salpeter | 0.39 | 0.108 |
Note. — is the virial radius of the cluster, denotes the core collapse time of the cluster and denotes the half mass relaxation time.
| Name | |||||
|---|---|---|---|---|---|
| (pc) | (Myr) | (Myr) | |||
| 1a | 3x | 0.50 | 0.00 | 29.30 | 4.40 |
| 1b | 3x | 0.50 | 0.05 | 21.86 | 3.28 |
| 1c | 3x | 0.50 | 0.10 | 19.33 | 2.90 |
| 1d | 3x | 0.50 | 0.20 | 11.26 | 1.69 |
| 1e | 3x | 0.50 | 0.30 | 6.80 | 1.02 |
| 2a | 3 x | 0.62 | 0.00 | 28.66 | 4.30 |
| 2b | 3x | 0.62 | 0.05 | 24.53 | 3.68 |
| 2c | 3x | 0.62 | 0.10 | 13.00 | 1.95 |
| 2d | 3x | 0.62 | 0.20 | 10.33 | 1.55 |
| 2e | 3x | 0.62 | 0.30 | 5.86 | 0.88 |
| 3a | 3 x | 0.77 | 0.00 | 41.33 | 6.20 |
| 3b | 3x | 0.77 | 0.05 | 31.53 | 4.73 |
| 3c | 3x | 0.77 | 0.10 | 20.80 | 3.12 |
| 3d | 3x | 0.77 | 0.20 | 19.20 | 2.88 |
| 3fe | 3x | 0.77 | 0.30 | 13.93 | 2.09 |
| 5a | 5x | 0.41 | 0.00 | 25.86 | 3.88 |
| 5b | 5x | 0.41 | 0.05 | 21.13 | 3.17 |
| 5c | 5x | 0.41 | 0.10 | 17.4 | 2.61 |
| 5d | 5x | 0.41 | 0.15 | 10.00 | 1.50 |
| 5e | 5x | 0.41 | 0.20 | 8.66 | 1.30 |
| 5f | 5x | 0.41 | 0.25 | 8.0 | 1.20 |
| 5g | 5x | 0.41 | 0.30 | 5.53 | 0.83 |
| 6a | 5x | 0.52 | 0.00 | 31.86 | 4.78 |
| 6b | 5x | 0.52 | 0.05 | 22.53 | 3.38 |
| 6c | 5x | 0.52 | 0.10 | 13.93 | 2.09 |
| 6d | 5x | 0.52 | 0.15 | 14.13 | 2.12 |
| 6e | 5x | 0.52 | 0.20 | 10.46 | 1.57 |
| 6f | 5x | 0.52 | 0.25 | 10.53 | 1.58 |
| 6g | 5x | 0.52 | 0.30 | 9.93 | 1.49 |
| 7a | 5x | 0.64 | 0.00 | 38.66 | 5.80 |
| 7b | 5x | 0.64 | 0.05 | 23.33 | 3.50 |
| 7c | 5x | 0.64 | 0.10 | 16.66 | 2.50 |
| 7d | 5x | 0.64 | 0.15 | 17.53 | 2.63 |
| 7e | 5x | 0.64 | 0.20 | 16.00 | 2.40 |
| 7f | 5x | 0.64 | 0.25 | 16.00 | 2.40 |
| 7g | 5x | 0.64 | 0.30 | 13.53 | 2.03 |
| 7h | 5x | 0.64 | 0.00 | 38.33 | 5.75 |
| 7i | 5x | 0.64 | 0.05 | 23.33 | 3.50 |
| 7j | 5x | 0.64 | 0.10 | 15.93 | 2.39 |
| 7k | 5x | 0.64 | 0.15 | 17.86 | 2.68 |
| 7l | 5x | 0.64 | 0.20 | 16.00 | 2.40 |
| 7m | 5x | 0.64 | 0.25 | 15.93 | 2.39 |
| 7n | 5x | 0.64 | 0.30 | 14.00 | 2.10 |
| 7o | 5x | 0.64 | 0.00 | 38.66 | 5.80 |
| 7p | 5x | 0.64 | 0.05 | 25.33 | 3.80 |
| 7q | 5x | 0.64 | 0.10 | 16.66 | 2.50 |
| 7r | 5x | 0.64 | 0.15 | 10.76 | 2.69 |
| 7s | 5x | 0.64 | 0.20 | 16.00 | 2.40 |
| 7t | 5x | 0.64 | 0.25 | 16.00 | 2.40 |
| 7u | 5x | 0.64 | 0.30 | 14.06 | 2.11 |
| 7v | 5x | 0.64 | 0.00 | 40.00 | 6.00 |
| 7x | 5x | 0.64 | 0.05 | 23.33 | 3.50 |
| 7w | 5x | 0.64 | 0.10 | 16.86 | 2.53 |
| 7y | 5x | 0.64 | 0.15 | 17.53 | 2.63 |
| 7z1 | 5x | 0.64 | 0.20 | 16.00 | 2.40 |
| 7z2 | 5x | 0.64 | 0.25 | 16.00 | 2.40 |
| 7z3 | 5x | 0.64 | 0.30 | 13.33 | 2.00 |
| 8a | 5x | 0.77 | 0.00 | 52.60 | 7.89 |
| 8b | 5x | 0.77 | 0.05 | 34.60 | 5.19 |
| 8c | 5x | 0.77 | 0.10 | 28.26 | 4.24 |
| 8d | 5x | 0.77 | 0.15 | 24.20 | 3.63 |
| 8e | 5x | 0.77 | 0.20 | 20.40 | 3.06 |
| 8f | 5x | 0.77 | 0.25 | 19.73 | 2.96 |
| 8g | 5x | 0.77 | 0.30 | 16.53 | 2.48 |
| 9a | 1x | 0.41 | 0.10 | 20.8 | 3.12 |
| 9b | 1x | 0.41 | 0.15 | 19.06 | 2.86 |
| 9c | 1x | 0.41 | 0.20 | 16.53 | 2.48 |
| 9d | 1x | 0.41 | 0.30 | 10.40 | 1.56 |
| 10a | 1x | 0.51 | 0.10 | 32.60 | 4.89 |
| 10b | 1x | 0.51 | 0.15 | 21.46 | 3.22 |
| 10c | 1x | 0.51 | 0.20 | 17.66 | 2.65 |
| 10d | 1x | 0.51 | 0.30 | 15.53 | 2.33 |
| 11a | 1x | 0.83 | 0.10 | 46.53 | 6.98 |
| 11b | 1x | 0.83 | 0.15 | 43.73 | 6.56 |
| 11c | 1x | 0.83 | 0.20 | 27.60 | 4.24 |
| 11d | 1x | 0.83 | 0.30 | 20.06 | 3.01 |
| 12a | 1x | 1.10 | 0.10 | 60.53 | 9.08 |
| 12b | 1x | 1.10 | 0.15 | 59.26 | 8.89 |
| 12c | 1x | 1.10 | 0.20 | 52.40 | 7.86 |
| 12d | 1x | 1.10 | 0.30 | 44.46 | 6.67 |
Note. — Here and are the initial number of stars and the initial virial radius respectively. is the degree of mass segregation (equation (8)), is the initial central relaxation time and denotes the core collapse time.
| Name | (estimated) | (Actual) | |||
|---|---|---|---|---|---|
| 1a | 3x | 0.50 | 0.00 | 3.70 | 4.4 |
| 1b | 3x | 0.50 | 0.05 | 2.97 | 3.28 |
| 1c | 3x | 0.50 | 0.10 | 2.38 | 2.90 |
| 1d | 3x | 0.50 | 0.20 | 1.63 | 1.69 |
| 1e | 3x | 0.50 | 0.30 | 0.99 | 1.02 |
| 2a | 3 x | 0.62 | 0.00 | 4.4 | 4.3 |
| 2b | 3x | 0.62 | 0.05 | 3.70 | 3.68 |
| 2c | 3x | 0.62 | 0.10 | 1.95 | 1.95 |
| 2d | 3x | 0.62 | 0.20 | 1.5 | 1.55 |
| 2e | 3x | 0.62 | 0.30 | 0.8 | 0.88 |
| 3a | 3 x | 0.77 | 0.00 | 6.24 | 6.20 |
| 3b | 3x | 0.77 | 0.05 | 4.74 | 4.73 |
| 3c | 3x | 0.77 | 0.10 | 3.11 | 3.12 |
| 3d | 3x | 0.77 | 0.20 | 2.87 | 2.88 |
| 3fe | 3x | 0.77 | 0.30 | 2.08 | 2.09 |
| 5a | 5x | 0.41 | 0.00 | 3.00 | 3.88 |
| 5b | 5x | 0.41 | 0.05 | 2.03 | 3.17 |
| 5c | 5x | 0.41 | 0.10 | 1.47 | 2.61 |
| 5d | 5x | 0.41 | 0.15 | 1.45 | 1.50 |
| 5e | 5x | 0.41 | 0.20 | 1.24 | 1.30 |
| 5f | 5x | 0.41 | 0.25 | 1.21 | 1.20 |
| 5g | 5x | 0.41 | 0.30 | 1.05 | 0.83 |
| 6a | 5x | 0.52 | 0.00 | 4.25 | 4.78 |
| 6b | 5x | 0.52 | 0.05 | 3.38 | 3.38 |
| 6c | 5x | 0.52 | 0.10 | 2.09 | 2.09 |
| 6d | 5x | 0.52 | 0.15 | 2.07 | 2.12 |
| 6e | 5x | 0.52 | 0.20 | 1.76 | 1.57 |
| 6f | 5x | 0.52 | 0.25 | 1.73 | 1.58 |
| 6g | 5x | 0.52 | 0.30 | 1.50 | 1.49 |
| 7a | 5x | 0.64 | 0.00 | 5.89 | 5.80 |
| 7b | 5x | 0.64 | 0.05 | 3.98 | 3.50 |
| 7c | 5x | 0.64 | 0.10 | 2.89 | 2.50 |
| 7d | 5x | 0.64 | 0.15 | 2.86 | 2.63 |
| 7e | 5x | 0.64 | 0.20 | 2.43 | 2.40 |
| 7f | 5x | 0.64 | 0.25 | 2.39 | 2.40 |
| 7g | 5x | 0.64 | 0.30 | 2.07 | 2.03 |
| 8a | 5x | 0.77 | 0.00 | 7.65 | 7.89 |
| 8b | 5x | 0.77 | 0.05 | 5.17 | 5.19 |
| 8c | 5x | 0.77 | 0.10 | 3.76 | 4.24 |
| 8d | 5x | 0.77 | 0.15 | 3.72 | 3.63 |
| 8e | 5x | 0.77 | 0.20 | 3.16 | 3.06 |
| 8f | 5x | 0.77 | 0.25 | 3.11 | 2.96 |
| 8g | 5x | 0.77 | 0.30 | 2.69 | 2.48 |
| 9a | 1x | 0.41 | 0.10 | 3.45 | 3.12 |
| 9b | 1x | 0.41 | 0.15 | 2.98 | 2.86 |
| 9c | 1x | 0.41 | 0.20 | 2.22 | 2.48 |
| 9d | 1x | 0.41 | 0.30 | 2.12 | 1.56 |
| 10a | 1x | 0.51 | 0.10 | 4.34 | 4.89 |
| 10b | 1x | 0.51 | 0.15 | 3.76 | 3.22 |
| 10c | 1x | 0.51 | 0.20 | 2.86 | 2.65 |
| 10d | 1x | 0.51 | 0.30 | 2.43 | 2.33 |
| 11a | 1x | 0.83 | 0.10 | 7.12 | 6.98 |
| 11b | 1x | 0.83 | 0.15 | 6.74 | 6.56 |
| 11c | 1x | 0.83 | 0.20 | 5.02 | 4.24 |
| 11d | 1x | 0.83 | 0.30 | 2.58 | 3.01 |
| 12a | 1x | 1.10 | 0.10 | 9.12 | 9.08 |
| 12b | 1x | 1.10 | 0.15 | 7.85 | 8.89 |
| 12c | 1x | 1.10 | 0.20 | 7.65 | 7.86 |
| 12d | 1x | 1.10 | 0.30 | 6.54 | 6.67 |
All initial models are isolated Plummer spheres with standard Salpeter IMF. Here and are the initial number of stars and the initial virial radius respectively. is the degree of mass segregation equation\eqrefS. (estimated) denotes the core collapse time calculated analytically and (actual) is from our simulations, in Myr.
Note. — a