NERO A Post Maximum Supernova Radiation Transport Code
Abstract
The interpretation of supernova (SN) spectra is essential for deriving SN ejecta properties such as density and composition, which in turn can tell us about their progenitors and the explosion mechanism. A very large number of atomic processes are important for spectrum formation. Several tools for calculating SN spectra exist, but they mainly focus on the very early or late epochs. The intermediate phase, which requires a NLTE treatment of radiation transport has rarely been studied.
In this paper we present a new SN radiation transport code, nero, which can look at those epochs. All the atomic processes are treated in full NLTE, under a steady-state assumption. This is a valid approach between roughly 50 and 500 days after the explosion depending on SN type. This covers the post-maximum photospheric and the early and the intermediate nebular phase.
As a test, we compare nero to the radiation transport code of Jerkstrand et al. (2011) and to the nebular code of Mazzali et al. (2001). All three codes have been developed independently and a comparison provides a valuable opportunity to investigate their reliability. Currently, nero is one-dimensional and can be used for predicting spectra of synthetic explosion models or for deriving SN properties by spectral modelling. To demonstrate this, we study the spectra of the ’normal’ SN Ia 2005cf between 50 and 350 days after the explosion and identify most of the common SN Ia line features at post maximum epochs.
Keywords:
1 Introduction
Supernovae are classified by their spectra. The most common types are SNe Ia, Ib, Ic, IIb and II (Turatto et al., 2007, e.g.). This classification links directly to the explosion mechanism, which can be either a thermonuclear explosion or the collapse of a massive star. The connection can be established since the progenitor and the explosion mechanism leave a unique imprint on the resulting SNe, which is reflected by their spectra.
In turn, one can learn about the properties of observed SNe by spectral analysis. The earliest attempts to interpret the spectra of SNe reach back to the very beginning of SN astronomy, when SNe I were classified as hydrogen poor and SNe II as hydrogen rich (Minkowski, 1941, e.g.). Since then, the interpretation of SN spectra has been steadily refined and several advanced tools to study SN spectra formation exist today (see below).
SN spectra are usually grouped into photospheric and nebular. It is not trivial to distinguish between the two phases on physical grounds since most radiation process important during the earliest phases play also a role at late times. However, nebular phase spectra are dominated by clear forbidden-line emission features, which become dominant at about 200 days after the explosion. Although photo-excitation and -ionisation processes are important at later epochs (e.g. Li & McCray, 1996; de Kool et al., 1998; Jerkstrand et al., 2011, also see this paper), they are absolutely dominant at earlier epochs.
Directly after the explosion the gas is in local thermodynamic equilibrium (LTE), which simplifies radiation transport. However, shortly after maximum light at latest non-local thermodynamic equilibrium (NLTE) effects become important. Very little attention has been paid to these intermediate epochs so far, which require a full NLTE treatment of radiation transport.
Codes treating the early phase have for example been developed by Mazzali & Lucy (1993); Lucy (1999); Kasen et al. (2006); Kromer & Sim (2009). These early time codes rely at least partially on the LTE assumption and do not treat forbidden-line emission. For later epochs numerical treatments have for example been developed by Axelrod (1980); Ruiz-Lapuente & Lucy (1992); Kozma & Fransson (1992); Kozma & Fransson (1998); Eastman & Pinto (1993); de Kool et al. (1998); Mazzali et al. (2001); Jerkstrand et al. (2011). In addition to those spectral codes specified for SNe, there exist others (Pauldrach et al., 1996; Hauschildt et al., 1997; Hillier & Miller, 1998, e.g.) which can be used for calculating SN spectra. The list presented here is a selection and is far from complete.
Here we present a new non-thermal equilibrium radiation transport (nero) code which addresses especially the intermediate epochs at about 50 200 days after the explosion. We can also treat later epochs, as long as the gas shows no strong deviations from steady-state (see Section 2).
In Section 2 we describe the new code. In Section 3 we compare nero to the steady-state radiation transport code of Jerkstrand et al. (2011) and to the nebular code of Mazzali et al. (2001). We also compare synthetic spectra obtained by using nero on a SN Ia W7 model (Nomoto et al., 1984) with observations of the proto-typical ’normal’ SN Ia 2005cf at epochs between 50 and 350 days after the explosion. In Section 4 our results are discussed.
2 Code description
nero is built on
the assumption that the SN ejecta are in a steady-state,
i.e. heating and ionisation are balanced by
cooling and recombination, which is
valid between roughly 50 500 days after the explosion
(Axelrod, 1980, e.g.). These limits however depend strongly on the ejecta density and
composition. Under this assumption the spectral emission can be
calculated at any epoch without considering the radiation history of
the gas. The phase we can treat begins when the
SN light-curve starts to follow the decay of Ni and Co, which means
that the gas is in thermal equilibrium and ends when
the gas falls out of ionisation equilibrium or when adiabatic cooling
becomes important (Kozma & Fransson, 1992, e.g.).
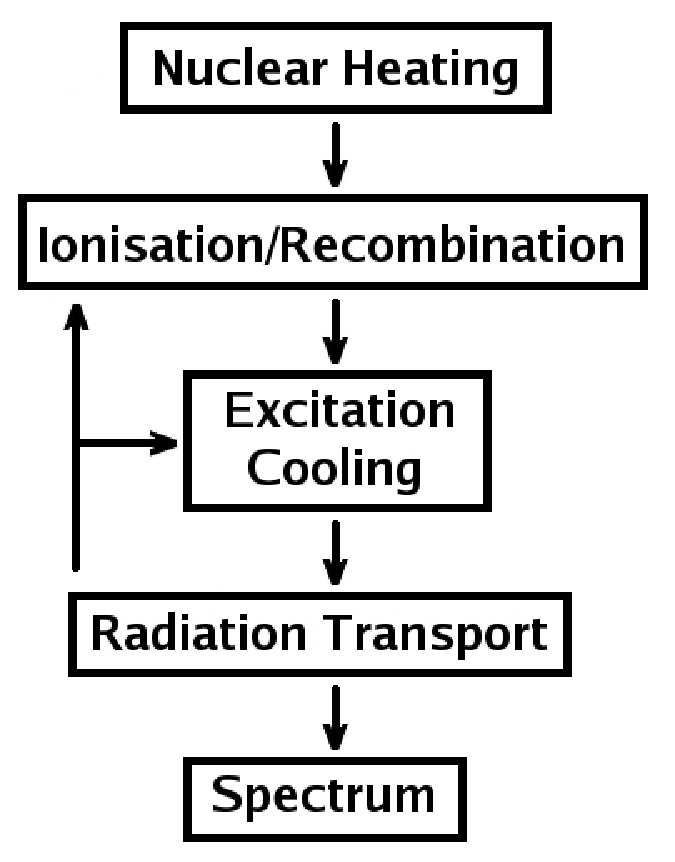
In a first step, the energy deposition from the decay of radioactives is calculated, from which we derive the non-thermal electron ionisation and excitation rates. Using an initial guess for the ionisation and excitation state and the temperature of the gas we derive its new ionisation and excitation state by solving the statistical equilibrium equations. From the ion fractions and occupation numbers one can calculate the radiation field. This radiation field is transported through the SN ejecta using a ray-tracing transport scheme, from which we derive photo-ionisation and excitation rates. The ionisation and excitation states are iterated until the electron density and temperature and the radiation field have converged. A scheme of nero is shown in Figure 1.
Currently, nero is one-dimensional, but a three-dimensional version may be available in the future. For a one-dimensional model consisting of about 20 radial shells, one calculation takes a few minutes on a standard desktop computer, depending on the composition and density of the model and the desired resolution. All synthetic spectra obtained for this paper using nero required a calculation time of the order of 5 minutes, which is excellent for a fully-fledged NLTE radiation transport code. Still, we plan to parallelise and further optimise nero in the future, to make modelling of observed SN spectra as efficient as possible.
2.1 Radioactive deposition
nero can treat radioactive deposition by 56,57Co and by 56,57Ni. The half-lives of these isotopes can for example be found in Seitenzahl et al. (2009). Including other radioactives would be simple. The energy deposition process is treated with a Monte Carlo approach, where Compton scattering, pair-creation and photo-ionisation are taken into account, as for example described in Sim & Mazzali (2008). We calculate the spectrum of the emerging -radiation. However, there are no observations available to compare with. The accuracy of our deposition routine has been verified by comparing the energy deposition rates to calculations performed with the spectral codes of Mazzali et al. (2001) and Jerkstrand et al. (2011). From the deposited luminosity we calculate non-thermal ionisation and excitation rates as described in Maurer & Mazzali (2010) and Maurer et al. (2010a). To evaluate the non-thermal ionisation rates we estimate the fraction of the deposited luminosity causing ionisation using the Bethe approximation (Axelrod, 1980, e.g.). The non-thermal excitation rates are calculated using the optical approximation (Axelrod, 1980; Rozsnyai et al., 1980, e.g.). It was found by Maurer et al. (2010a) that this treatment of non-thermal ionisation and excitation is accurate to at least 20% for hydrogen and helium. We also compared our non-thermal electron ionisation and excitation rates for various ions to rates calculated with the radiation transport code of Jerkstrand et al. (2011), which makes use of the Spencer-Fano approach of Kozma & Fransson (1992). We find overall good agreement, with deviations usually of the order of 10% and 50% in the worst case. Especially for the iron-group elements the non-thermal rates are strongly affected by inaccurate or poorly known atomic data and a high degree of uncertainty has to be accepted. This may be the largest source of uncertainty in all spectral calculations of SNe Ia after maximum light.
2.2 Ionisation & Recombination
The ionisation state of the gas is calculated under the assumption of statistical equilibrium, balancing non-thermal electron ionisation, photo-ionisation and radiative and di-electronic recombination with the charge-exchange reactions listed in Swartz (1994). The non-thermal electron rates are obtained as described in Section 2.1. The photo-ionisation rates are obtained from ray-tracing radiation transport (described below) using the ground state photo-ionisation cross-sections from TIPTOP Base11 1 http://cdsweb.u-strasbg.fr/OP.htx and a simple approximation for the lowest 40 excited states. Above the corresponding ionisation thresholds, the excited-state photo-ionisation cross-sections are assumed to be constant fractions of the ground-state cross-sections. These fractions decrease with increasing main quantum number of the excited states. All rates are corrected for stimulated recombination. We do not treat photo-ionisation from states higher than 40 since they seem to have no noticeable influence on the spectra at the epochs of interest (50 500 days). We use the radiative and di-electronic total recombination rates of Mazzotta et al. (1998). Ground state recombination rates are taken from Aldrovandi & Pequignot (1973) or are set to 10% of the total radiative recombination rate, if not available. All the electrons recombining into excited states are distributed equally to the lowest 40 excited states from where they undergo the complete NLTE process. We plan to improve our excited state ionisation and recombination data base in the future.
2.3 Excitation
We use the line data collection of Kurucz & Bell (1995), which roughly contains 25.000 atomic levels and 500.000 lines. In principle, we can treat all elements from H to Ni and all ions from ionisation state I III (IV is taken into account for the ionisation equilibrium but does not contribute to the radiation field). However, the atomic data are poor for many ions. The atomic excitation states are calculated by solving a rate matrix (Axelrod, 1980, e.g.), including non-thermal electron excitation rates (see Section 2.1), photo-ionisation and excitation rates obtained from ray-tracing radiation transport (see below) using the Sobolev approximation, spontaneous radiative de-excitation, recombination into excited states, thermal electron (de-) excitation, continuum destruction (Chugai, 1987; Li & McCray, 1995, e.g.) and two-photon emission (TPE) of H i(2s1S) and He i(2s1,3S) [e.g. see Kaplan et al. (1972); Drake et al. (1969) for TPE rates].
With the electron density and temperature obtained from the iteration process, we calculate collisional (de-) excitation rates. Collisional data are taken from TIPTOP and CHIANTI databases22 2 http://www.chiantidatabase.org/ but also from other sources (Berrington et al., 1982; Hayes & Nussbaumer, 1984; Berrington, 1988; Mauas et al., 1988; Scholz et al., 1990; Callaway, 1994; Meléndez et al., 2007; Bautista et al., 2009, e.g.). Since our collisional database is far from complete we plan to regularly add and update collisional atomic data. If not available, the collision strengths are approximated (van Regemorter, 1962; Axelrod, 1980, e.g.). However, for several hundreds of lines there is collisional data from the literature. A serious problem at intermediate epochs, especially for treating SNe Ia, is the absence of reliable collisional data for Co.
2.4 Radiation Transport
From the ionisation and excitation states obtained in the previous steps we calculate a radiation field, which is represented by a certain amount of photon packets (typically, a few 100.000 per shell in total). These are sent through the SN envelope in random directions. On their way out they propagate on straight lines and encounter bound-bound and bound-free absorption and electron-scattering. The probabilities for line scattering are calculated in the Sobolev approximation. While transported, the photon packets lose parts of their energy according to the respective optical depths (or change their direction after electron scattering), and can be absorbed to 100% if the optical depth is much larger than one. The absorbed photon packets are re-emitted in random directions in the next iteration step after taking part in the NLTE excitation matrix calculation (Section 2.3). Therefore, all the absorbed energy undergoes the full NLTE process, including fluorescence, up- and down-ward electron collisions, photo-ionisation, recombination, continuum destruction and two-photon emission.
3 Code results
3.1 Comparison to other codes
| C | O | Na | Mg | S | Ca | Ni | |
|---|---|---|---|---|---|---|---|
| M⊙ | M⊙ | M⊙ | M⊙ | M⊙ | M⊙ | M⊙ | |
| A | 0.09 | 0.2 | 0.0002 | 0.002 | 0.02 | 0.001 | 0.07 |
| B | 0.2 | 0.6 | 0.01 | 0.1 | 0.03 | 0.0004 | 0.03 |
| C | 0.07 | 0.2 | 0.05 | 0.1 | 0.01 | 0.002 | 0.05 |
In this section we compare nero to the radiation transport code of Jerkstrand et al. (2011) [RTJ] and to the nebular code of Mazzali et al. (2001) [RTM]. RTJ is a steady-state radiation transport code. Although developed independently, it is built on very similar physical assumptions as nero. While nero treats the NLTE process completely, RTJ does not allow up-ward excitation of photo-excited levels. However, at least at the late epochs, which have been chosen for the code comparison, this seems to have no observable influence on the synthetic spectra (see below). RTJ has been applied to study the very late phase of SN 1987A so far (Kjær et al., 2010; Jerkstrand et al., 2011).
RTM is a nebular code based on the ideas of Axelrod (1980) and Ruiz-Lapuente & Lucy (1992), therefore neglecting all radiation transport effects. It has widely been used in the literature (Silverman et al., 2009; Mazzali et al., 2010, e.g.) to study nebular spectra of all types of SNe.
While nero and RTJ are currently available in one-dimensional versions only, there are three-dimensional versions of RTM (Maeda et al., 2002; Maurer et al., 2010b).
A code comparison is interesting, since all three codes have been developed independently and use different numerical methods, physical assumptions and partially different atomic data.
For the comparison of RTJ and nero, we chose the 13C model of Woosley et al. (1994). At 200 and 400 days after the explosion excellent agreement (see Figures 2 & 3) is observed. The 13C model is found to show very strong Ca ii emission in both calculations, which can however be explained to be a mixing effect. In the 13C model all the Ca is mixed with the other elements microscopically. Since Ca ii has a low excitation potential and large collision strengths it radiates strongly, if it is mixed into large amounts of hydrogen, helium or oxygen.
Another comparison of nero and RTJ was performed for a Type Ia W7 model (Nomoto et al., 1984) at 94 and 338 days after the explosion. The agreement at both epochs is good (see Figures 4 & 5). However, at 94 days after the explosion there is a strong deviation around 4600 Å and 5900 Å. These features are caused by Fe iii and Co iii, respectively. The fraction of these ions is similar in both calculations, which means that the ion abundance cannot be a main reason for this differences. Since both features are dominated by collisional excitation from ground levels and since the electron temperature and the density are similar in both calculations, it is likely that the differing sets of atomic data used in nero and RTJ are responsible for most of the deviation. Also, there is is an important fraction ( 15% at 5000 km/s, increasing with velocity) of Fe iv and Co iv in the nero calculation, which is neglected by RTJ at the moment. The recombination of these ions (and photo-ionisation of Fe iii and Co iii) influences the radiation field and the cascading of UV radiation can hardly be followed in detail. It is interesting to note that the Fe iii feature produced with RTJ is more consistent with observed SNe Ia spectra, while this is true for the Co iii feature produced with nero (see below).
For the comparison of RTM and nero we chose a Type Ia W7 model (Nomoto et al., 1984) and the ’standard’ Type Ic SN 1994I (Sauer et al., 2006). The comparison of spectra obtained with RTM and nero for the W7 model (Nomoto et al., 1984) shows reasonable agreement (see Figure 6). The core of the W7 model, which is observed in the nebular phase, consists of almost pure Fe (from 56Ni decay). In nero Fe i is photo-ionised almost completely. The ratio of Fe ii to Fe iii is dominated by non-thermal electron ionisation at late epochs, which is also treated by RTM. In RTM the fraction of Fe i is always set to zero. Therefore, the ionisation state (and hence the electron density) of a pure Fe core obtained by nero and RTM is similar for this model. The electron temperature of the Fe plasma obtained by nero is about 10% lower than that obtained with RTM, because of the presence of excitation processes (photo-excitation, excitation by excited-state recombination, non-thermal electron excitation, more collisional transitions) which are neglected in RTM calculations.
Since RTM has exclusively been used to derive SN core ejecta properties (and not for predicting spectra from explosion models), we also compare modelling results of RTM and nero. For this comparison, we chose SN Ic 1994I, which has been studied in detail by Sauer et al. (2006). They derived a total core mass ( 5500 km/s) of 0.43 M⊙ and a 56Ni mass of 0.07 M⊙, which was also found to be consistent with the observed light curve of SN 1994I. We fit the observed spectrum with one-zone models (see Figure 7), as it was done by Sauer et al. (2006) [see Table 1, model ’A’ (RTM) & ’B’ (nero)].
In general, the masses estimated for Na, Mg, Si, S and Ca deviate in RTM and nero calculations. This is expected, since these elements are strongly influenced by photo-ionisation, which is not treated in RTM. Therefore, one derives more mass for the elements which are estimated from the neutral component (e.g. Na, Mg) and less for those which are estimated from ionised states (e.g. Ca) using nero.
Another important difference is found for the estimate of the total and the 56Ni mass. These two quantities can be considered as the main properties of any SN and should be in unison with its light curve. While the RTM calculation is consistent with the light curve (Sauer et al., 2006, see), the nero calculation seems to show too much total mass and too little 56Ni (see Table 1, model ’B’) to be consistent with the light curve modelling results of Sauer et al. (2006).
This can have several reasons. Unfortunately, the intrinsic uncertainty of light curve modelling is hard to estimate and there is always some degeneracy between 56Ni and total mass, especially when radiation transport is treated in rough approximation.
However, assuming that the 56Ni and total mass derived by Sauer et al. (2006) are correct, the discrepancy of the main properties can be explained by the over-simplified input model that was used in the calculation. It is well known, that mixing of the ejecta does have an important effect on the resulting spectra (also see above).
While for the code comparison of RTM and nero a one-zone model has been used, a real SN is certainly more complex. Apart from large scale asymmetries (which are not necessarily expected in SN 1994I), the ejecta can be structured on much smaller scales. If 56Ni and other elements are separated, the ratio of Fe and other element lines changes. This, in turn, influences the estimate of the ejecta properties.
Mixing can influence the spectrum in two ways. First, separation of 56Ni and other elements reduces the heating in the non-radioactive zones. However, in the intermediate nebular phase this effect is weak, since the opacity is low and positrons do not dominate yet. More importantly, when separated, carbon or oxygen rich zones cannot cool via Fe emission lines. This means, that separating 56Ni from other elements in the nebular phase can lead to stronger emission of those elements than with perfect mixing, which may seem counter-intuitive on a first glance.
To demonstrate this, we model SN 1994I using nero again, this time separating Fe and O in several thin shells to simulate a separation of the ejecta on small scales. The derived 56Ni and total mass changes strongly (see Table 1, model ’C’) and becomes more consistent with the light curve estimate of Sauer et al. (2006). Of course, such an approach is highly degenerate and a broad variety of modelling results is possible.
This causes an unfortunate situation. On the one hand, detailed knowledge of the mixing of the ejecta on large and on small scales is necessary to derive the main ejecta properties. On the other hand, this information is poorly constrained from observations and explosion models, especially on the small scales. Therefore, mixing poses a problem for deriving ejecta properties of stripped-envelope core-collapse SNe from modelling. Within these uncertainties, RTM seems appropriate to derive the main properties of SNe. For nero calculations, more elaborate input models seem to be necessary to become consistent with the light curve modelling.


3.2 Comparison to observations
To further test the reliability of nero, we calculate synthetic spectra for a W7 model (Nomoto et al., 1984), which is expected to reproduce the spectra of ’normal’ SNe Ia, although this has never been tested at intermediate epochs. We compare our synthetic spectra to SN Ia 2005cf (Garavini et al., 2007; Wang et al., 2009), which can be regarded as a proto-type of ’normal’ SNe Ia. The calculations are performed at 47, 94 and 338 days after the explosion (see Figures 8, 9 & 11).
At 47 days after the explosion the agreement between the synthetic and the observed spectrum is acceptable, given that Co collisional data and forbidden lines are poorly known. It is interesting to note that the prominent feature at 8500 Å, which is usually thought to be a Ca ii P-Cygni profile, could be strongly influenced by Co ii emission in the observed SN Ia at this epoch. The collisional data for Co ii are very poor and it is not unlikely that we underestimate (or overestimate) the Co emission in our calculation. Since important Co collisional data is missing, this remains a speculation.
At 94 days after the explosion there is serious disagreement between the observed and synthetic nero spectrum around 4600 Å. Interestingly, in the synthetic spectrum this feature is dominated by Fe iii (see Figure 9), while another feature, which matches the observations well, at 5900 Å is dominated by Co iii. The RTJ spectrum of W7 (see Figure 10) fits the 4600 Å much better, but under-produces the flux around 5900 Å. Therefore, there seems to be a problem with the ratio of the Fe iii and Co iii line emission in both calculations. Although, one should not expect that the W7 model can reproduce the spectra of SN 2005cf in all details, this could mean that our atomic data for Fe are inaccurate or that our approximations for example for the excited state ionisation cross-sections are too simple. In any case, the lack of reliable Co ii & iii data poses a serious problem for all SN Ia spectral calculations between maximum light and 150 days after the explosion before most of the Co has decayed into Fe. It has to be hoped that these data will be available in the near future.
At 338 days after the explosion the flux is dominated by Fe emission lines and the agreement of the synthetic and the observed spectrum is good. At those epochs the nebular spectra of ’normal’ SNe Ia are dominated by three prominent Fe features at roughly 4400, 4700 and 5300 Å. The Fe ’trident’ is shaped by the ionisation state of the Fe core, which strongly depends on both the density of the core and the ratio of radioactive and stable iron. Also mixing with light and intermediate mass elements can influence the relative abundance of Fe ions.
While the 4700 Å feature is dominated by [Fe iii] emission, the 4400 Å feature is made from [Fe i] and [Fe ii]. In our synthetic spectrum this feature is underestimated and it may well be that it contains more contribution from [Fe i] in the observed SNe Ia than predicted in our simulation. It is important to note that very small fractions of Fe i ( 0.01%) are sufficient to cause observable [Fe i] lines. Such small fractions of Fe i can survive even when Fe iii is present, strongly depending on photo-ionisation, recombination and possibly on charge exchange processes. This makes an accurate prediction of [Fe i] features difficult, at least at these epochs. The 5300 Å feature contains both [Fe ii] and [Fe iii] and shows also a [Fe i] contribution. There is almost no Co emission, except weak [Co iii] lines observed around 6000 Å and [Co ii] emission at about 10000 Å. Since we have no collision strengths for Co lines from the literature, their strength may be underestimated in our simulation. The RTJ and the RTM spectra of W7 at 338 days after the explosion are similar to the nero spectrum and are shown in the previous section.


4 Discussion
A comparison to the radiation transport code of Jerkstrand et al. (2011) has shown excellent agreement. This indicates that both codes work properly within the uncertainties of the atomic data. This is an interesting result, since they have been developed completely independent from each other and rely on a different numerical approach.
The comparison to the nebular code of Mazzali et al. (2001) has also shown acceptable agreement, especially for pure Fe cores, which is important for SNe Ia.
For SNe Ic, where several elements like C, O, Na, Mg, Si, S, Ca and Fe are important for the formation of the nebular spectra, we notice some differences. Most importantly, photo-ionisation influences the mass estimated for certain elements like Na and Mg. Also, there is some disagreement regarding the main properties of the SN core (total and 56Ni mass).
It is well known, that mixing or a separation of the elements on small or large scales in SN ejecta can have strong influence on the resulting nebular spectra. Since this paper intends to compare codes, we do not study this effect in detail. However, it was demonstrated that the uncertainty caused by the mixing of the ejecta is comparable to the uncertainty caused by using the different codes, at least for modelling SNe Ib/c. A treatment of the mixing problem in SNe II has been presented by Kozma & Fransson (1998); Jerkstrand et al. (2011). In ’normal’ SNe Ia this problem is less severe, since the core is dominated by 56Ni decay-products.
By comparing synthetic Ia spectra to observations of the proto-typical ’normal’ SN Ia 2005cf we have shown that the synthetic spectra produced with nero look reasonable and are likely reliable within the uncertainties of the atomic data. Most of the observed spectral features have been identified to result from either Fe or Co emission.
At epochs between 50 and 150 days after the explosion poorly known Co data pose severe problems for spectral modelling of SNe Ia. Atomic data are essential for calculating SN spectra. Especially for electron collisions of all kinds the available data are often inaccurate or incomplete.
Apart from time-dependent effects, nero treats all the radiation transport effects commonly thought to be important for the formation of SN spectra in full NLTE. Therefore, nero calculations are especially interesting for intermediate epochs, since so far SN spectral calculations at 50 200 days after the explosion have been extremely rare. Also, the nebular phase between roughly 200 and 500 days after the explosion can be studied.
Possibly, nero could be used to calculate (pre-) maximum spectra by imposing an estimated lower boundary flux at appropriate radii, as it is done in photospheric codes (Mazzali & Lucy, 1993, e.g.). With respect to purely photospheric codes, a treatment with nero would include the effect of net emission above the lower boundary, which could then be set at lower velocities than in previous approaches. This may increase the accuracy of the (quasi) photospheric approach considerably. We plan to investigate this possibility in the near future.
5 Summary and Conclusion
In this paper we presented a new NLTE radiation transport code, which can be used to calculate synthetic spectra for all types of SNe at intermediate and late epochs. Our treatment of intermediate epochs opens a new window for SN spectral analysis. Currently, nero is working in spherical symmetry, but a three-dimensional version may be available in the future. In its one-dimensional version the code can be used for spectral modelling of observed SN spectra or for calculating synthetic spectra of (approximately) spherically symmetric SN explosion models.
References
- Aldrovandi & Pequignot (1973) Aldrovandi S. M. V., Pequignot D., 1973, A&A, 25, 137
- Axelrod (1980) Axelrod T. S., 1980, Ph.D. thesis, AA(California Univ., Santa Cruz.)
- Bautista et al. (2009) Bautista M. A., Quinet P., Palmeri P., Badnell N. R., Dunn J., Arav N., 2009, A&A, 508, 1527
- Berrington (1988) Berrington K. A., 1988, Journal of Physics B Atomic Molecular Physics, 21, 1083
- Berrington et al. (1982) Berrington K. A., Fon W. C., Kingston A. E., 1982, MNRAS, 200, 347
- Callaway (1994) Callaway J., 1994, Atomic Data and Nuclear Data Tables, 57, 9
- Chugai (1987) Chugai N. N., 1987, Astrophysics, 26, 53
- de Kool et al. (1998) de Kool M., Li H., McCray R., 1998, ApJ, 503, 857
- Drake et al. (1969) Drake G. W., Victor G. A., Dalgarno A., 1969, Physical Review, 180, 25
- Eastman & Pinto (1993) Eastman R. G., Pinto P. A., 1993, ApJ, 412, 731
- Garavini et al. (2007) Garavini G., Nobili S., Taubenberger S., et al., 2007, A&A, 471, 527
- Hauschildt et al. (1997) Hauschildt P. H., Baron E., Allard F., 1997, ApJ, 483, 390
- Hayes & Nussbaumer (1984) Hayes M. A., Nussbaumer H., 1984, A&A, 134, 193
- Hillier & Miller (1998) Hillier D. J., Miller D. L., 1998, ApJ, 496, 407
- Jerkstrand et al. (2011) Jerkstrand A., Fransson C., Kozma C., 2011, ArXiv e-prints
- Kaplan et al. (1972) Kaplan S. A., Kleiman E. B., Oiringel I. M., 1972, Soviet Ast., 16, 241
- Kasen et al. (2006) Kasen D., Thomas R. C., Nugent P., 2006, ApJ, 651, 366
- Kjær et al. (2010) Kjær K., Leibundgut B., Fransson C., Jerkstrand A., Spyromilio J., 2010, A&A, 517, A51+
- Kozma & Fransson (1992) Kozma C., Fransson C., 1992, ApJ, 390, 602
- Kozma & Fransson (1998) Kozma C., Fransson C., 1998, ApJ, 496, 946
- Kromer & Sim (2009) Kromer M., Sim S. A., 2009, MNRAS, 398, 1809
- Kurucz & Bell (1995) Kurucz R., Bell B., 1995, Atomic Line Data (R.L. Kurucz and B. Bell) Kurucz CD-ROM No. 23. Cambridge, Mass.: Smithsonian Astrophysical Observatory, 1995., 23
- Li & McCray (1995) Li H., McCray R., 1995, ApJ, 441, 821
- Li & McCray (1996) Li H., McCray R., 1996, ApJ, 456, 370
- Lucy (1999) Lucy L. B., 1999, A&A, 345, 211
- Maeda et al. (2002) Maeda K., Nakamura T., Nomoto K., Mazzali P. A., Patat F., Hachisu I., 2002, ApJ, 565, 405
- Mauas et al. (1988) Mauas P. J., Avrett E. H., Loeser R., 1988, ApJ, 330, 1008
- Maurer & Mazzali (2010) Maurer I., Mazzali P. A., 2010, MNRAS, 408, 947
- Maurer et al. (2010a) Maurer I., Mazzali P. A., Taubenberger S., Hachinger S., 2010a, MNRAS, 409, 1441
- Maurer et al. (2010b) Maurer J. I., Mazzali P. A., Deng J., et al., 2010b, MNRAS, 402, 161
- Mazzali & Lucy (1993) Mazzali P. A., Lucy L. B., 1993, A&A, 279, 447
- Mazzali et al. (2010) Mazzali P. A., Maurer I., Valenti S., Kotak R., Hunter D., 2010, MNRAS, 408, 87
- Mazzali et al. (2001) Mazzali P. A., Nomoto K., Patat F., Maeda K., 2001, ApJ, 559, 1047
- Mazzotta et al. (1998) Mazzotta P., Mazzitelli G., Colafrancesco S., Vittorio N., 1998, A&AS, 133, 403
- Meléndez et al. (2007) Meléndez M., Bautista M. A., Badnell N. R., 2007, A&A, 469, 1203
- Minkowski (1941) Minkowski R., 1941, PASP, 53, 224
- Nomoto et al. (1984) Nomoto K., Thielemann F., Yokoi K., 1984, ApJ, 286, 644
- Pauldrach et al. (1996) Pauldrach A. W. A., Duschinger M., Mazzali P. A., Puls J., Lennon M., Miller D. L., 1996, A&A, 312, 525
- Rozsnyai et al. (1980) Rozsnyai B. F., Jacobs V. L., Davis J., 1980, Phys. Rev. A, 21, 1798
- Ruiz-Lapuente & Lucy (1992) Ruiz-Lapuente P., Lucy L. B., 1992, ApJ, 400, 127
- Sauer et al. (2006) Sauer D. N., Mazzali P. A., Deng J., Valenti S., Nomoto K., Filippenko A. V., 2006, MNRAS, 369, 1939
- Scholz et al. (1990) Scholz T. T., Walters H. R. J., Burke P. J., Scott M. P., 1990, MNRAS, 242, 692
- Seitenzahl et al. (2009) Seitenzahl I. R., Taubenberger S., Sim S. A., 2009, MNRAS, 400, 531
- Silverman et al. (2009) Silverman J. M., Mazzali P., Chornock R., et al., 2009, PASP, 121, 689
- Sim & Mazzali (2008) Sim S. A., Mazzali P. A., 2008, MNRAS, 385, 1681
- Swartz (1994) Swartz D. A., 1994, ApJ, 428, 267
- Turatto et al. (2007) Turatto M., Benetti S., Pastorello A., 2007, in Supernova 1987A: 20 Years After: Supernovae and Gamma-Ray Bursters, edited by S. Immler, K. Weiler, & R. McCray, vol. 937 of American Institute of Physics Conference Series, 187–197
- van Regemorter (1962) van Regemorter H., 1962, ApJ, 136, 906
- Wang et al. (2009) Wang X., Li W., Filippenko A. V., et al., 2009, ApJ, 697, 380
- Woosley et al. (1994) Woosley S. E., Eastman R. G., Weaver T. A., Pinto P. A., 1994, ApJ, 429, 300