Grid of Ly radiation transfer models for the interpretation of distant galaxies
Abstract
Context. Ly is a key diagnostic for numerous observations of distant star-forming galaxies. It’s interpretation requires, however, detailed radiation transfer models.
Aims. We provide an extensive grid of 3D radiation transfer models simulating the Ly and UV continuum radiation transfer in the interstellar medium of star-forming galaxies.
Methods. We have improved our Monte Carlo McLya code, and have used it to compute a grid of 6240 radiation transfer models for homogeneous spherical shells containing Hi and dust surrounding a central source. The simulations cover a wide range of parameter space. We present the detailed predictions from our models including in particular the Ly escape fraction , the continuum attenuation, and detailed Ly line profiles.
Results. The Ly escape fraction is shown to depend strongly on dust content, but also on other parameters (Hi column density and radial velocity). The predicted line profiles show a great diversity of morphologies ranging from broad absorption lines to emission lines with complex features. The results from our simulations are distributed in electronic format.
Conclusions. Our models should be of use for the interpretation of observations from distant galaxies, for other simulations, and should also serve as an important base for comparison for future, more refined, radiation transfer models.
Key Words.
Galaxies: starburst – Galaxies: ISM – Galaxies: high-redshift – Ultraviolet: galaxies – Radiative transfer1 Introduction
Stimulated by numerous observations of galaxies and the intergalactic medium (IGM) in the high redshift Universe, and made possible by significant growth of computational power, several groups have recently developed numerical codes treating the transfer of Ly radiation (Zheng & Miralda-Escudé 2002; Ahn et al. 2003; Dijkstra et al. 2006; Verhamme et al. 2006; Tasitsiomi 2006; Laursen & Sommer-Larsen 2007; Barnes & Haehnelt 2009, e.g.). Most of the codes use the Monte Carlo (MC) method to sample the radiation transfer. The main advantages of this technique is its ease in implementation, treatment of arbitrary geometries, and inclusion of different physical scattering and absorption processes. The codes have been applied to a variety of astrophysical problems, including e.g. cosmic reionisation, Ly fluorescence in the IGM, predictions of Ly emission from distant galaxies, and the interpretation of observed Ly line profiles from starburst galaxies (Cantalupo et al. 2005; Cantalupo et al. 2008; Semelin et al. 2007; Baek et al. 2009; Pierleoni et al. 2009; Barnes & Haehnelt 2010; Kollmeier et al. 2010; Laursen et al. 2011; Zheng et al. 2011).
Our group has recently developed a general 3D radiation transfer code including Ly and UV continuum radiation including scattering and absorption by neutral hydrogen and dust (Verhamme et al. 2006). So far, our code has mostly been applied to understand the diversity of observed Ly line profiles and to quantitatively exploit the Ly profile in Ly emitters (LAE) and Lyman Break Galaxies (LBG) (Schaerer & Verhamme 2008; Verhamme et al. 2008; Dessauges-Zavadsky et al. 2010; Vanzella et al. 2010, see) and for the modeling of local starburst galaxies (Atek et al. 2009b, cf.). In particular, we have shown that the observed diversity of line profiles reaching from broad absorption in some LBGs to asymmetric emission in LAEs, can be understood by variations of the Hi column density and dust content in spherically expanding shells. Furthermore our models also place interesting constraints on the intrinsic Ly emission properties, hence on age and star-formation history. For example, for LBGs we found no need for particular ages, and we showed that their intrinsic Ly equivalent widths are compatible with constant star-formation over several hundred Myr, as also indicated by their broad-band SEDs. Last, but not least, our simulations have clarified the relation between observed velocity shifts of Ly and ISM expansion velocities (Schaerer & Verhamme 2008; Verhamme et al. 2008, see).
These studies have been based on a relatively small number of simulations and tailored models to fit observations of less than twenty galaxies, albeit of different types. To explore a larger range of the parameter space, and to do this in a systematic way, allowing us also to examine possible degeneracies in Ly line profile fits, we have computed a large grid of radiation transfer models for homogeneous, spherically expanding shells. Our simulations cover a wide range of the 4-dimensional parameter space given by the expansion velocity, Hi column density, velocity dispersion (), and dust optical depth. From this, spectra can be predicted for any arbitrary input spectrum, containing e.g. a UV continuum plus intrinsic Ly emission from the central source.
To make these simulations feasible, we have parallelised our Monte Carlo code, named McLya. Furthermore we have added some new physics in the code, such as scattering by Deuterium and the recoil effect, and we have made other improvements (in particular on scattering by dust). Our standard code works on cartesian grids; a version using nested-grids, provided by AMR (Adaptive Mesh Refinement) codes has recently been developed by Verhamme et al. (in preparation). In addition we have developed an automated tool to fit observed Ly line profiles, making use of our grid of McLya simulations.
The description of the grid of UV and Ly radiation transfer simulations and some results derived from it, are the main objective of this paper. At the same time the model grid described here will be made available electronically.
Predictions from our model grid have already been used in several papers. For example, Atek et al. (2009a) compared predicted Ly escape fraction from our grid to measurements of this quantity in 0.2–0.4 galaxies, and Hayes et al. (2010); Hayes et al. (2011) have compared the same quantity to measurements at redshift and higher. In Dessauges-Zavadsky et al. (2010); Vanzella et al. (2010), we have used our fitting tool to analyse two individual LBGs at redshift and respectively. The predictions from our model grid have recently been included in the semi-analytical galaxy models of the Lyon group (Garel et al. 2011). Our predictions are also being used to prepare observations with future instruments, such as MUSE for the VLT (Garel et al., in preparation).
Our paper is structured as follows. In Sect. 2 we describe the main improvements implemented in our code. In Sect. 3 we summarise the input parameters and other issues for the computation of our models grid. Predictions for the Ly escape fraction and the strength of Ly absorption are shown in Sect. 4. In Sect. 5 we illustrate some line profiles predicted from our model grid. In Sect. 6 we summarise our main conclusions.
2 Update of the MCLya code
We have developed an improved version of the Monte Carlo radiation transfer code McLya of Verhamme et al. (2006) including the detailed physics of Ly line and UV continuum transfer, dust scattering, and dust absorption for arbitrary 3D geometries and velocity fields.
The following improvements have been included:
- •
Angular redistribution functions taking quantum mechanical results for Ly into account. More precisely we distinguish two different phase functions for scattering in the core and the wing, following Dijkstra & Loeb (2008). For the distinction between these two regimes we also use their value of , where is the frequency shift from line center expressed in Doppler units. In the wing, the phase function is identical to the one of dipolar (Rayleigh) scattering, adopted previously in our code for the computations of Verhamme et al. (2008). Although the differences in the phase functions are important for a proper treatment of polarised radiation (Dijkstra & Loeb 2008, cf.), we have not noticed changes in our predictions.
- •
Frequency changes of Ly photons due to the recoil effect (Zheng & Miralda-Escudé 2002, e.g.). Before, scattering was considered coherent in the atom’s frame. As well known, the recoil effect can lead to differences for very low temperatures, as shown e.g. by Zheng & Miralda-Escudé (2002); Tasitsiomi (2006).
- •
The presence of Deuterium. Following the suggestion of Dijkstra et al. (2006), Deuterium has been included, assuming a canonical abundance of . It’s effect may be visible for cases with a static ISM in the blue part of the line (Dijkstra et al. 2006, cf. Fig. 3 of). For expanding geometries, such as the ones discussed below, it’s effect becomes, however, very small or invisible.
- •
Anisotropic dust scattering using the Henyey-Greenstein phase function. We adopt the following values for the dust albedo and the scattering phase function asymmetry at Ly following Witt & Gordon (2000). In our previous computations we adopted and (isotropic dust scattering). Among the changes made, this improvement has the largest impact on the results since it leads to a more pronounced fore-aft symmetry for dust scattering, which in turn affects the escape fraction of photons both in the UV continuum and in the Ly line. For the spherical shell geometry considered below, this leads in general to somewhat higher escape fractions, i.e. less efficient dust attenuation.
- •
Finally, the code has been parallelised using OpenMPI, for efficient use on supercomputers. Given the use of the Monte Carlo method, parallelisation is basically trivial, and near-perfect scaling properties are achieved. Typically, we have run our simulations on 100-300 CPU cores in parallel.
The remaining input physics is described in Verhamme et al. (2006). We do not rely on approximations to accelerate the Ly transfer. Although we have experimented with some methods (Verhamme et al. 2006; Laursen et al. 2009a, e.g. those in), we have noted some differences in the resulting line profiles. Therefore, to avoid possible inaccuracies in our calculations exploring a large parameter space, we prefer to use a correct, “brute force” approach.
3 Grid of MCLya models
| Parameter | Values | |
|---|---|---|
| vexp | 0.,20., 50., 100., 150., 200., 250., 300., 400., 500., 600., 700. | 12 |
| 16., 18., 18.5, 19.,19.3,19.6,19.9,20.2,20.5,20.8,21.1,21.4,21.7 | 13 | |
| 10., 20., 40., 80., 160. | 5 | |
| 0., 0.2, 0.5, 1., 1.5, 2., 3., 4. | 8 |
For simplicity, and to provide a basis for other future studies, all simulations carried out subsequently assume a homogeneous and co-spatial distribution of neutral hydrogen and dust with a constant density and temperature. The effects of clumpy media are examined in an upcoming publication (Duval et al., in preparation). The input parameters of the code are the Hi geometry and velocity field, the microscopic Hi velocity distribution, the spatial location and distribution of the UV continuum and line emission source(s), and the dust-to-gas ratio.
For the current model grid we consider the following geometry: spherically symmetric shells with a central source UV source. This case is described by 4 parameters: (i) the radial expansion velocity of the shell, vexp, (ii) the Hi column density towards the source, , (iii) the microscopic Hi velocity distribution described by the Doppler parameter , and (iv) the dust absorption optical depth , which expresses the dust-to-gas ratio. As discussed by Verhamme et al. (2006) is related to the usual color excess by . For the Calzetti et al. (2000) law one has . In short, the present model grid is described by 4 input parameters vexp, , , and . By symmetry of the radiation transfer problem (Neufeld 1990; Verhamme et al. 2006; Dijkstra et al. 2006, cf.) our grid calculations also apply to the case of spherical infall. In other words models with a radial expansion velocity vexp also describe the case of spherical infall with .
Thanks to the parallelisation of the code, the computation of a large grid, covering a wide 4-dimensional parameter space, has been possible. The values adopted for the input parameters are listed in Table 1. Simulations have been run for all combinations, yielding in total 6240 models.
For each parameter set, a full Monte Carlo simulation is run with 1000 photons per input frequency bin. The radiation transfer calculations cover a sufficiently broad spectral range (here typically from to km s-1, in bins of 20 km s-1 for the input) to reach the continuum for most simulations (except for some of the highest column density simulations). As described in Verhamme et al. (2006), our MC simulations are computed for a flat input spectrum, keeping track of the necessary information to recompute a posteriori simulations for arbitrary input spectra. The total computing time required for the entire grid amounted to 25 CPU year.
In practice, the following quantities are stored for each emergent photon: input and output frequency, position and direction of escape. From this we can in particular compute the predicted emergent spectrum (integrated or spatially resolved spectra, spectral maps) and the escape fraction for all frequency bins. The detailed model results (approx. 60 GB) allowing one to compute emergent spectra are available on request from the first author11 1 See http://obswww.unige.ch/sfr or contact DS.. Derived quantities (the Ly escape fraction computed for different FWHM, the continuum escape fraction, and the equivalent width of the Ly absorption assuming a flat continuum, cf. below) for all models are provided in Table 2.
| vexp | FWHM(Ly) | EW | |||||
|---|---|---|---|---|---|---|---|
| [ km s-1] | [cm-2 ] | [km s-1] | [km s-1] | [Å] | |||
| 10. | 0.2 | 16.0 | 0. | 50. | 0.41473 | 0.84103 | -0.13742 |
| 10. | 0.2 | 16.0 | 0. | 100. | 0.57985 | 0.84103 | -0.13742 |
| 10. | 0.2 | 16.0 | 0. | 150. | 0.65799 | 0.84103 | -0.13742 |
| 10. | 0.2 | 16.0 | 0. | 200. | 0.70028 | 0.84103 | -0.13742 |


4 Predictions for the Ly escape fraction and related quantities
The total Ly escape fraction, , is defined as the ratio between the number of Ly line photons emitted, , by the UV source and the number of these photons, , emerging from the simulation box. The monochromatic escape fraction is given by , where is the “input” wavelength, i.e. that of the photons emitted from the source before being altered by radiation transfer. The total Ly escape fraction is
| (1) |
where the integration is carried out over the entire line profile of the “input” spectral line. In principle therefore depends on the emission line profile of the source. In practice, however, is close to the monochromatic escape fraction at line center for reasonable widths of the emission line profile (typically varies by less than 0.2 dex for FWHM(Ly) between 50 and 200 km s-1), since the resulting Hi absorption line profile is broader than FWHM for most column densities. In any case, we compute assuming a Gaussian emission line profile with varying FWHM(Ly) from 50 to 1000 km s-1 for various applications. These values are provided in Table 2.
4.1 Dependence of on the physical parameters
Since Ly photons can only be destroyed by absorption by dust particles, mainly depends on the dust optical depth, described here by . The predicted Ly escape fraction for all models is shown as a function of in Fig. 1 for lines with input FWHM km s-1. Here is derived from the escape fraction in the continuum near Ly, assuming and from the Calzetti et al. (2000) law. Very low escape fractions are obtained in some models. In such cases the line profiles are dominated by a broad absorption (Voigt-like profile) and no distinctive trace of the intrinsic Ly emission line is detectable. For this reason we limit our plots, somewhat arbitrarily, at . This limit also corresponds to our numerical limit on the escape fraction per frequency bin.
The Ly escape fraction has an upper limit of , corresponding to the pure attenuation of the continuum. Below this value we see that varies by several orders of magnitudes, when variations of the remaining parameters (vexp, , ) over a large range are allowed. In this case, multiple scattering effects of Ly on HI and on dust increase the probability of subsequent dust absorption of Ly photons, reducing therefore . For example, for a given (), increasing the HI column density, , leads to wide range of , allowing thus in particular low escape fractions. Similarly, a nearly static ISM (low expansion velocities vexp) leads to lower Ly escape fractions, when all other parameters are the same. In both cases the increase of and the decrease of vexp increases the number of Ly (and dust) scatterings due to radiation transfer effects, and hence the probability of absorption by dust for same radial dust optical depth. In particular we note that relatively low Ly escape fractions ( or less) can even be obtained in situations with very little dust ( 0.02), provided the ISM has low velocities with respect to the UV source.
In reality not all combinations of parameters may be realised. For example, the dust-to-gas ratio
| (2) | |||||
may be restricted within some range from the Galactic value cm-2 (Bohlin et al. 1978). As clear from Table 1, some of our models have extreme dust-to-gas ratios both above and below unity. In Figs. 1–4 we therefore distinguish with different colors the models which dust-to-gas ratios within a factor 10 (2) of the Galactic value, i.e. with [dust/gas] ([-0.3,0.3]), and the remaining models. Among the models with dust-to-gas ratios close to the Galactic value (within a factor 2; i.e. among the red points) we have further highlighted in blue models with a typical outflow velocity of vexp=200 km s-1 to illustrate how e.g. velocity affects the Ly escape fraction. The remaining spread in still shows how the other parameters (, ) affect the radiation transfer and hence the predicted Ly escape.


4.2 Ly absorption
Radiation transfer effects not only regulate the transmission of Ly line photons discussed above; they also affect the UV continuum photons, “carving” thus broad Ly absorption lines often observed in spectra of distant objects. Whereas scattering of photons out of the line-of-sight is principally at the origin of absorption lines of the Ly forest, true absorption by dust is the only processes capable of creating Ly absorption lines for the “closed” geometry and for integrated spectra we consider here (Verhamme et al. 2006, cf.).
In Fig. 3 we show the predicted equivalent width of Ly absorption () from our model grid as a function of the Hi column density. Here has been computed assuming a constant (flat) UV spectrum and measuring over the interval [-6000,6000] km s-1 covered by our models22 2 For the highest column densities, the Ly line is broader than this. Measuring over [-10000,10000] km s-1 instead, increases by 10–20 %.. Dust-free models show 33 3 Few models show but close to zero. This is due to numerical noise., whereas otherwise increases broadly with , as expected. For a given column density, the strength of the Ly absorption increases with increasing dust-to-gas ratio (coded in color). It also depends on the other parameters affecting the radiation transfer, here mostly vexp.
For comparison, computed from Voigt profiles as function of and (in the same fashion, i.e. over [-6000,6000] km s-1) are shown by dotted lines in Fig. 3. As discussed by Verhamme et al. (2006) and shown e.g. from detailed line profile fitting by Dessauges-Zavadsky et al. (2010), radiation transfer models for the geometry adopted here predict in some cases weaker Ly absorption than expected for deduced by simple Voigt profiles. In other words, if applicable, our geometry could imply that measured from pure Voigt profile fits are underestimated. However, the precise amount of this difference depends on the value adopted for the Voigt fits, on the dust-to-gas-ratio, and on other parameters.
Overall we note that the strength of the Ly absorption predicted by our model grid covers well the range of observed values in Lyman Break Galaxies (LBGs), with equivalent widths down to -20 to -30 Å (Shapley et al. 2003, e.g.).
As expected, there is no strong correlation between the escape fraction of Ly line photons and (see Fig. 4). The former measures the transmission of the photons close to line center, the latter is an overall measure of the net transmission of the UV flux. Therefore it is clear that cases with a strong absorption line () also show a low Ly escape fraction. However, for some models with low Hi column densities and high dust-to-gas ratios can be quite low, but their overall absorption remains weak ( to 0 Å). These models, e.g., occupy the lower right corner of Fig. 4. Overall, models with a large EW in absorption correspond to high column densities (cf. Fig. 3). As the Ly escape fraction mostly reflects the transmission of photons close to line center, decreases more rapidly than the equivalent width of the absorption line increases (in absolute terms). This explains the near vertical behaviour of the sequences of constant shown in Fig. 4.
Since in reality, the intrinsic UV spectrum of star-forming galaxies is in general composed of a UV continuum plus Ly emission (see e.g. Schaerer & Verhamme 2008, for synthetic spectra in this region), Fig. 4 schematically shows how the two components (line and continuum) are affected by radiation transfer effects. Approximately, the resulting emergent line is then the superposition of the absorption carved from the continuum plus the remainder of the transmitted Ly emission line (with a positive equivalent width). To predict the detailed shape Ly profile, showing a complex diversity as e.g. shown by Verhamme et al. (2006); Schaerer & Verhamme (2008); Dessauges-Zavadsky et al. (2010); Vanzella et al. (2010), the full results from our radiation transfer simulations need to be used. We now briefly illustrate some profiles and variations with the model parameters.


5 A library of theoretical Ly line profiles
As already mentioned, the results from our radiation transfer models can be used to compute a posteriori the predicted spectrum around Ly for any arbitrary input spectrum. To illustrate some Ly line profiles predicted by our extensive model grid, we show few selected results computed for a continuum plus Ly emission, assuming FWHM km s-1 and Å (except mentioned otherwise), and plotted for a spectral resolution of 150 km s-1.
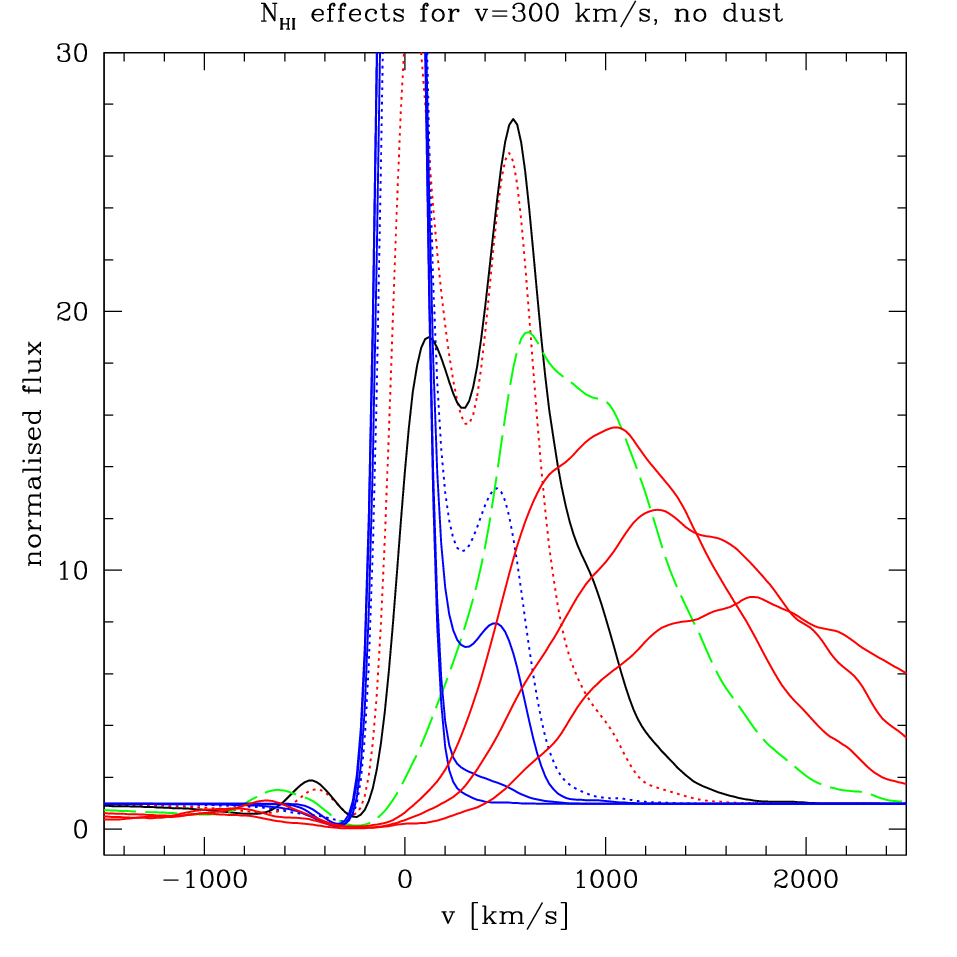
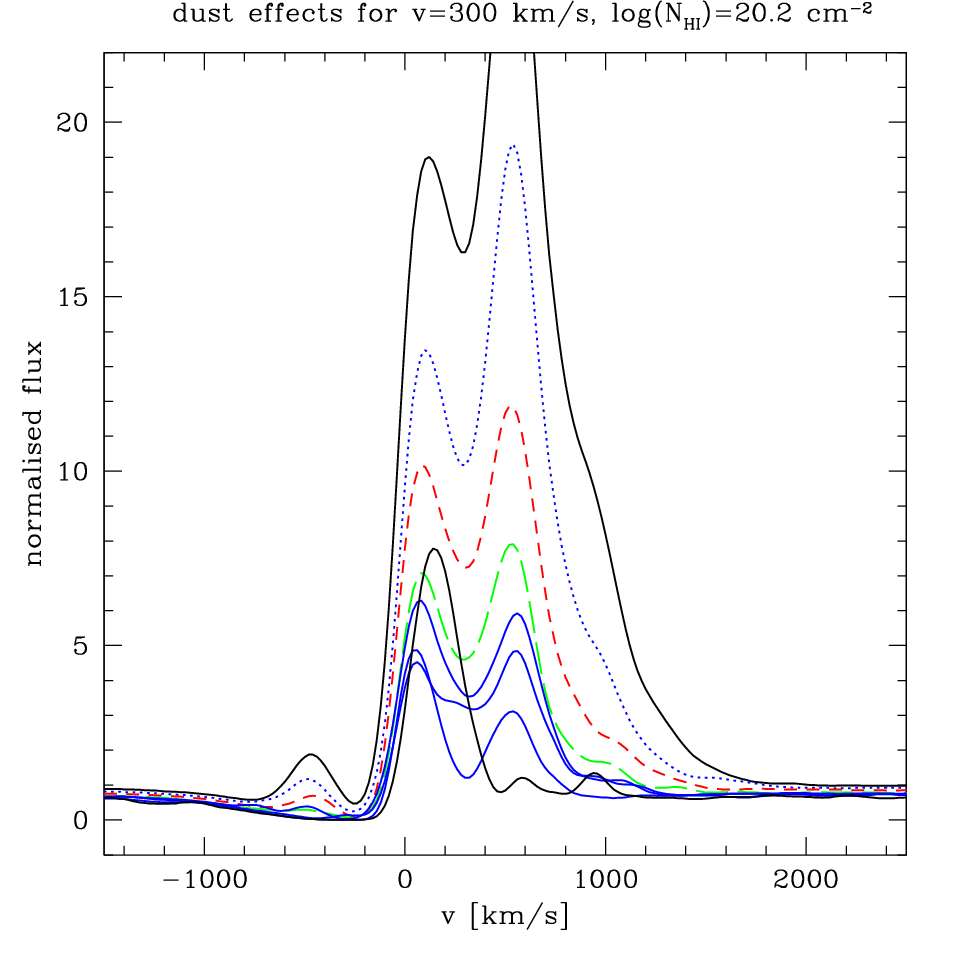
In Fig. 5 we show simulations for a rapidly expanding shell ( km s-1, assuming km s-1) with varying Hi column densities (left panel), and varying dust content (right panel). Both panels are similar to Figs. 16 and 17 of Verhamme et al. (2006), but we here show the predictions for a wider parameter space. Qualitatively the behaviour is as discussed and explained by Verhamme et al. (2006). In particular, for models with different column densities, it is seen that the position of the most prominent peak of the profile shifts to for cm-2 (left panel). For the highest column densities the profile becomes very flat and broad, extending to very high velocities ( km s-1). The right panel illustrates the effect of dust (absorption) optical depths up to . While to first order the profile shape remains similar (when renormalised) but somewhat “sharpened” for relatively low optical depths (Verhamme et al. 2006; Verhamme et al. 2008; Laursen et al. 2009b, , cf.), the overall shape of the profile can be more significantly altered at higher optical depths. Here, e.g., the main peak gets nearly destroyed for .
Fig. 6 shows the line profile from an outflow with km s-1, a relatively high column density ( cm-2), and for varying dust content ( to 4.). Note how the increasing dust content progressively reduces the line to “carve” out a damped (Voigt-like) profile for the highest dust contents. Such damped profiles with some remaining Ly emission in the wings have e.g. been observed for relatively dusty LBGs such as cB58 and the 8 o’clock arc, which have successfully been modeled with simulations from this grid (Schaerer & Verhamme 2008; Dessauges-Zavadsky et al. 2010, cf.).
As a final illustration of the large parameter space covered by our models, we show in Fig. 7 how the Ly profile varies with shell velocity in a very dusty, large column density environment. As expected, an emission line emerges out of the damped profile seen for a static shell (black) when the shell has a net radial flow velocity, and quite rapidly the profile becomes resembles a P-Cygni profile with blue shifted absorption and redshifted emission, with the complex detailed shape whose origin has been discussed in Verhamme et al. (2006).
Again, note that our results also apply for symmetry reasons to models with spherical infall instead of outflows. In this case the predicted line profiles are simply inverted in velocity space.
To make efficient use of this large spectral library we (MH) have also developed an automatic fitting tool, which has already been applied in Dessauges-Zavadsky et al. (2010); Vanzella et al. (2010); Lidman et al. (2011). Other applications will be presented elsewhere.
6 Conclusions
We have improved our 3D Ly and UV continuum radiation transfer code McLya (Verhamme et al. 2006) and parallelised it for efficient use. Using this code we have computed a large grid of radiation transfer models for homogeneous spherically expanding (and by symmetry also infalling) shells containing Hi and dust surrounding a central source. With 6240 simulations, the grid covers a large parameter space with radial velocities from 0 to 700 km s-1, neutral hydrogen column densities from to cm-2, Doppler parameters to 160 km s-1, and dust optical depths to 4 (corresponding approximately to 0.4).
From the simulations we determine the predicted Ly escape fraction, the UV continuum attenuation, and we illustrate some of the Ly line profiles which are predicted by these models. The model predictions provide a useful basis for the interpretation of Ly observations (line fluxes, escape fractions, equivalent widths, detailed line profiles and others) from star-forming galaxies, including Lyman alpha emitters (LAEs), Lyman break galaxies (LBGs) and others. The models have already been successfully applied and confronted to a variety of observations (Atek et al. 2009a; Hayes et al. 2010; Hayes et al. 2011; Vanzella et al. 2010; Dessauges-Zavadsky et al. 2010; Garel et al. 2011, see e.g.) and are now made available publicly.
Our models should also serve as an important base for comparison for future models including other refinements (e.g. other geometries and velocity fields, non-homogeneous media) and further improvements.
Acknowledgements.
Simulations were done on the regor PC cluster at the Geneva Observatory co-funded by grants to Georges Meynet, Daniel Pfenniger, and DS, and on the Bull platine at the CEA. We would like to thank the granted access to the HPC resources of CINES and CCRT under the allocations 2009-SAP2191 and 2010-GEN2192 made by GENCI. The work of MH, DS, and AV was supported by the Swiss National Science Foundation.References
- Ahn et al. (2003) Ahn, S.-H., Lee, H.-W., & Lee, H. M. 2003, MNRAS, 340, 863
- Atek et al. (2009a) Atek, H., Kunth, D., Schaerer, D., et al. 2009a, A&A, 506, L1
- Atek et al. (2009b) Atek, H., Schaerer, D., & Kunth, D. 2009b, A&A, 502, 791
- Baek et al. (2009) Baek, S., Di Matteo, P., Semelin, B., Combes, F., & Revaz, Y. 2009, A&A, 495, 389
- Barnes & Haehnelt (2009) Barnes, L. A. & Haehnelt, M. G. 2009, MNRAS, 397, 511
- Barnes & Haehnelt (2010) Barnes, L. A. & Haehnelt, M. G. 2010, MNRAS, 403, 870
- Bohlin et al. (1978) Bohlin, R. C., Savage, B. D., & Drake, J. F. 1978, ApJ, 224, 132
- Calzetti et al. (2000) Calzetti, D., Armus, L., Bohlin, R. C., et al. 2000, ApJ, 533, 682
- Cantalupo et al. (2008) Cantalupo, S., Porciani, C., & Lilly, S. J. 2008, ApJ, 672, 48
- Cantalupo et al. (2005) Cantalupo, S., Porciani, C., Lilly, S. J., & Miniati, F. 2005, ApJ, 628, 61
- Dessauges-Zavadsky et al. (2010) Dessauges-Zavadsky, M., D’Odorico, S., Schaerer, D., et al. 2010, A&A, 510, A26+
- Dijkstra et al. (2006) Dijkstra, M., Haiman, Z., & Spaans, M. 2006, ApJ, 649, 14
- Dijkstra & Loeb (2008) Dijkstra, M. & Loeb, A. 2008, MNRAS, 386, 492
- Garel et al. (2011) Garel, T., Blaizot, J., Guiderdoni, B., Schaerer, D., & Verhamme, A. 2011, MNRAS, submitted
- Hayes et al. (2010) Hayes, M., Östlin, G., Schaerer, D., et al. 2010, Nature, 464, 562
- Hayes et al. (2011) Hayes, M., Schaerer, D., Ostlin, G., et al. 2011, ApJ, 730, 8
- Kollmeier et al. (2010) Kollmeier, J. A., Zheng, Z., Davé, R., et al. 2010, ApJ, 708, 1048
- Laursen et al. (2009a) Laursen, P., Razoumov, A. O., & Sommer-Larsen, J. 2009a, ApJ, 696, 853
- Laursen & Sommer-Larsen (2007) Laursen, P. & Sommer-Larsen, J. 2007, ApJ, 657, L69
- Laursen et al. (2009b) Laursen, P., Sommer-Larsen, J., & Andersen, A. C. 2009b, ApJ, 704, 1640
- Laursen et al. (2011) Laursen, P., Sommer-Larsen, J., & Razoumov, A. O. 2011, ApJ, 728, 52
- Lidman et al. (2011) Lidman, C., Hayes, M., Jones, D., et al. 2011, MNRAS, submitted
- Neufeld (1990) Neufeld, D. A. 1990, ApJ, 350, 216
- Pierleoni et al. (2009) Pierleoni, M., Maselli, A., & Ciardi, B. 2009, MNRAS, 393, 872
- Schaerer & Verhamme (2008) Schaerer, D. & Verhamme, A. 2008, A&A, 480, 369
- Semelin et al. (2007) Semelin, B., Combes, F., & Baek, S. 2007, A&A, 474, 365
- Shapley et al. (2003) Shapley, A. E., Steidel, C. C., Pettini, M., & Adelberger, K. L. 2003, ApJ, 588, 65
- Tasitsiomi (2006) Tasitsiomi, A. 2006, ApJ, 645, 792
- Vanzella et al. (2010) Vanzella, E., Grazian, A., Hayes, M., et al. 2010, A&A, 513, A20+
- Verhamme et al. (2008) Verhamme, A., Schaerer, D., Atek, H., & Tapken, C. 2008, A&A, 491, 89
- Verhamme et al. (2006) Verhamme, A., Schaerer, D., & Maselli, A. 2006, A&A, 460, 397
- Witt & Gordon (2000) Witt, A. N. & Gordon, K. D. 2000, ApJ, 528, 799
- Zheng et al. (2011) Zheng, Z., Cen, R., Trac, H., & Miralda-Escudé, J. 2011, ApJ, 726, 38
- Zheng & Miralda-Escudé (2002) Zheng, Z. & Miralda-Escudé, J. 2002, ApJ, 578, 33