Evidence for the narrow state at 1650 MeV in the photoproduction of
Abstract
We have investigated the existence of the narrow resonance predicted by the chiral soliton model by utilizing the kaon photoproduction process . For this purpose we have constructed two phenomenological models based on our previous effective Lagrangian model, which are able to describe kaon photoproduction from threshold up to MeV. By varying the mass (width) of an inserted resonance from 1620 to 1730 MeV (0.1 to 1 MeV and 1 to 10 MeV) a number of fits has been performed in order to search for the resonance mass. Our result indicates that the most promising candidate mass (width) of this resonance is 1650 MeV (5 MeV). Although our calculation does not exclude the possibility of narrow resonances with masses of 1680, 1700 and 1720 MeV, the mass of 1650 MeV is obtained for all phenomenological models used in this investigation. Variations of the resonance width and branching ratio are found to have a mild effect on the . The possibility that the obtained result originates from other resonance states is also discussed.
pacs
13.60.Le, 13.30.Eg, 25.20.Lj, 14.20.GkI Introduction
The ten members of the antidecuplet baryons predicted by the chiral quark soliton model (QSM) have drawn considerable attention for more than a decade. According to their strangeness and isospin these baryons can be organized as in Fig. 1. Among them three are exotic in the sense that their quantum numbers can be only built from 5 quarks, whereas the simplest states are clearly the two nonstrange nucleon resonances with indicated by in the figure. It is interesting to learn that the mass of 1710 MeV was originally assigned by Diakonov, Petrov, and Polyakov [1] to these nonstrange antidecuplet members since at the time the Particle Data Group (PDG) [3] reported the resonance partial decay widths similar to those predicted by the QSM, i.e., strong decay to the channel, whereas decays to the and channels are relatively small, but comparable. Moreover, the total width of the reported by the PDG was uncertain [3].
Immediately after experimental observations of the exotic baryons [4] and [5] had been reported, Walliser and Kopeliovich [2] found that the mass splitting within the baryon antidecuplet in Ref. [1] is overestimated by more than a factor of 1.5. By taking into account the SU(3) configuration mixing Walliser and Kopeliovich obtained the mass of the should be either 1650 MeV or 1660 MeV, depending on whether a certain symmetry breaker (called in Ref. [2]) is considered or not, respectively. We note that the agreement with experimental data is significantly improved if the symmetry breaker is included in the calculation. In other words, within the topological soliton model of Walliser and Kopeliovich, experimental data prefer 1650 MeV for the mass of the .
Not long after the finding of Walliser and Kopeliovich, Diakonov and Petrov [6] reevaluated the mass of the in Ref. [1] by using masses of these exotic baryons as inputs. It was found that the mass of the nonstrange member of this antidecuplet should be 1647 MeV if the possible mixing with lower-lying nucleonlike octet was not considered, but if the mixing was included the mass might shift upward to 1690 MeV. The width of the narrow resonance was originally estimated to be 41 MeV [1]. However, from an analysis of the data, it was suggested the existence of a new narrow state with very small branching [7].
The large branching ratio predicted by the QSM has sparked considerable interest in reevaluation of the photoproduction at energies around 1700 MeV. It was then reported that the cross section for the production off a free neutron is experimentally found to have a substantial enhancement at MeV [8]. This result has been confirmed by experiments of other collaborations [9]. Such enhancement is absent or very weak in the case of free proton. Clearly, the enhancement could be explained as the presence of the narrow resonance [10]. However, different explanations are also possible. Within an SU(3) coupled channels model [11] the phenomenon can be described as the contributions of the and loops. Due to the cancellation with contributions from other channels, this cross section enhancement does not exist in the process. On the other hand, the Giessen group interpreted this enhancement as an interference effect between the and states [12]. The situation became more complicated as Ref. [13] found that this enhancement could be generated by other resonance states with different parities and spins.

In the sector there is only one notable study of this resonance [7]. In this study the narrow mass is obtained from data by using a modified partial wave analysis (PWA), since the standard PWA can miss narrow resonances with MeV [7, 14]. The changes in the total were scanned in the range of resonance mass between 1620 to 1760 MeV after the inclusion of this resonance in the partial wave. A clear effect was observed at 1680 MeV and a weaker one was detected at 1730 MeV. The same result was always obtained although the total width was varied between 0.1 and 10 MeV and branching ratio was also varied between 0.1 and 0.4.
To our knowledge there has been no attempt to study this resonance by utilizing kaon photoproduction, although kaon photoproduction could offer a new arena for investigating this problem due to the explicit presence of strangeness in the final state. As stated above, the and branching ratios are predicted by the QSM to be comparable [1]. Partial wave analysis of the data yields the value of MeV, whereas theoretical analysis based on soliton picture results in (1.56) MeV for (1730) MeV [7]. In view of this we decide to follow the procedure developed in Ref. [7], i.e., we shall scan the changes in the total after including a narrow resonance with the variation of the resonance mass, width, and branching ratio. Such a procedure is apparently suitable for kaon photoproduction, since the cross sections are relatively much smaller than in the case of or , whereas the experimental error bars are in general relatively larger. As we can see in the next section, it is difficult to observe a clear structure in the cross sections at the energy of interest.
In spite of the difficult situation in kaon photoproduction, the accuracy of phenomenological model used in this study is crucial. Since the energy of interest is very close to the threshold, an accurate model that can describe experimental data at low energies would be much better for this purpose, rather than a global model that fits to a wide energy range but tends to overlook the appearing small structures near threshold. Therefore, in this paper we shall start with the model developed in our previous analysis [15]. Because the model was constructed to explain experimental data only up to 50 MeV above the threshold, an extension of energy coverage is mandatory. In Ref. [7] the change of was investigated up to MeV. Although we could in principle take 1760 MeV as the upper limit of our extended model, at MeV the problem of data discrepancy, between SAPHIR and CLAS data, starts to appear in the photoproduction [16]. Extending the model beyond MeV results in a large , which is obviously not suitable for the present purpose. On the other hand, as discussed above, Ref. [7] found that the most convincing mass of the narrow resonance is 1680 MeV. Therefore, we believe that it is sufficient to extend the model up to MeV and study the interval between threshold and MeV. This argument is also supported by the fact that no hadronic form factor is required to explain data up to this point, which is more favorable since it can simplify the reaction amplitudes and simultaneously reduce the number of uncertainties in the model. As shown in Ref. [17], the inclusion of this form factor leads to the problem of gauge invariance in the amplitude and, therefore, needs a proper treatment for restoring the gauge invariance.
This paper is organized as follows. In Section II we shall discuss the extension of our photoproduction model. Section III presents and discusses the result of our search for the narrow resonance. In Section IV, we give a brief discussion on the possibility that the obtained resonance is not a state. In Section V we summarize our work and conclude our findings.
II Extending the photoproduction model
II.1 The model
Our previous model [15] was constructed from the standard -, -, and -channel Born terms along with the and -channel vector mesons. To improve the agreement with experimental data, an hyperon resonance was also added to the background amplitude. In the -channel term only the resonance state was included, since between threshold and the upper energy limit ( MeV) only this resonance may exist. To facilitate the following discussion we need to present the corresponding resonant electric multipole from our previous analysis, i.e.,
| (1) |
where , the total c.m. energy, the total width, the physical mass, and the phase angle. The energy dependent partial width is related to the single kaon branching ratio via , with and the total width and kaon c.m. momentum at , respectively. The explanation of other factors in Eq. (1) can be found in Ref. [15]. The available experimental data from threshold up to MeV were fitted by adjusting the coupling constants of the , , and intermediate states, as well as the phase angle of the resonance. Note that the older versions of SAPHIR data [18] were omitted from our database since the latest version [19] has better statistics and comes from the same experiment as the older ones. Furthermore, the leading coupling constants were fixed to the SU(3) prediction, i.e. and , whereas except for the resonance phase angle, all resonance parameters of the were taken from the PDG values [20].
Compared to older analyses of kaon photoproduction, the result of the fits showed a much better agreement with experimental data considered. It was also found that the pseudoscalar coupling yields a more significant improvement than the pseudovector one, especially in the case of the total and differential cross sections.
For the purpose of the present calculation we have to extend this model in order to take into account higher energy data since the QSM [1, 2] predicts the nonstrange member of the antidecuplet to have a mass between 1650 and 1690 MeV. However, the latest calculation from the GWU group found that the most promising candidate mass is 1680 MeV, although another weak signal at 1730 MeV is not excluded. Therefore, it is sufficient to extend our previous model up to MeV. In the energy range between reaction threshold and 1730 MeV we observe that there exist 6 nucleon resonances listed in the recent Particle Data Book [20]. Their properties relevant to the present work are summarized in Table 1.
| Resonance | Overall | Status | |||||
|---|---|---|---|---|---|---|---|
| (MeV) | (MeV) | (GeV-1/2) | (GeV-1/2) | status | seen in | ||
| - | **** | *** | |||||
| **** | * | ||||||
| - | **** | ||||||
| *** | ** | ||||||
| - | *** | ** | |||||
| **** | ** |
We also note that there is no resonance state listed in the Particle Data Book between 1720 MeV and 1900 MeV. Therefore, we are convinced that it is sufficient to extend the model up to MeV. It is also important to mention here that the problem of data discrepancy between SAPHIR [19] and CLAS [22] data starts to appear at this energy (see Ref. [16] for a thorough discussion on this problem).
In the extended model we maintain the background terms as in our previous work [15], but in the resonance terms we include all six resonance states listed in Table 1. Since the number of experimental data considered in the present work (704 points) is much larger than that in the previous work (139 points) it is important to relax the coupling constants restriction in order to achieve an acceptable in our fits. Thus, for instance, we allow the main coupling constants to vary within the allowed SU(3) values, assuming the SU(3) symmetry is broken at the level of 20%, i.e., and . At this stage it is important to note that in the energy of interest the hadronic form factors are not required for the background terms. This fact reduces the level of uncertainty and complexity in our model since the problem of gauge invariance due to the inclusion of hadronic form factors does not exist.
From Table 1 it is apparent that the values of photon helicity amplitudes and are unfortunately not accurate, in spite of the fact that the values directly control the magnitude of resonance contributions to the scattering amplitude as can be clearly seen in Eq. (1). In order that the results of the present work do not to dramatically differ from those of our previous analysis, where almost all resonance parameters were fixed to the PDG values, in the first model (Model 1) we restrict the maximum variation of the photon amplitudes during the fitting process to 10% of the original PDG values. In contrast to this, the variation of other parameters such as masses and total widths given in the Particle Data Book is mostly smaller than 10%. Therefore, in the latter we vary the parameters within the allowed values given in the Particle Data Book.
In the second model (Model 2) we do not constraint the variation of the resonance parameters as strict as in Model 1, i.e., all parameters are allowed to vary within the PDG error bars. Although we prefer Model 1 which retains the consistency with our previous analysis, Model 2 will be useful in the present work once we want to investigate the model dependence of the mass determination of the narrow resonance in the next section.
| Fit parameters | Model 1 | Model 2 | Kaon-Maid |
| - | |||
| (MeV) | 1645 | 1670 | - |
| (MeV) | 145 | 164 | - |
| ( GeV-1/2) | 58 | 69 | - |
| 0.031 | 0.031 | - | |
| (deg) | 176 | 195 | - |
| (MeV) | 1680 | 1670 | - |
| (MeV) | 165 | 134 | - |
| ( GeV-1/2) | 17 | 13 | - |
| ( GeV-1/2) | 17 | 24 | - |
| 0.019 | 0.010 | - | |
| (deg) | 11 | 34 | - |
| (MeV) | 1680 | 1680 | - |
| (MeV) | 140 | 140 | - |
| ( GeV-1/2) | - | ||
| ( GeV-1/2) | 120 | 121 | - |
| 0.000 | 0.000 | - | |
| (deg) | 185 | 219 | - |
| (MeV) | 1750 | 1675 | - |
| (MeV) | 50 | 82 | - |
| ( GeV-1/2) | - | ||
| ( GeV-1/2) | 22 | - | |
| 0.050 | 0.010 | - | |
| (deg) | 107 | 191 | - |
| Fit parameters | Model 1 | Model 2 | Kaon-Maid |
| (MeV) | 1690 | 1699 | - |
| (MeV) | 98 | 174 | - |
| ( GeV-1/2) | 10 | 31 | - |
| 0.140 | 0.140 | - | |
| (deg) | 88 | 98 | - |
| (MeV) | 1700 | 1700 | - |
| (MeV) | 150 | 150 | - |
| ( GeV-1/2) | 18 | - | |
| ( GeV-1/2) | - | ||
| 0.048 | 0.048 | - | |
| (deg) | 195 | 191 | - |
| 859 | 704 | - |
II.2 Numerical results and comparison with data
The numerical results of the fits are shown in Table 2, where the background coupling constants of Kaon-Maid [21] are also listed for comparison. Obviously, the variation of the coupling constants between Model 1 and Model 2 is less dramatic than between the two models and Kaon-Maid. Nevertheless, except for the coupling, the sign of all coupling constants within the three models is clearly consistent. In the literature, the variation of these coupling constants is a long standing problem. Although Kaon-Maid was fitted to different experimental data set and has different resonance configuration as compared to the present work, Table 2 indicates that there is a tendency that the variation starts to converge.
Contribution of the background and resonance terms in the two models are exhibited in Fig. 2. It is obvious that the characteristic of resonance contributions can be comprehended from the values of kaon branching ratio and photon helicity amplitudes and given in Table 2. The two models show the same dominance of the background terms and the same large contribution of the resonance. The differences between them appear at relatively higher energies. The background contribution of Model 2 is somewhat suppressed at this kinematics in order to compensate contributions of the , and resonances that tend to increase. From Fig. 2 (as well as Table 2) it is also seen that the peak of the contribution is shifted to higher energy in Model 2. It is obvious that Model 1 is more consistent with our previous multipole analysis [16], i.e., the resonance contributes significantly, in contrast to the .


A comparison between the predicted total cross section from the two models as well as from the Kaon-Maid and the available experimental data from SAPHIR [19] and CLAS [22] collaborations is shown in Fig. 3. It is clear that both Model 1 and Model 2 show a better agreement than the Kaon-Maid, although at very high energy ( GeV) the total cross section predicted by Model 1 starts to increase, in contrast to the prediction of Model 2. This is understood from the fact that at this energy regime contribution of the background terms in Model 1 is substantially larger than that in Model 2.

The angular distribution of the calculated differential cross sections is exhibited in Fig. 4. Within the error bars of the available experimental data we can say that all models work nicely in this case. Ideally, a full angular distribution of experimental data, such as the SAPHIR one, is desired for improving the model. Unfortunately, at forward angles SAPHIR data differ from CLAS data (see, e.g., panels with and 1.715 GeV). Our models tend to approach the SAPHIR data, presumably due to their smaller error bars. In the case of Kaon-Maid model, the agreement with SAPHIR data is understandable because the model was fitted to the previous version of SAPHIR data [27], which are still consistent with the later version [19].


The energy distribution of differential cross sections for 20 different angle bins is shown in Fig. 5. The calculated cross sections of Model 1 and Model 2 are almost identical except at very forward angles and near with GeV. The agreement of both models with experimental data is clearly better than in the case of Kaon-Maid. Although the experimental data do not show a clear resonance-like structure, a slight bump at GeV can be observed. We note that within the error bars of the PDG resonance masses, all resonances considered in the present analysis could contribute to this bump. Besides that, the fact that threshold energies of all four photoproductions are around 1.690 GeV, as shown in Table 3, could also be the origin of this bump. Thus, we may conclude that an accurate extraction of resonance properties from kaon photoproduction at this energy point (1.690 GeV) would be a daunting task. The same situation could also happen at 1.720 GeV, at which both and photoproduction have their thresholds.
| No. | Channel | (MeV) | (MeV) | |
|---|---|---|---|---|
| 1 | 1046 | 1686 | ||
| 2 | 1048 | 1687 | ||
| 3 | 1052 | 1691 | ||
| 4 | 1051 | 1690 | ||
| 5 | 1096 | 1714 | ||
| 6 | 1109 | 1721 |
The recoil polarization displayed in Fig. 6 reveals an interesting phenomenon, especially at GeV (see Fig. 16 in the next section for the energy distribution of this structure). The present analysis, as well as the Kaon-Maid model, cannot reproduce the CLAS2010 data at this energy. We believe that, assuming the data are accurate, such a structure cannot originate from an established nucleon resonance, since PDG does not listed any single resonance at GeV. Since the polarization should be zero at threshold, such an obvious structure 15 MeV above the threshold requires special mechanism in the background terms that could dramatically change the polarization slightly above the production threshold. The probability that a ”missing resonance” could solve this problem is very unlikely, since the cross sections shown in Figs. 3 and 5 do not indicate any structure at this energy region. At this stage we would just mention that future experimental and theoretical studies should address this problem as an important topic, since the polarization is automatically given in the kaon photoproduction experiments and, on the other hand, problems at the production threshold can be better solved by a more consistent mechanism such as chiral perturbation theory.
The photon-, target-, and double-polarization observables , , , , are shown in Figs. 7 and 8. It is clear from these figures that both Model 1 and Model 2 can nicely describe the experimental data, although we should admit that Model 2 can reproduce the photon asymmetry data better than Model 1 due to its smaller .
III Search for a narrow resonance in kaon photoproduction
Having extended our photoproduction model up to MeV, we are ready now to study the possibility of observing a narrow resonance in the process. As discussed in the Introduction, in Ref. [7] an attempt to find the existence of a narrow state was performed by including such a state in the partial wave . The change of overall was scanned from to 1760 MeV. In the present work we follow this method, i.e., we include an extra narrow resonance state in the kaon photoproduction amplitude and scan the changes in the total after the inclusion, in the energy range where our model is valid, i.e., to 1730 MeV. Note that we do not start the scan from MeV, since the cross section at this threshold energy is very small, while experimental data have very large error bars (see the first panel of Fig. 4). As a consequence, predictions of our model at this kinematics would be less reliable. The same behavior is also observed at the upper energy limit of the present analysis (1730 MeV).
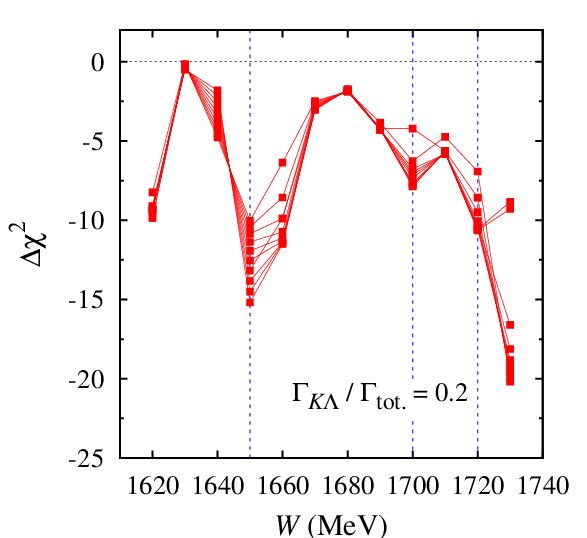
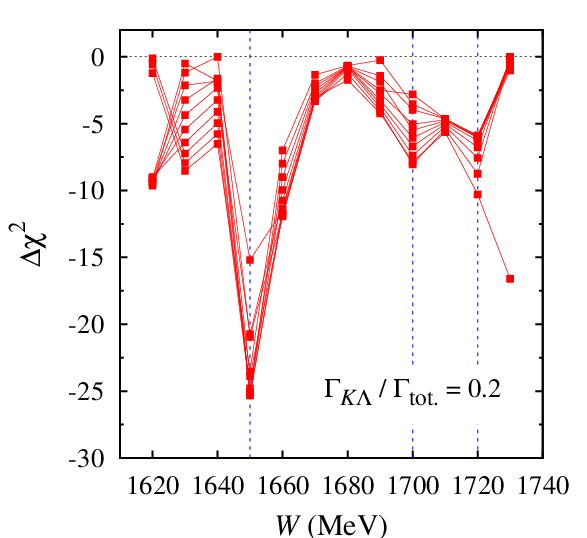
Figure 9 displays the result of changes () after the inclusion of an extra resonance in Model 1 with the mass scanned from 1620 to 1730 MeV, where the total width is varied from 1 to 10 MeV with 1 MeV step. Although not shown in the figure, we have also investigated the effect of the variation of branching ratio and found only a small effect on the . From Fig. 9 we can see that three minima appear at , 1700, and 1720 MeV. Nevertheless, the minimum at MeV seems to be the most convincing one. For all values of the branching ratio investigated in this study the lowest values of can be obtained by using MeV. Variation of the total width results in a variation of the value.
As in Ref. [7], we have also repeated our calculation by using the total width varying from 0.1 to 1 MeV with 0.1 MeV step. The result is shown in Fig. 10. Although the absolute values of obtained in this case are significantly different from those in the previous case, the similar pattern still appears. Only at MeV the minimum value of seems to disappear, since further decreases at MeV. This is due to the fact that our model is less reliable at the upper energy limit (see total and differential cross sections shown in Figs. 3 and 5). As in the previous case, variation of the total width yields variation of the and variation of the branching ratio changes this result slightly. Note that the absolute values of here are smaller than in the case of larger . Therefore, at this stage we may conclude that our result prefers the total width values in the range of .
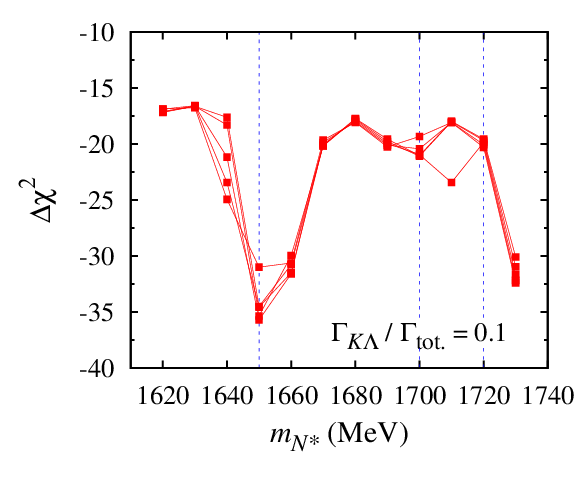
To investigate model dependence of our result in Fig. 11 we display the same result as in Fig. 9 with a branching ratio of 0.1, but using Model 2. Once again, we see a similar pattern found in Fig. 10. We, therefore, conclude that the minimum at seems to be model independent, whereas the minima at and 1720 MeV seem to disappear in Model 2. This phenomenon can be understood from the fact that Model 2 has smaller , i.e., the agreement with experimental data is better than in Model 1. Thus, improvement of the by adding nucleon resonances is less likely in Model 2. As a consequence, the number of minima in Model 2 is significantly reduced. To check this argument, we have also analyzed a model that makes use of nucleon resonances found in the analysis of new pion photoproduction data from the CLAS collaboration [28]. In this analysis only the , , , and states are considered, whereas the variation of resonance parameters is very limited. Obviously, the agreement with kaon photoproduction data is worse () than in Model 1 () or Model 2 (). As a consequence, four minima are observed in the plot of , i.e., at 1650, 1670, 1690, and 1720 MeV, which clearly supports our argument above.

Our finding corroborates the result of the topological soliton model of Walliser and Kopeliovich [2] discussed in the Introduction of this paper. The QSM of Diakonov and Petrov [6] predicts a state with a mass around 1650 MeV if the possible mixing between the lower-lying nucleonlike octet with the antidecuplet is neglected. Thus, our result seems to support this possibility. Although our finding does not exclude the possibility that a narrow resonance with a mass of 1700 or 1720 MeV could exist, we believe that investigation of the resonance effects at these energies by using the present mechanism is difficult due to the opening of , , and channels.
IV Origin of the minima and possibility of other resonance states
| Extracted parameters | |||
| +90 | +40 | 19 | |
| - | - | +80 | |
| (MeV) | 1650 | 1650 | 1680 |
| (MeV) | 6 | 5 | 8 |
| 0.2 | 0.2 | 0.2 | |
| (deg.) | 64 | 67 | 0 |
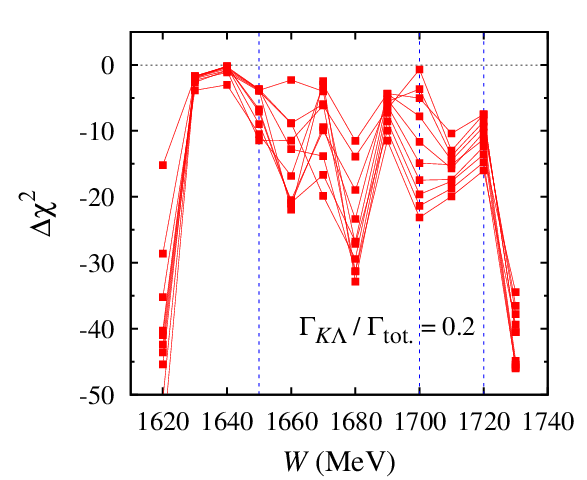
Although in this paper we have assumed the existence of a narrow resonance as predicted by the QSM and we only intent to explore the possibility that it exists in the kaon photoproduction reaction, the results found in the previous section could be also obtained by using other resonances, e.g., an or a . As discussed in the Introduction, a similar situation has been also found in the photoproduction [13]. To clarify this problem, in Fig. 12 we plot the changes of the if we replace the narrow resonance in the amplitude of Model 1 with an () resonance. Obviously the same minimum at MeV is retained, but a new one clearly appears at MeV. The appearance of the minimum at MeV in all shown by Figs. 9 – 12 indicates that a real structure really exists at this energy, although it is hardly seen in experimental data. However, the fact that both and could generate this minimum means that a narrow resonance is also possible in the kaon photoproduction process.
Figure 13 displays the change of the in the fit of Model 1 if we include a () narrow resonance instead of an or a state. Surprisingly, the minimum at 1650 MeV almost vanishes and a clear minimum at 1680 MeV, as in the case of the , appears. Besides that we also observe two weaker minima at 1660 and 1700 MeV. However, the minimum at 1680 MeV is interesting in this case, since the possibility that the structure found in the photoproduction off a neutron can be explained by a resonance has been discussed in Ref. [8]. In fact, the most convincing result with the smallest would be obtained if one used a state instead of a state [8]. Unfortunately, as discussed above and shown in Table 3, at energies around 1685 MeV there exists a number of meson photoproduction thresholds. Therefore, unless we could suppress the threshold effects at this energy point, further discussion of the would be meaningless at this stage.

In the PWA it is possible to check whether the true resonance extracted from the analysis is a or not. A true resonance would yield an effect only when inserted into the correct partial amplitude [7]. In the present analysis such a technology is unfortunately not available. However, in principle, different natures of the , , and resonances represented by their different formulations are traceable in the measured observables.

To prove this argument, in Fig. 14 we show different effects generated by the and the resonances on the total cross section compared with experimental data. Note that we use the resonance parameters given in Table 4, which are obtained as the best fits to experimental data. Interestingly, the resonance generates a clear dip at MeV in the total cross section, whereas the effect of the resonance is almost negligible. Clearly, such a dip is not observed by the presently available data, since the energy bin of the data is larger than the width of the dip. Should the structure around 1650 MeV really exist, then future experiments with smaller energy bins (e.g. 2 MeV) would be required to resolve it and, simultaneously, to single out the true resonance.
How can the structure predicted by the minima in Figs. 9 – 12 almost disappear in the total cross section? The answer is given in Fig. 15, where we can see that the effect of the resonance on the differential cross sections is in fact comparable with that of the resonance, but the effect changes almost drastically at from decreasing to increasing cross section as the kaon angle increases. This phenomenon obviously disappears in the total cross section after an angular integration over all possible angles averages this effect. In the case of the we obtain a decreasing effect in the whole angular distribution, which therefore produces an obvious dip at MeV in the total cross section.
It is obviously important to know which data are really responsible for the minimum at 1650 MeV as shown in Figs. 9 – 12. For this purpose, we have scrutinized contributions of individual data to the in our fits and found that this minimum originates mostly from the recoil polarization data as displayed in Fig. 16. From this figure we can see that there exists a dip at MeV in the whole angular distribution of data. It is also apparent that both and states can nicely reproduce the dip. Therefore, it seems to us that the recoil polarization is not the suitable observable to distinguish the possible states at 1650 MeV. Nevertheless, more precise recoil polarization data are still urgently required in order to support the finding of the present work as well as to remove uncertainties in the position of the dip. Definitely, JLab FROST project looks promising for this purpose [29].

In the beam-recoil double polarization observables and the presence of an or a narrow state predicts a small structure at 1650 MeV. In the case of the state the structure is slightly more obvious than in the case of the state. We note that for the observable this structure increases as the kaon angle increases. The opposite behavior is shown by the observable. Although the structures seem to be mild, their differences generated by the different natures of the and resonances might provide important observables to determine the origin of the minimum at 1650 MeV.

Although the effect is milder, the same behavior is also shown by the target asymmetry , as exhibited in Fig. 18. In the case of photon asymmetry, given in the same figure, the effect generated by the states is more obvious than that by the state.

The effect of the narrow resonances is also found to be sizable on the beam-recoil double polarization observables and , as displayed in Fig. 19. Different from the photon or beam-recoil asymmetries, and , here we observe that both resonances yield a clear dip at MeV. Although and probably cannot distinguish the effects of and states, the sizable dips produced here indicate that these observables are seem to be promising for investigation of the narrow resonance existence in kaon photoproduction.

We believe that new measurements with the present accelerator and detector technologies would be able to resolve the effects shown in Figs. 14 and 15. Furthermore, more precise kaon photoproduction data with energy bins about 2 MeV would be already able to discriminate the effect of and resonances on the total cross section and improve the accuracy of our calculation.
V Summary and conclusion
We have studied the possibility of observing the narrow resonance, the nonstrange member of antidecuplet baryons predicted by the QSM, in kaon photoproduction off a proton. For this purpose, we have constructed two isobar models that can reproduce experimental data from threshold up to MeV, based on our previous effective Lagrangian model. After inserting the resonance in the models we analyzed the changes in the total with the variation of from 1620 to 1730 MeV and found the most convincing minimum at MeV. This finding is observed for all isobar models used in this investigation and could be distinguished from the and resonances, provided that more precise kaon photoproduction data were available. Furthermore, our conclusion does not change with the variation of the total width and branching ratio of the resonance. Although the mass of the resonance obtained in our calculation (i.e., 1650 MeV) is slightly different from those obtained from the and reactions, the 1650 MeV mass corroborates the result of the topological soliton model and the calculation utilizing the Gell-Mann-Okubo rule without mixing between the lower-lying nucleonlike octet with the antidecuplet. Needless to say that more precise kaon photoproduction data are crucial to prove and improve our present calculation.
Acknowledgment
The author thanks Igor I. Strakovsky for suggesting this study and for fruitful discussions. Supports from the University of Indonesia and the Competence Grant of the Indonesian Ministry of National Education are gratefully acknowledged.
References
- [1] D. Diakonov, V. Petrov, and M. Polyakov, Z. Phys. A 359, 305 (1997).
- [2] H. Walliser and V. B. Kopeliovich, J. Exp. Theor. Phys. 97, 433 (2003) [Zh. Eksp. Teor. Fiz. 124, 483 (2003)].
- [3] R. M. Barnett et al., Phys. Rev. D 54, 1 (1996).
- [4] C. Alt et al., Phys. Rev. Lett. 92, 042003 (2004).
- [5] T. Nakano et al., Phys. Rev. Lett. 91, 012002 (2003).
- [6] D. Diakonov and V. Petrov, Phys. Rev. D 69, 094011 (2004).
- [7] R. A. Arndt, Ya. I. Azimov, M. V. Polyakov, I. I. Strakovsky, and R. L. Workman, Phys. Rev. C 69, 035208 (2004).
- [8] V. Kuznetsov et al., Phys. Lett. B 647, 23 (2007).
- [9] F. Miyahara et al., Prog. Theor. Phys. Suppl. 168, 90 (2007); I. Jaegle et al., Phys. Rev. Lett. 100, 252002 (2008).
- [10] A. Fix, L. Tiator and M. V. Polyakov, Eur. Phys. J. A 32, 311 (2007).
- [11] M. Doring and K. Nakayama, Phys. Lett. B 683, 145 (2010).
- [12] V. Skhlyar, H. Lenske and U. Mosel, Phys. Lett. B 650, 172 (2007).
- [13] K. S. Choi, S. i. Nam, A. Hosaka, and H.-Ch. Kim, Phys. Lett. B 636, 253 (2006).
- [14] R.A. Arndt, W.J. Briscoe, M.W. Paris, I.I. Strakovsky, R.L. Workman, Chin. Phys. C 33, 1063 (2009); arXiv:0906.3709 [nucl-th].
- [15] T. Mart, Phys. Rev. C 82, 025209 (2010).
- [16] T. Mart and A. Sulaksono, Phys. Rev. C 74, 055203 (2006).
- [17] H. Haberzettl, C. Bennhold, T. Mart and T. Feuster, Phys. Rev. C 58, 40 (1998).
- [18] M. Bockhorst et al., Z. Phys. C 63, 37 (1994); M. Q. Tran et al., Phys. Lett. B 445, 20 (1998).
- [19] K. H. Glander et al., Eur. Phys. J. A 19, 251 (2004).
- [20] K. Nakamura et al. (Particle Data Group), J. Phys. G 37, 075021 (2010).
- [21] T. Mart, C. Bennhold, H. Haberzettl, and L. Tiator, Kaon-Maid. The interactive program is available at http://www.kph.uni-mainz.de/MAID/kaon/kaonmaid.html. The published versions are available in: T. Mart and C. Bennhold, Phys. Rev. C 61, 012201 (1999); T. Mart, Phys. Rev. C 62, 038201 (2000); C. Bennhold, H. Haberzettl and T. Mart, arXiv:nucl-th/9909022.
- [22] R. Bradford et al., Phys. Rev. C 73, 035202 (2006).
- [23] R. Bradford et al., Phys. Rev. C 75, 035205 (2007).
- [24] A. Lleres et al., Eur. Phys. J. A 31, 79 (2007).
- [25] A. Lleres et al., Eur. Phys. J. A 39, 146 (2009).
- [26] M. E. McCracken et al., Phys. Rev. C 81, 025201 (2010).
- [27] M. Q. Tran et al., Phys. Lett. B 445, 20 (1998).
- [28] M. Dugger et al., Phys. Rev. C 79, 065206 (2009).
- [29] Further information about the Jefferson Lab Frozen Spin Target (FroST) experiment can be found at http://www.jlab.org/ckeith/Frozen/Frozen.html