On the link between associated Mg ii absorbers and star formation in quasar hosts
Abstract
A few percent of quasars show strong associated Mg ii absorption, with velocities () lying within a few thousand from the quasar systemic redshift. These associated absorption line systems (AALs) are usually interpreted as absorbers that are either intrinsic to the quasar and its host, or arising from external galaxies clustering around the quasar. Using composite spectra of Mg ii AAL quasars selected from SDSS DR7 at , we show that quasars with AALs with have a prominent excess in [O II] 3727 emission (detected at ) at rest relative to the quasar host, compared to unabsorbed quasars. We interpret this [O II] excess as due to enhanced star formation in the quasar host. Our results suggest that a significant fraction of AALs with are physically associated with the quasar and its host. AAL quasars also have dust reddening lying between normal quasars and the so-called dust-reddened quasars. We suggest that the unique properties of AAL quasars can be explained if they are the transitional population from heavily dust-reddened quasar to normal quasars in the formation process of quasars and their hosts. This scenario predicts a larger fraction of young bulges, disturbed morphologies and interactions of AAL quasar hosts compared to normal quasars. The intrinsic link between associated absorbers and quasar hosts opens a new window to probe massive galaxy formation and galactic-scale feedback processes, and provides a crucial test of the evolutionary picture of quasars.
Subject headings
black hole physics — galaxies: active — quasars: general — quasars: absorption linesI. Introduction
In the popular Sanders & Mirabel picture for quasar evolution [25, 26, 6, 20, e.g.,], gas-rich major mergers between galaxies trigger intense starbursts in ultraluminous infrared galaxies (ULIRGs) and channel ample fuel into the nuclear region to feed the black hole [16, e.g.,]. The black hole (BH) growth is initially buried in dust until some feedback process (either stellar-driven or quasar-driven) blows the dust away and a classical quasar emerges. The major merger event also transforms the host morphology from disks to a spheroid [32, e.g.,]. The feedback processes invoked in this model are also thought to be responsible for shutting down star formation in the bulge, and for establishing the tight correlations between BH mass and bulge properties as observed in local dormant massive galaxies [33, e.g.,]. Although such a violent route is not required for triggering low-to-intermediate luminosity Active Galactic Nucleus (AGN) activity, this merger-based framework seems successful in reproducing an array of observations of luminous quasars and massive red ellipticals in the cosmological context [41, 20, 28, e.g.,]. Nevertheless, many fundamental issues remain unresolved in this model, in particular, the nature and physics of these fueling and feedback processes along the evolutionary sequence remain largely elusive.
A useful tool to probe the physical conditions and dynamical processes within quasar hosts is intrinsic quasar absorption lines. Historically most of the focus has been on broad absorption lines (BALs, usually defined as absorption troughs broader than ), which are undoubtedly intrinsic to the quasar. Here we focus on another class of narrow absorption lines called associated absorption lines (AALs), whose absorption velocity is close to the systemic velocity of the background quasar (). AALs are traditionally defined as narrow absorption troughs () with a velocity offset within of the systemic redshift of the quasar 11 1 Some earlier studies used a larger velocity offset cut to define AALs. This is partly due to the fact that the systemic redshift for many high-redshift quasars is based on the centroid of broad emission lines such as CIV, which has a larger uncertainty compared with the systemic redshift determined from Mg ii or narrow emission lines.. Strong (Å) low-ionization Mg ii associated absorbers are present in a few percent of the entire quasar population [37, e.g.,]. These absorption systems are generally believed to be close to the quasar and are explained by either (or a combination) of the following scenarios: absorption by external galaxies clustering around the quasar [39, 40, e.g.,]; absorption by halo clouds of the quasar host galaxy [14, e.g.,]; absorption by material from a starburst wind of the quasar host [13, e.g.,]; or originating from the vicinity of the black hole ( pc) based on partial coverage analysis or variability studies [12, 4, e.g.,]. On the other hand, classical intervening absorber systems (with ) are not physically associated with the quasar and are absorptions due to cosmologically intervening foreground galaxies along the quasar line-of-sight (LOS) [3, 5]. The strength of these intervening absorbers is shown to correlate with the associated star formation rate, measured within 10 kpc [22].
Using composite spectra, Vanden Berk et al. [37] showed that AAL quasars on average have dust extinction almost twice that observed in quasars with intervening absorbers [42, e.g.,], and the associated absorbers have a higher ionization state than intervening absorbers. To some extent, this supports the idea that AALs are physically associated with the quasar (or at least affected by the radiation field of the quasar), but a direct link between AALs and the quasar is still elusive [40, cf.,].
Using quasars with associated Mg ii absorbers from the SDSS, we will show that there is a link between AALs and [O II] emission from the quasar host, suggesting that a substantial fraction of AALs are intrinsic to the quasar and its host. We further argue that the properties of AAL quasars are in favor of them being the transitional population in the Sanders & Mirabel picture, with signatures of feedback. We describe our sample in §II and present our main results in §III. In §IV we present an evolutionary picture to interpret our results and discuss its implications.
II. Data


| SDSS Designation | Plate | Fiber | MJD | redshift | EW2796 | EW Err2796 | EW2803 | EW Err2803 | |||
|---|---|---|---|---|---|---|---|---|---|---|---|
| (hhmmss.ssddmmss.s) | (Å) | (Å) | (Å) | (Å) | |||||||
| 000045.77255106.1 | 2822 | 339 | 54389 | 0.07 | 0.07 | 1300 | 2726 | 2069 | |||
| 000140.70260425.5 | 2822 | 322 | 54389 | 0.04 | 0.04 | 47 | 54 | 113 | |||
| 000219.64260029.2 | 2822 | 367 | 54389 | 0.18 | 0.14 | -421 | -588 | -289 |
Note. — The list of AALs used in this paper. In the last three columns we list the absorber velocity offset calculated from the fiducial systemic velocity (based on the broad Mg ii centroid), the SDSS redshift in the DR7 quasar catalog, and the improved redshift from Hewett & Wild [17]. The full catalog is available in the electronic version.
We search all the DR7 quasars [27] with Mg ii coverage ( k quasars) for associated Mg ii absorption. This restricts our sample to (), which extends to lower redshift than the sample in Vanden Berk et al. [37]. The unabsorbed continuum plus emission line flux is modeled with a fit with rejections of absorption troughs [29]. We refer the reader to that paper on the details of our fitting procedure. In short, we fit the restframe 2200-3090 Å region with a power-law continuum plus an iron template, and a set of Gaussians for the Mg ii line. During the fitting, we mask out 3 pixel outliers below the 20 pixel boxcar-smoothed spectrum to minimize the effects of narrow absorption troughs. We then subtract the pseudo-continuum plus emission line emission from the spectrum to get the residual spectrum. MgII 2796,2803 absorption doublets are then identified on both sides of the Mg ii emission line by fitting double-Gaussians to the absorption doublet. We only keep absorbers that are detected at for both Gaussian components. We measure restframe equivalent widths (EW) of these AALs and uncertainties of EWs are estimated from the Gaussian fits. Fig. 1 shows an example of our fitting results. Although this fitting recipe was developed to reduce the effects of narrow absorptions on the emission line measurements rather than a dedicated recipe for finding narrow absorption lines, it does a reasonably good job in identifying AALs. With this method we recovered of the AALs in the DR3 sample of Vanden Berk et al. [37], where most of the “missing” AALs are weak absorptions with otherwise normal quasar properties. However, we do not intend to quantify the completeness in our AAL selection as functions of S/N and absorber strength, as such a task would require a more dedicated narrow absorption finder and Monte-Carlo simulations, which are unnecessary for the purposes of this paper.
To define an AAL one needs to know the systemic redshift of the quasar. Stellar absorption features are generally unavailable due to the overwhelming quasar light. The redshifts based on narrow lines such as [O II] and [O iii] are generally consistent with stellar absorption redshifts within [23, e.g.,]. The redshifts based on the broad Mg ii emission line are consistent with those based on [O II] or [O iii] with a dispersion of [e.g., 23, 29, their fig. 17]. The high-ionization broad CIV line is known to be systematically blueshifted () from low-ionization lines such as Mg ii, with a large dispersion of [10, 34, 23, 29, e.g.,], and hence will bias the systemic redshift determination at high redshift.
Here we adopt the centroid of the broad Mg ii emission line as the quasar systemic redshift to calculate the absorber velocity offset, and use as the velocity cut to define an AAL. We compared the absorber velocity offsets with those calculated by adopting the improved redshifts of SDSS quasars from Hewett & Wild [17], and found good agreements with a dispersion of . This dispersion is consistent with the redshift uncertainty based on the Mg ii centroid. Therefore we adopt a nominal uncertainty of in absorber velocities, which is dominated by systemic redshift uncertainties. We finally arrived at a sample of quasars with AALs, among which show multiple AALs in SDSS spectra [40, consistent with]. The sample of AALs used in the following analysis is listed in Table 1. Additional information about these quasars can be retrieved from the value-added SDSS DR7 quasar catalog compiled in Shen et al. [29].
Fig. 2 shows the distribution of absorber velocity for the whole sample in black, and for a subset of quasars for which we have redshifts from [O II] or [O iii] in red. Positive values indicate blueshifted relative to the systemic and negative values indicate redshifted. We found that the absorber velocity distribution using this systemic redshift definition is similar (albeit slightly broader due to the less accurate Mg ii emission line redshifts) to that using the subset of our sample with [O II] or [O iii]-based redshifts. The dispersion in the distribution is , larger than the typical uncertainty arising from systemic redshift uncertainties based on Mg ii. It is thus dominated by an intrinsic dispersion. Our composite spectra (see §III) also confirm that this dispersion is not caused by incorrect systemic redshifts.
As earlier studies already show [39, 37, e.g.,], there is a substantial fraction of AALs that are redshifted from the systemic velocity. These systems could either be truly infalling absorbers, or the emission lines used to estimate the systemic redshift have significant outflowing velocity. At , the distribution flattens out and is consistent with the expectation from cosmologically intervening absorbers, as seen in earlier studies [40, e.g.,]. We thus argue that these high-velocity AALs are mostly classical intervening absorbers, which will be confirmed by our composite spectra in §III.
We divide our sample into three categories: 1) AAL quasars with (the “intervening-like” sample); 2) AAL quasars with (the “blueshifted” sample); 3) AAL quasars with (the “redshifted” sample). We have quasars each in the latter two samples, and quasars in the former.
III. Composite Spectra
To study the average properties of these three AAL quasar samples we create high S/N composite spectra in the restframe of the quasar. SDSS spectra integrate all the light received within a 1.5″ fiber radius, corresponding to kpc at , hence they cover a substantial fraction of the quasar host. For comparison purposes we construct a control sample of more than 9,000 quasars without detected AALs, matched in redshift and -band magnitude to the AAL quasars. We create composite spectra using the method described in Vanden Berk et al. [36]. In short, each spectrum was shifted to restframe, rebinned onto a common dispersion of 1 Å per bin, and normalized. The final composite spectrum was generated by taking the median (or geometric mean) flux density in each bin of the shifted, rebinned, and scaled spectra. An error spectrum was generated from the 68% semi-interquantile range of the flux densities in each bin scaled by , where is the number of spectra contributing to that bin. We refer the reader to Vanden Berk et al. [36] for more details regarding generating the composite spectra.
The left panel of Fig. 3 shows median composite spectra for the above quasar samples. AAL quasars have colors lying between normal quasars and the so-called ‘‘dust-reddened’’ quasars in SDSS (with color excess22 2 is a good indicator of intrinsic quasar colors which accounts for the band shifting with redshift [24, e.g.,]; larger values indicate redder colors. ; Richards et al. 2003). The reddening of AAL quasars relative to the control quasars is well described by a SMC-like extinction curve, with , consistent with [37]. The right panel shows flux ratios of the AAL quasar composites to that of the control quasars. The “redshifted” and “blueshifted” samples show a prominent excess of narrow [O II] emission, which is absent in the case of the “intervening-like” sample. The lack of [O II] emission excess, the similar amount of reddening to classical intervening absorption systems (e.g., York et al. 2006), and the fact that they join the plateau of the velocity distribution (e.g., Fig. 2), suggest that AALs with are in fact mostly classical intervening absorbers33 3 This statement is for the low- Mg ii AALs, and may not hold true for the high- and high-ionization AALs (such as CIV). . We note that the large-scale fluctuations seen in the composite ratios are due to correlated noise arising from variance in the shape of quasar continua.
The correlation between the presence of absorbers with km s-1 and [O II] emission is of great interest. While the composite Mg ii absorption lines are, by construction, offset by hundreds of with respect to the quasars, the stacked excess [O II] emission is found more or less at the quasar systemic velocity (see below). Thus the excess [O II] emission originates from material lying at the quasar systemic velocity. The central engine, i.e., the black hole radiation, appears to be similar in AAL quasars and in normal quasars: other than the reddening and Mg ii absorption, no difference is seen in the continuum and broad emission lines between the two quasar populations. This suggests that dust-reddening is the explanation for the color difference seen in AAL quasars and normal quasars. One might ask if this dust reddening might also cause the apparent [O II] excess seen in the flux ratio plot in Fig. 3. Dust reddening could occur on spatial scales much smaller than the [O II] emission region but much larger than the continuum plus broad line region. In this case the continuum is attenuated while the [O II] emission is not, causing an apparent enhancement of [O II] strength relative to the underlying continuum. Assuming an SMC-like extinction curve, we require to achieve the level of [O II] emission enhancement relative to the continuum, substantially larger than the inferred from the composite spectra.
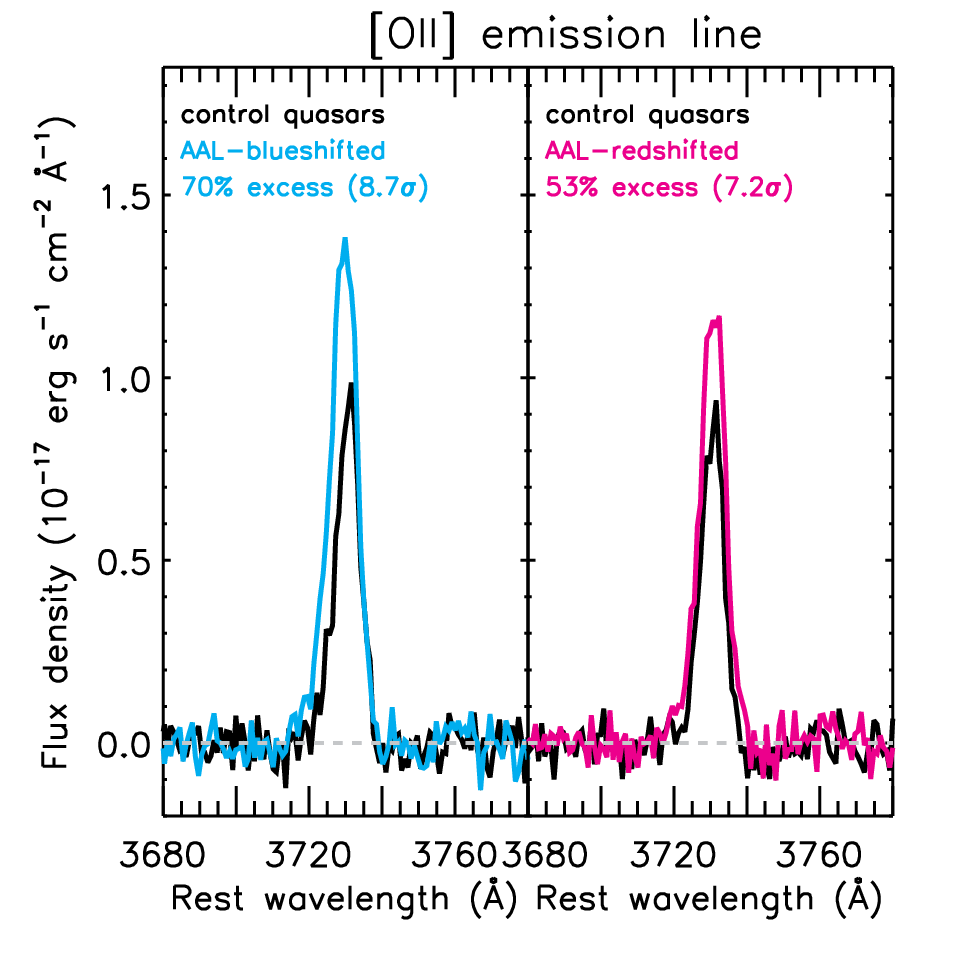
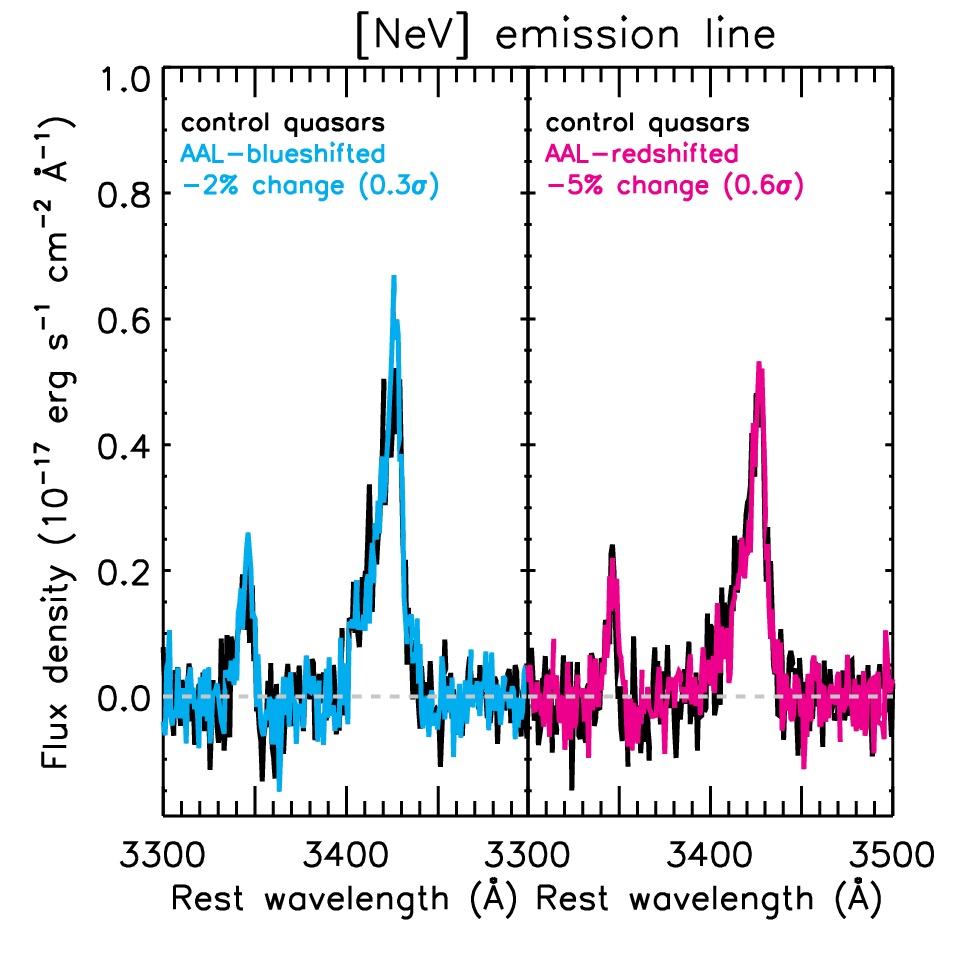
We now focus on the [O II] emission excess. To quantify it and estimate its significance, we create continuum-subtracted median composites around the [O II] emission line. This is done by subtracting a running median filter with a width of 20 pixels and by masking the region Å to preserve the emission line. Within this region the continuum estimate is interpolated. The results are shown in Fig. 4. The centroid of the excess [O II] emission is within from the systemic velocity (Fig. 4). Considering the typical redshift uncertainties of individual objects used in the stacking this is consistent with the systemic velocity. We measure the line flux by integrating the flux density over the emission line profile. The line flux error is estimated by bootstrapping the sample of reference quasars and repeating the procedure 100 times. This allows us to include sample variance in the error estimation. The [O II] excess is detected at 8 (7) for the blueshifted (redshifted) sample, corresponding to an enhancement of () of the line flux of the control quasars. The enhancement increases to ( if we use mean composites. For comparison, we measure the properties of the [Ne V] 3346,3426, which is entirely excited by AGN given its high ionization potential. We follow the same procedure and the results are presented in the right panel of Fig. 4. In this case, we do not observe any significant excess in the [Ne V] 3346,3426. Therefore the AGN ionizing source of AAL quasars is similar to that of normal quasars, and we conclude that the excess [O II] emission is due to different host properties. Interestingly, no [O II] excess is seen in the composite spectrum of quasars with broad Mg ii absorption lines selected from SDSS [29], which is expected if broad absorption lines (BALs) are ubiquitous among quasars and the appearance of BALQSOs only depends on LOS. This difference reinforces our conclusion that the hosts of AAL quasars are intrinsically different.
IV. Discussion


The distinct host properties of AAL quasars in terms of excess [O II] emission (with absorber ) suggest that a significant fraction of these associated absorbers must be physically associated with the quasar and its host, and are not from disconnected external galaxies44 4 Although these external galaxies may still be affected by the ionizing flux from the quasar.. Because the properties of the active SMBH are similar for AAL quasars and for normal quasars, we expect that the amount of [O II] emission contributed by the quasar itself should be similar as well. We thus interpret the excess [O II] emission as due to enhanced star formation within the AAL quasar host galaxy, as [O II] is a good indicator of star formation rate in regions with low ionization parameters, and has been applied for quasar hosts [18, e.g.,] after subtracting the [O II] contribution from the quasar itself. Interestingly, [22] showed a similar connection between Mg ii absorbers and star formation in intervening galaxy absorbers. The measured excess of [O II] luminosity of the AAL quasar hosts is found to be and for the blueshifted and redshifted samples respectively. Following [22], we convert these values to star formation rates using the average scaling coefficient for galaxies with given by [43]. We then find AAL quasar hosts to have a median excess star formation rate of 7 (5) yr-1 for the blueshifted (redshifted) sample.
A less likely interpretation for the [O II] excess would invoke different ISM conditions or element abundance for AAL quasar hosts. Either way, our results show that AAL quasars represent a distinct population and may indicate a special evolutionary phase. The clear absence of [O II] emission at the redshift of the associated absorbers in the composite spectra disfavors major mergers (in which case enhanced star formation for the companion would also have been seen). Our results thus imply that associated Mg ii absorbers could either be minor mergers, or galactic to halo-scale gas outflows and infall associated with the quasar host galaxy. We still expect some AALs from the clustering of galaxies around quasars [40, e.g.,]. Quantifying their contribution requires better knowledge on the strength of the galaxy-quasar cross-correlation function and pairwise velocity dispersion (for the specific type of absorbers), as well as the size of the quasar proximity zone [15, e.g.,], and is beyond the scope of this paper.
A number of studies have revealed that dust-reddened quasars have different properties from classical quasars: heavily reddened (with ) type 1 quasars, selected in the near infrared and radio, usually show strong [O II] emission (e.g., Glikman et al. 2007). In addition, these systems display a large fraction (approaching unity) of disturbed morphologies and interaction (e.g., Urrutia et al. 2008). Dust reddened quasars from the SDSS (with ) also show an excess of [O II] emission compared to classical quasars (Richards et al. 2003). This is in line with the Sanders & Mirabel picture that dust-reddened quasars are in the early stage of evolution after the merger and have higher star formation rate and more dust obscuration in the nuclei. It is interesting to note that the reddest quasars also show a higher occurrence of associated absorbers than normal quasars [1, 24, 19, e.g.,], but the bulk of AAL quasars have much bluer colors (Fig. 3).
AAL quasars thus have properties intermediate between dust-reddened and classical quasars, in terms of both [O II] emission and dust reddening. These findings are consistent with AAL quasars being more evolved than the dust-reddened quasars following a gas-rich merger. The obscuring material in the immediate circumnuclear region has largely been dispersed, but the host star formation rate is still higher than normal quasars. Alternatively, AAL quasars could be similar to dust-reddened quasars, but are seen along a less obscured line of sight. In either scenario, we expect AAL quasars to show a higher fraction of less-developed bulges, disturbed morphologies and interactions than classical quasars.
An archival search in the HST database resulted in three AAL quasars in our sample that have deep (min) imaging data at , all observed in serendipitous programs and the data is publicly available. Two of them, SDSSJ085215.65492040.8 and SDSSJ130952.89011950.6, were observed with WFC3-IR ( min and min) and WFC3-UVIS ( min and min). The third object, SDSSJ093210.96433813.1, was observed with WFC3-IR with a total exposure time of min. In Fig. 5 we show the retrieved WFC3-IR images for these three objects, and their SDSS spectra around the Mg ii region. J0932 and J1309 show clear tidal features and disturbed host morphologies even before subtraction of the quasar light, while J0852 appears to be in a small interacting group where the immediate neighbor to the lower-right has a SDSS photometric redshift consistent with the quasar redshift. Sluse et al. (2007) reported a serendipitously discovered AAL system in the gravitationally lensed quasar RXS J1131-1231, which also shows evidence of interactions and disturbed morphology in the reconstructed host image [7]. Thus the frequency of disturbed morphologies and close companions of AAL quasars is much higher than evolved quasars [2, 9, 38, e.g.,], and is more in line with the results for heavily dust-reddened quasars [35, e.g.,]. This is fully consistent with our evolutionary scenario, but more data are needed to draw firm conclusions. We defer a detailed analysis of the HST data and follow-up studies of these systems to future work.
Even though our results suggest an intrinsic origin for the bulk of the AALs, this is a statistical statement and there are still cases where the AALs are of external origins. Moreover, the nature of these intrinsic AALs is still unknown. Nevertheless, they provide a unique window to probe the physical conditions and dynamical processes during the evolution of quasars and their massive hosts, and deserve in-depth studies, either in a statistical manner or for individual systems. More than half of these associated absorbers show blueshifted velocity, among which some could be feedback (either stellar- or quasar-driven) at work, and possibly leading to a suppression of the host star formation. The typical velocity of these absorbers (i.e., a few hundred ) is much smaller than those seen in BALs and intrinsic high velocity narrow absorption lines (NALs), hence these AAL absorbers are likely to be on scales much larger than nuclear scales55 5 Associated absorptions are therefore expected to show little variability on multi-year timescales compared with BALs and high-velocity intrinsic NALs, which can be tested with multi-epoch spectroscopy of these absorption line systems (Shen et al., in preparation)., and thus are more likely to impact the host galaxy. Gravitational inflows may also be present during the early stage of quasar and host formation, either in the form of accreted gas or as part of an infalling galaxy companion. While intrinsic absorbers with infalling velocities greater than several hundred are likely to be in the vicinity of the BH, the nature of the more slowly moving absorbers needs to be explored. In particular, infalling absorbers are expected in galaxy formation models [21, 8, e.g.,] but almost never seen in galaxy spectra (Steidel et al. 2010). The possibility that some of these infalling absorbers might be associated with cold flows will be explored in future work.
References
- [1] Aldcroft, T. L., Bechtold, J., & Elvis, M. 1994, ApJS, 93, 1
- [2] Bahcall, J. N., Kirhakos, S., Saxe, D. H., & Schneider, D. P. 1997, ApJ, 479, 642
- [3] Bahcall J. N., Spitzer L., Jr., 1969, ApJ, 156, L63
- [4] Barlow, T. A., & Sargent, W. L. W. 1997, AJ, 113 136
- [5] Bergeron J., 1986, A&A, 155, L8
- [6] Canalizo, G., & Stockton, A. 2001, ApJ, 555, 719
- [7] Claeskens, J.-F., Sluse, D., Riaud, P., & Surdej, J. 2006, A&A, 451, 865
- [8] Dekel, A., et al. 2009, Nature, 457, 451
- [9] Dunlop, J., et al. 2003, MNRAS, 340, 1095
- [10] Gaskell, C. M. 1982, ApJ, 263, 79
- [11] Glikman, E., et al. 2007, ApJ, 667, 673
- [12] Hamann, F., et al. 1995, ApJ, 443, 606
- [13] Heckman, T. M., Armus, L., & Miley, G. K. 1990, ApJS, 74, 833
- [14] Heckman, T. M., Miley, G. K., Lehnert, M. D., & van Breugel, W. 1991, ApJ, 370, 78
- [15] Hennawi, J. F., & Prochaska, J. X. 2007, ApJ, 655, 735
- [16] Hernquist, L. 1989, Nature, 340, 687
- [17] Hewett, P. C., & Wild, V. 2011, MNRAS, 405, 2302
- [18] Ho, L. C., 2005, ApJ, 629, 680
- [19] Hopkins, P. F., et al. 2004, AJ, 128, 1112
- [20] Hopkins, P. F., Hernquist, L., Cox, T. J., & Kereš, D. 2008, ApJS, 175, 356
- [21] Kereš, D. Katz, N., Weinberg, D. H., & Davé, R. 2005, MNRAS, 363, 2
- [22] Ménard, B., Wild, V., Nestor, D., et al. 2011, MNRAS, 417, 801
- [23] Richards, G. T., Vanden Berk, D. E., Reichard, T. A., Hall, P. B., Schneider, D. P., SubbaRao, M., Thakar, A. R., & York, D. G. 2002, AJ, 124, 1
- [24] Richards, G. T., et al. 2003, AJ, 126, 1131
- [25] Sanders, D. B., et al. 1988, ApJ, 325, 74
- [26] Sanders, D. B., & Mirabel, I. F. 1996, ARA&A, 34, 749
- [27] Schneider, D. P., et al. 2010, AJ, 139, 2360
- [28] Shen, Y. 2009, ApJ, 704, 89
- [29] Shen, Y., et al. 2011, ApJS, 194, 45
- [30] Sluse, D., Claeskens, J.-F., Hutsemékers, D., & Surdej, J. 2007, A&A, 468, 885
- [31] Steidel, C. C., et al. 2010, ApJ, 717, 289
- [32] Toomre, A., & Toomre, J. 1972, ApJ, 178, 623
- [33] Tremaine, S., et al. 2002, ApJ, 574, 740
- [34] Tytler, D., & Fan, X. 1992, ApJS, 79, 1
- [35] Urrutia, T., Lacy, M., & Becker, R. H. 2008, ApJ, 674, 80
- [36] Vanden Berk, D. E., et al. 2001, AJ, 122, 549
- [37] Vanden Berk, D. E., et al. 2008, ApJ, 679, 239
- [38] Veilleux, S., et al. 2009, ApJ, 701, 587
- [39] Weymann, R. J., Williams, R. E., Peterson, B. M. & Turnshek, D. A. 1979, ApJ, 234, 33
- [40] Wild, V., et al. 2008, MNRAS, 388, 227
- [41] Wyithe, J. S. B., & Loeb, A. 2003, ApJ, 595, 614
- [42] York, D. G., et al. 2006, MNRAS, 367, 945
- [43] Zhu, G., Moustakas, J., & Blanton, M. R. 2009, ApJ, 701, 86