∎
An all-solid-state laser source at 671 nm for cold atom experiments with lithium
Abstract
We present an all solid-state narrow linewidth laser source emitting output power at delivered in a diffraction-limited beam. The source is based on a frequency-doubled diode-end-pumped ring laser operating on the transition in Nd:YVO4. By using periodically-poled potassium titanyl phosphate (ppKTP) in an external buildup cavity, doubling efficiencies of up to 86% are obtained. Tunability of the source over is accomplished. We demonstrate the suitability of this robust frequency-stabilized light source for laser cooling of lithium atoms. Finally a simplified design based on intra-cavity doubling is described and first results are presented.
Keywords:
Laser cooling of atoms Lithium atoms Diode-pumped solid state lasers Frequency doublingpacs
37.10.De 42.55.Xi 42.60.By 42.60.Pk 42.62.Fi 42.65.Ky 42.72.Ai 42.72.Bj1 Introduction
The lithium atomic species is of great interest for cold atom experiments and the study of quantum degenerate gases. As a member of the alkali group it offers strong coupling to electromagnetic fields and a simple level structure including cycling transitions, thus making it suitable for laser cooling. The significant natural abundance of fermionic (6Li) as well as bosonic (7Li) isotopes allows exploration of both sorts of quantum statistics. The interaction parameter at ultracold temperatures, the s-wave scattering length, is easily tunable for both species by applying a DC magnetic field in the vicinity of a Feshbach resonance (1). The large width of these resonances, in addition to the light mass, adds up to the favourable properties of lithium for ultracold atom experiments.
To produce large samples of quantum degenerate gases, one needs large numbers of pre-laser-cooled atoms in a magneto-optical trap (MOT). This first step is mandatory before proceeding to the evaporative cooling phase that leads to quantum degeneracy by reducing the atom number in favor of phase-space density. To optimize the MOT capture process, one usually fixes the laser intensity around a saturation intensity and uses the available output power to maximize the beam diameter. Thus, more laser power leads to a better capture efficiency and larger atom numbers. Another important requirement is the quality of the spatial mode needed to efficiently couple the laser light to single mode (SM) optical fibers.
The wavelength of the lithium D-line resonances ( in air) currently restricts the choice of light sources to two different kinds of lasers: dye lasers and external cavity diode lasers (ECDLs). Dye lasers typically deliver watt-level output of monochromatic light in a diffraction limited beam (2). The drawbacks of this technology are an important maintenance effort, high intrinsic phase noise, and the requirement of an expensive pump laser. ECDLs are typically limited to output with limited spatial mode quality, hence further amplification by injection-locked slave lasers or tapered amplifiers is needed to run a cold-atom experiment.
It is thus desirable to develop suitable single-frequency lasers with watt-level output power. Further applications of such sources include atom interferometry experiments (3), pumping of Cr:LiSAF lasers (4) and lithium isotope separation (5).
Light sources emitting at based on frequency-doubling of Nd:YVO4 or Nd:GdVO4 lasers have been realized previously (6, 7, 8, 9, 10, 11, 12, 13, 14, 15), reaching up to of cw multi-mode output (15). A solid state single-frequency laser source delivering at around has been presented in (16).
Here we report on the construction and characterization of an all-solid-state laser source with output power in a TEM00 mode operating at . This is made possible by frequency doubling a home-made Nd:YVO4 single mode ring laser in an external cavity. The advantages of our source are: watt-level output power in a single longitudinal and transverse mode with excellent beam quality, narrow linewidth (MHz), and long-term frequency stabilization onto the lithium resonance lines. Furthermore, multi-mode diode laser pumping at 808 nm is inexpensive and only low-maintenance efforts are required for establishing reliable day-to-day operation.
The paper is organized as follows: in Section 2 we describe the infrared single-frequency laser design and results. Section 3 focuses on the frequency doubling of the infrared radiation, whereas Section 4 treats the spectroscopy and frequency-locking systems. In Section 5 the red laser emission is characterized in terms of relative intensity noise, linewidth and longterm stability. In Section 6 we describe a second setup in progress using intra-cavity doubling that has the potential to deliver similar output power at while offering higher simplicity of the laser source design.
2 Infrared laser
2.1 Laser setup
To realize a single-longitudinal-mode (SLM) laser it is favorable to use a design avoiding standing waves and thus the resulting spatial hole-burning in the active medium (17). Thus we have chosen a ring cavity with proper intra-cavity etalons as frequency-selective elements.

The setup is presented in Fig. 1. The pump source is a commercial fiber-coupled Coherent FAP-400 diode stack emitting up to at (90% energy width: ). Its metal housing is temperature stabilized to optimize the spectral overlap between pump emission and the gain medium absorption. The fiber output (core radius: , numerical aperture ) is imaged in the gain medium using two lenses ( and ) to a top-hat spot of radius . The Nd:YVO4 crystal of dimensions is 0.2 at.%-doped, a-cut and anti-reflective (AR) coated at and . It is wrapped in indium foil and fixed in a solid water-cooled copper mount to efficiently remove heat. Care needs to be taken to avoid acoustic excitations of the mount due to turbulent water flow, thus only a small continuous flux of tap water was applied to prevent frequency fluctuations of the laser output.
The four mirrors M1-4 (highly reflective at except the output coupler M2, transmitting at ) form a folded ring or bow-tie cavity. The two concave mirrors M3 and M4 have a radius of curvature of . Thermal design is crucial for the laser: even at moderate pump powers, strong thermal lensing occurs because of the large quantum defect between pump and lasing photon energies and excited state absorption to higher levels (18, 19, 20). Optimum spatial overlap of the pump fiber image in the laser crystal (top-hat profile of radius ) and laser mode ( radius ) is established by fine-tuning the distance between M3 and M4. The choice of the mode-size ratio allowed for a stable TEM00 operation at optimum output power11 1 Ref. (21) suggests a ratio for which we observe reduced output power as well as higher-order transversal mode oscillation. . The cavity design remains stable in presence of a thermal focal length down to in the Nd:YVO4 crystal. Care was taken to design the cavity as short as possible to increase the laser’s mechanical stability and the cavity free spectral range (FSR), facilitating SLM behavior.
Unidirectional oscillation is ensured by a combination of a Faraday rotator and a wave plate. The Faraday rotator is custom built by the LCAR group according to the original design presented in (22). As a medium displaying the Faraday effect, a cylindrical AR-coated Terbium Gallium Garnet (TGG) crystal is chosen. To minimize absorption, the length of the TGG crystal is limited to , and its diameter is . The ensemble of NdFeB ring magnets delivers a magnetic field integral of along the TGG axis. Single-pass measurements resulted in a rotation angle of and thus in a Verdet constant of for the given crystal at . Back rotation and stable unidirectional operation at high intra-cavity powers is established by an AR-coated zero-order -wave plate, which is preferred to multi-order wave plates because of instabilities related to thermal effects (23). The polarizing intra-cavity element is the Nd:YVO4 crystal which provides higher gain in the c-direction as well as birefringence. The oscillation direction is chosen as indicated in Fig. 1 to spatially separate residual pump light from the output beam.
| Typ. freq. | Typ. | /Q-factor | |
|---|---|---|---|
| Gain profile width | 300 GHz | ||
| Laser cavity 81 cm | 360 MHz | 96.5% | 110 / |
| Doub. cavity 41 cm | 730 MHz | 93.6% | 86 / |
| Etalon E1, 0.5 mm | 210 GHz | 3.3% | -/- |
| Etalon E2, 4 mm | 26 GHz | 28% | 2 / 2000 |
Stable SLM behavior could not be established using a single intra-cavity etalon. Thus, two infrared fused silica etalons E1,2 of free spectral range and are installed, where , is the speed of light in vacuum, the refractive index and the round-trip length. An overview of the typical frequency scales of the setup is given in Table 1. E1 is non-coated, offering a modulation of the cavity transmission due to its Fresnel reflectivity of per surface, whereas E2 is single-layer coated, yielding .
A second role of the etalons is coarse frequency tuning of the output radiation. However, angular tuning yields walk-off losses and thus reduces the available output power. By applying the method of (24) to ring lasers, the minimum walk-off loss22 2 The loss estimate of ref. (24) yields zero for perpendicular incidence. However, one needs to account for a minimum angle on the order of the Gaussian beam divergence angle to circumvent multi-cavity behavior, causing instability of laser operation. can be estimated to for E2. It can be neglected for E1, for which even an angular tuning of an entire free spectral range only yields additional loss. To avoid the higher tilt loss of E2 ( for angular tuning over one free spectral range of ), we chose to keep it still at the minimum angle and to change its temperature to tune the laser. For that purpose, it is enclosed in a temperature-stabilized copper mount.
Fine tuning of the laser frequency is established by mounting mirrors M3 and M4 on piezoelectric transducers (PZTs): a slow PZT (M4) displaying large displacement of around m at maximum voltage of and a fast PZT (M3) with a displacement of around limited by the driver.
The laser was mounted on a -thick breadboard. A combined aluminum-acrylic-glass housing was provided to isolate from acoustic perturbations and for keeping the setup continuously under a dried air atmosphere to prevent dust and moisture from having detrimental effects on stable long-term operation.
2.2 Laser operation and characteristics
We now present a detailed description of the laser’s operational characteristics. Pump light absorption in the gain medium depends on the wavelength of the radiation (25), hence on the pump diode stack temperature. Setting the chiller temperature to at maximum pump current resulted in highest output power.

By choosing a coupling mirror transmission value , a maximum single-mode output power of was obtained, see Fig. 2. The lasing threshold was found at an absorbed pump power . The power rises linearly above threshold with a slope efficiency of . Between W and 12 W the output power departs from a linear behavior, and becomes unstable. We attribute this to intracavity-power-induced heating of etalon E2 and the related change of its resonance frequency, thereby leaving the optimum operation range. Above W we recover the initial slope with stable operation. At the slope efficiency drops to , indicating the presence of detrimental thermal effects. This behavior was qualitatively found before, see for instance ref. (26). Since no degradation of the laser parameters was observed for highest output powers, the laser was always pumped at maximum current for all further measurements. Removal of the etalons yields a rise in output power of . This can be partly attributed to detuning of the laser frequency of from the emission peak when lasing at half the lithium resonance frequency.
The temperature derivative of the frequency of maximum etalon transmission yields
| (1) |
where is the etalon temperature. Putting in the values for IR fused silica from (27) yields . The emission wavelength was measured by single-pass frequency doubling the laser light, as described in the next section. This resulted in a second-harmonic (SH) output power in the 1-mW range, sufficient to drive a CCD-based wavelength meter (High Finesse WS-6). The measured temperature dependence of the laser emission frequency is . Tunability of is achieved, yielding of tunability for the SH output. To operate the laser at a given frequency without mode hops caused by etalon temperature drifts, the temperature of the etalon needs to be stabilized to an interval , where can be estimated to
| (2) |
This is accomplished using a homemade temperature controller, offering stability well below this requirement.
Continuous scanning of the laser frequency is achieved by sweeping the voltage applied to the slow PZT (M4). For the dynamic range of 0…150 V this results in more than three times the full mode-hop-free scan range of . By applying simultaneous (linear) scanning of the PZT and angle-tuning of etalon E2, mode-hop free continuous frequency tuning of the laser over could be demonstrated, with a resulting maximum output power drop of due to etalon walk-off loss.
The beam coupled out of M2 has a waist radius of () and a divergence angle of () in the horizontal (vertical) plane. The astigmatism results from the cavity design and non-isotropic thermal lensing in the Nd:YVO4 crystal. By employing only spherical lenses, and thus imperfect mode matching, a coupling efficiency to a SM optical fiber of 75% was obtained. Stable output power and beam parameters over weeks of daily operation were demonstrated.
3 Second-harmonic generation

3.1 General considerations
Frequency-doubled light is generated using a second order process in a nonlinear medium. In the limit of weak conversion this yields a second harmonic (SH) output power in the form
| (3) |
with the pump beam power of frequency and the conversion efficiency. In (28), Boyd and Kleinman derived the following expression for , assuming Gaussian beams:
| (4) |
where is the effective nonlinear coefficient of the material with the polarization of the fundamental (SH) wave, the corresponding refractive indices of the material, the nonlinear material length, the vacuum permittivity and the speed of light in vacuum. The function is given as
| (5) |
with the focusing parameter , where is the Gaussian beam Rayleigh length assumed here equal for both waves, yielding a smaller waist for the SH light. The phase-matching parameter
| (6) |
is temperature- and polarization-dependent in the case of birefringent media. The derivation assumes no depletion of the fundamental wave and absence of losses. The integral in eq. (5) needs to be calculated numerically except for limiting cases, yielding a global maximum of . Putting in values for the usual nonlinear media, this results in a doubling efficiency in the %/W range at best. Thus for the available cw laser power, single pass doubling is not an option and one has to resort to resonantly enhanced intracavity doubling.
Quasi-phase matching in periodically-poled materials is favorable in the intracavity case because of the excellent beam quality achievable without beam walk-off (29, 30). The accessibility of the much greater diagonal elements of the nonlinear tensor allows for higher single-pass efficiencies (eq. (4)) while keeping the phase matching condition of optimum . Compared to the bulk case, the same equations (3)-(6) hold, by performing the following replacements: where is the poling period and . As a nonlinear medium, periodically-poled Potassium Titanyl Phosphate (ppKTP) was chosen because of its high transparency from 350-4300 nm, its high nonlinear coefficient (31) and its high damage threshold.
3.2 Single pass measurements
We first describe the characterization of the nonlinear crystal using a single-pass method. The completely automatized measurement setup is represented in Fig. 3. The spatial mode-cleaning fiber output power was , resulting in a maximum of of red light output, the two beams being separated using mirror Msep. The fundamental power was monitored using a Ge photodiode (PD) exploiting the finite transmission through mirror Mref. The signal was calibrated against the IR power hitting the crystal. The finite transmittance of Mref at was taken care of, and the SH power measured using a commercial power meter (Thorlabs S130A). The response of the power meter’s Si photodiode at is negligible, and so is the corresponding transmission of Msep. The shutter, driven at with a 50% duty cycle allowed for the determination of dark current offset drifts for both power measurements, which is of highest importance for low conversion efficiencies. The crystal is mounted on a transverse (-) translation stage and temperature controlled to using a Peltier element and a homemade temperature controller. A set temperature ramp was applied to the controller, scanning the full range in about 30 minutes. The slow ramp allowed for adiabatic behavior of the temperature measurement, permitting independent determination of the temperature of the crystal measured by a LM35 sensor attached to the crystal mount.
The ppKTP crystal used in the experiments was fabricated in-house at the Royal Institute of Technology by electric field poling at room temperature (32). Its length is , featuring an optical aperture of . The length of the periodically-poled region is . The poling period was chosen to be , resulting in expected plane-wave phase matching at using the temperature-dependent Sellmeier equations from (33, 34). Both surfaces are AR coated at and .
Experimental results are presented in Fig. 3. A weighted numerical fit to the eq. (4) well describes the measured data. The temperature dependence of the phase matching parameter was taken into account up to quadratic order. The full 99%-width of the peak of allows the use of standard temperature controllers. However, the optimum phase-matching temperature of differs from the theoretical value. This can be explained by a small difference to the Sellmeier equations as presented in (34) and a non-perfect alignment between pump beam and crystal axis. The maximum measured single pass efficiency of represents 74% of the theoretical maximum of from formula (4) with the parameters as fitted and for KTP from (31). This can be explained by imperfections of the domain grating, most probably deviations from the 50% duty cycle. We thus derive an effective nonlinear coefficient of for our crystal.
3.3 Doubling cavity
The doubling cavity setup is similar to the one presented in (35) and depicted in Fig. 4. As for the laser, a four-mirror folded ring-cavity is used, building up a powerful traveling fundamental wave. The pump light is coupled through the plane mirror M for which several reflectivity values are available to account for impedance matching. All other mirrors are highly reflective at and transmitting at . M and M are concave with a radius of curvature of . M (M) was glued on the same type of fast (slow) PZT as used in the laser cavity (Section 2.1), allowing to act on the cavity length in the () range. The nonlinear crystal is inserted in the cavity’s smaller waist of . The weaker-than-optimal focusing leads to a slightly reduced , or a fraction of the optimum value, yielding . This choice represents a trade-off between maximum single-pass doubling efficiency and intensity-related detrimental effects such as nonlinear and SH-induced absorption (36) and gray-tracking (37). The cavity length was minimized and the geometry chosen to be shifted with respect to the stability range center. It also avoids frequency degeneracy of higher-order transverse cavity eigenmodes and the TEM00 mode. It also accounts for a circular beam in the crystal and thus for a circular SH output. Mode matching between the laser output and the cavity was accomplished using a set of spherical lenses. The crystal mount is identical to the one described in Sect. 3.2. The frequency doubled light is transmitted through M and collimated using a mm lens to a beam radius of . The doubling cavity is kept in a housing equaling the laser housing in design and function.

For low intra-cavity powers of up to and the crystal temperature tuned far from the optimum phase matching value, nonlinear conversion can be neglected. While scanning the cavity length by , one measures a power signal leaking through M, proportional to the intra-cavity power
| (7) |
where is a fit parameter. are the contributions from the TEMlm modes, displaying a constant cavity round-trip phase of , and is the speed of light in vacuum. The mode matching efficiency is defined as . It was maximized to . The linear cavity round-trip losses can be quantified from the fit parameter , where emp(tot) means the empty cavity (cavity including ppKTP crystal). The results are presented in Table 2. Inserting the crystal rises the losses by . This can be accounted for by residual absorption and scattering in the ppKTP crystal and imperfections of its AR coatings. Taking into account nonlinear conversion, the fundamental mode intracavity power at TEM00 resonance (referred to as cavity resonance) is a solution of
| (8) |
which can be calculated numerically, where is the fundamental pump power, is the coupling mirror (M) transmission loss and is the total cavity passive loss excluding the coupler transmission. The single-pass doubling efficiency is calculated according to eq. (4) with as measured in Section 3.2. Setting and the solution of eq. (8) yields a maximum SH power of at the maximum available pump power of . This is accomplished for an optimized coupling mirror reflectivity of , yielding a power conversion efficiency of .
| 5% | |||
|---|---|---|---|
| 10% | |||
| 17% |
After locking the cavity to the laser, as will be described in Section 4.1, the SH power versus was measured for , see Fig. 5. For low powers, the conversion shows quadratic behavior as stated in eq. (3). A fit yields a single-pass efficiency of , slightly lower than predicted. However, starting from the threshold value , only a slow linear rise in SH power with intra-cavity power is obtained, reaching its maximum at . We attribute this behavior to fast intensity-dependent detrimental effects. This is confirmed by the lock error signal, which becomes very noisy above threshold. In contrast to (38, 39) the cavity remains locked for all power levels. When changing the pump power, the SH output follows without observable hysteresis. Long-term degradation is not observed, indicating the absence of gray-tracking. However, for further characterization the setup is operated just below threshold to avoid the related rise in intensity noise. A maximum doubling efficiency of is obtained just below threshold, compatible with the theoretical predictions.

4 Lock and saturation spectroscopy
Frequency locking of the laser system to the lithium D-line transitions requires frequency doubled light to perform spectroscopy on atomic lithium vapor. Thus, first the doubling cavity needs to be frequency-locked to the free-running laser. In a second step, the laser is stabilized to half the required frequency using lithium saturated absorption phase modulation spectroscopy. The setup is presented in Fig. 6.

4.1 Cavity lock
To frequency-lock the doubling cavity to the laser frequency, an error signal needs to be generated. We use a modulation technique: An electro-optical modulator (EOM1 in Fig. 6) phase-modulates the infrared pump light at a modulation frequency of . In the doubling process, this results in a phase modulation of the frequency-doubled light, which is detected and demodulated using a homemade synchronous detection circuit. It allows to produce an error signal with a 3 dB-bandwidth of , which is fed into a lock circuit.
The lock circuit combines a proportional-integrating (PI) stage and splits the resulting lock signal in two frequency ranges: to for the slow PZT and to . The amplitude of the slow PZT signal is further amplified by a commercial high-voltage amplifier (Falco Systems WMA-280). The upper frequency limits were chosen to avoid oscillation of the loop at resonances attributable to the PZTs. When scanning the laser frequency via the slow PZT (M4), the ramp signal (modified by an adjustable gain) is fed-forward to the lock signal, thus minimizing lock deviations and stabilizing output power. The implementation of the re-locking scheme of ref. (40) renders the doubling cavity lock significantly more stable to external disturbances.
4.2 Saturation spectroscopy and laser lock
A small fraction of the frequency-doubled light is sent through a acousto-optic modulator (AOM) double-pass setup to frequency-shift the light used for spectroscopy by . It is employed to perform saturated absorption spectroscopy in an atomic lithium vapor cell. The required vapor pressure is obtained by heating a metallic lithium sample of natural isotope composition (8% 6Li, 92% 7Li) up to under vacuum. We use a long CF-40 tube with broadband AR-coated windows. The final sections of the tube are water-cooled to prevent from too high temperatures at the CF-40 flanges and windows. Nickel gaskets are employed because of their chemical inertness to lithium vapor. A small amount of argon buffer gas is used to force lithium atoms by collision to stick to the side walls before arriving at the window surfaces. The argon pressure is kept low enough to not cause significant collisional broadening of the saturated spectroscopy lines. A metallic mesh put inside the tube covers the tube walls to regain condensed lithium from the colder parts exploiting the temperature-dependent surface tension.
The spectroscopy beam -radius is , the pump power is of the order of , of which typically 50% are transmitted through the lithium cell on atomic resonance. The beam then passes through a ND filter and an EOM2, which serves to phase-modulate the light at . A quarter-wave plate and a mirror retro-reflect the beam with a polarization rotated by , thus creating the probe beam of W power. Around W of probe light are detected on a fast photodiode (Newport 1801). Lock-in detection using a commercial amplifier (Toptica PD110) allows to generate a dispersive error signal. A typical example of a -scan over a part of the lithium lines is shown in Fig. 7. The hyperfine structure of both lithium isotopes is clearly resolved and error signals of in a 1-MHz bandwidth are detected. The saturated spectroscopy transmission signal can serve as the auto re-lock reference. This requires a well pronounced peak or dip structure as satisfied for some of the lines.
To lock the laser frequency with respect to one of the resonances, a two-way PI circuit similar to the one used for locking of the doubling cavity is employed. The AOM frequency and thus the lock offset frequency can be changed by a few while the laser remains locked.

5 Laser characterization
We now present further characterizations of the light source in terms of intensity noise and linewidth. The excellent beam quality of the SH light is confirmed by a SM fiber coupling efficiency of 83%.
5.1 Relative intensity noise
The relative intensity noise spectral density of the SH output was measured by shining a beam of on a low-noise photodiode (Newport 1801, 125-MHz bandwidth) and recording the signal using a digital oscilloscope (Pico Technology PicoScope 4424) in AC mode, yielding the relative power fluctuations after normalization, where with the intensity and its temporal average. The definition of is
| (9) |
with the measurement time and denoting temporal averaging. It was realized employing a time-discrete Fourier transformation method and averaging over 100 spectra.
The result is shown in Fig. 8. The broad peak at can be attributed to the laser relaxation oscillations. The structure in the region can be attributed to the locking system. Above drops to the photon shot-noise level, as indicated by the spectrum of a noncoherent source producing an equivalent photocurrent (spectrum B in Fig. 8). The narrow peaks at and harmonics stem from the phase modulation of the pump light, see Section 4.1. The square root of the integral of from to ( to ) yields a RMS relative intensity noise of ().

5.2 Absorption spectroscopy of ultracold atoms
The laser setup was used as an absorption imaging light source for our lithium quantum gas experiment described elsewhere (41). A sample of around 7Li atoms above Bose-Einstein condensation threshold was prepared in an elongated optical dipole trap. Putting a magnetic offset field, the internal electronic states of the atoms are to be described in the Paschen-Back regime. The corresponding lift of degeneracy for the transition frequencies results in a cycling transition, rendering this method insensitive to constant homogeneous stray fields. By applying a laser frequency detuning with respect to atomic resonance using the offset lock as described in section 4.2, one detects a different atom number while assuming constant trap conditions according to
| (10) |
where is the measured linewidth of the transition and the atom number detected at resonance.

The results are presented in Fig. 9. A least-squares fit according to eq. (10) results in a linewidth of , a value compatible with the natural linewidth of of (42). Within our experimental resolution we infer that the laser linewidth is much smaller than the natural linewidth of the atomic transition. Assuming a Lorentzian lineshape for the laser, the linewidth can be given as , compatible with zero.
5.3 Long-term stability
Fig. 10 shows a long-term stability plot of the laser system under laboratory conditions. The system remained locked during the measurement time of 8.5 hours. The SH output power drops by 7% and shows small modulations of a period of . This is attributable to slight angular tilts when the cavity’s slow PZT (M4/M) is driven. This effect, changing the alignments, is confirmed by monitoring the laser output power, which drops by 5% in the same time interval and displays the same modulations.

6 Intra-cavity doubling
We also implemented the more direct approach of intra-cavity doubling a 1342-nm laser. This concept simplifies the optical design since only one cavity is needed. It was achieved by using a setup similar to the one presented in Fig. 1. All cavity mirrors are highly reflective at and mirror M3 is also transmitting at . A nonlinear crystal is put in the waist between mirrors M3 and M4.
For the Faraday rotator, we have tried various arrangements, using either Gadolinium Gallium Garnet (GGG) or TGG as the Faraday material and we have used either a rotatory power plate (made either of TeO2 or of crystalline quartz) or a half-wave plate to compensate the Faraday rotation. Although theory (43) favors the use of a rotatory power with respect to a half-wave plate, we have found that the wave plate was more convenient, with a slightly larger output power.
6.1 Infrared power
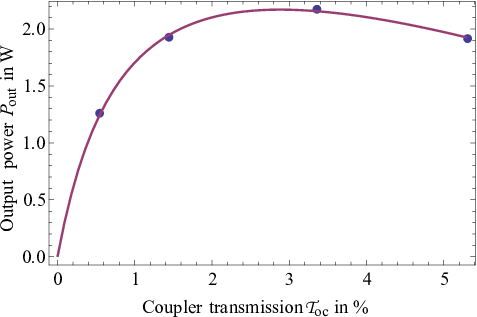
In a setup involving intra-cavity frequency doubling, it is essential to have very low parasitic losses (44). We start by evaluating these losses by measuring the emitted infrared laser power as a function of the output mirror transmission for a fixed absorbed pump power for which thermal effects in the Nd:YVO4 crystal remain small. The data is presented in Fig. 11. Accurate values of the transmission coefficient of the various output mirrors have been obtained with an absolute uncertainty near % by measuring successively the direct and transmitted power of a laser beam in an auxiliary experiment. According to (21, 45, 46, 47, 48), the output power is given by
| (11) |
where is the gain medium saturation power and the laser gain. We performed a nonlinear curve fit yielding , and . The measured losses of are in accordance with expectations for a cavity made of four mirrors (three high reflection mirrors plus the output mirror), three AR-coated crystals and a Brewster plate. In Annex A we relate the values measured for and to the parameters of the lasing crystal and the laser cavity. We find good agreement with literature values.
6.2 Doubling and frequency behavior
Several Nd:YVO4 lasers emitting at 671 nm have been built based on intra-cavity frequency doubling using a LBO (lithium triborate, LiB3O5) crystal (6, 7, 8, 9, 10, 11, 12, 13, 14). The largest achieved power was but none of these lasers have run in SLM operation. We have tried frequency doubling with both LBO and BIBO (bismuth triborate, BiB3O6) crystals installed in the small waist of the laser cavity (see Fig. 1). The BIBO crystal gave slightly more power but with a substantially more astigmatic laser mode. Therefore we use a LBO crystal of length and cross-section. We apply type I SH generation, with critical phase matching at and . The crystal is AR coated with a specified residual reflection equal to % at 1342 nm and % at 671 nm.
The non-linear optical coefficient of LBO is . Using the expressions given in ref. (49) and the SNLO software (50) to evaluate the crystal properties, we have calculated the expected optimum conversion coefficient for this crystal.
We get with an optimum waist in the crystal equal to . We use a slightly larger laser waist of for which theory predicts . We have measured by running the laser with a weakly IR-transmitting mirror M2, with a coupling transmission value , and by measuring simultaneously the emitted power at both 1342 nm and 671 nm. We have found , in excellent agreement with the theoretical value.
Finally by replacing the IR-transmitting mirror M2 by a highly reflective one, we have extracted the SH output through mirror M3 which has a transmission near % at 671 nm. When the laser operates at the peak of its gain curve, corresponding to a visible emission near , we get up to of SH light. At the lithium resonance wavelength nm and with an intra-cavity 500-m-thick etalon made of fused silica and with a reflectivity of %, the current output power reaches . Progress towards frequency-stabilization as described in Section 4.2 is ongoing. With this simpler optical system we expect performances comparable to those obtained with external cavity frequency doubling presented in Section 3.3.
7 Conclusion
We have presented a frequency-stabilized laser source to address the D-line transitions in atomic lithium. Up to single mode output power has been generated, currently limited by intensity-dependent effects in the doubling crystal. Tunability, narrow-band spectral quality and stable long-term locked operation were demonstrated. This proves the suitability of the system as a laser source for experiments involving cooling and trapping of lithium species. We also presented first results of a simpler alternative setup featuring intra-cavity doubling. Higher output powers could be achieved by optimizing the doubling cavity design for less intensity in the ppKTP crystal by enlarging the waist or using less thermally sensitive doubling nonlinear materials. Further increase of the laser power at is feasible using a pump source at (25), reducing the quantum defect and thus the detrimental thermal effects.
Acknowledgements.
We would like to thank Y. Louyer, P. Juncar and F. Balembois for their help in starting this development, J.L. Doualan, R. Moncorgé and P. Camy for a new measurement of the stimulated cross section of Nd:YVO4, E. Mimoun for providing his design of the lock circuitry, N. Navon for his help in conducting the linewidth measurements, F. Lenhardt, P. Zimmermann and J.J. Zondy for fruitful discussions and R. Stein and A. Grier for careful reading of the manuscript. The LKB team acknowledges financial support from ERC (FerLoDim project), EuroQUAM (FerMix), IFRAF, IUF, ESF, ANR, SCALA and DARPA (OLE project) and the LCAR team acknowledges financial support from CNRS INP, BNM (grant 04-3-004), ANR (grant ANR-05-BLAN-0094) and Région Midi-Pyrénées.Appendix A Additional materials
The theoretical values of and are given by
| (12) | |||||
| (13) |
where is the overlap efficiency of the pump and laser cavity mode in the gain medium, the quantum efficiency of emission, the gain medium effective volume and its length, and the pump and laser wavelength respectively and the pump laser power. In (21, 45, 46, 47, 48) the length is multiplied by because the calculation concerns standing-wave cavities and this factor is suppressed in the case of a ring cavity. Ref. (47) gives the general expressions of and of as a function of the laser mode waist and pump mode waist .
In our experiment, the pump mode is obtained by expanding the mode emitted by a 200-m diameter optical fiber of by a factor of . After expansion, the pump mode divergence is small and it is a reasonably good approximation to assume that the pump mode waist is constant over the crystal volume. We get
| (14) | |||||
| (15) |
where we have used for the laser mode waist the value calculated at the position of the Nd:YVO4 crystal. This calculation assumes that the thermal focal length of this crystal is mm but the mode parameters are not very sensitive to this focal length, because its position is close to the the large waist of the laser cavity. The pump mode waist is deduced from the fiber diameter and the expansion ratio.
By combining and , we get , reasonably close to our theoretical value. To get the value of , we need to know the saturation intensity where is the stimulated emission cross-section, the excited state lifetime and . The maximum value of for stimulated emission near nm is cm2: this value was measured with a spectral resolution near (18) and the same value has been found in an unpublished study (19). The excited state lifetime increases when the Neodymium ion concentration decreases (20, 51). We have used the largest literature value corresponding to a % Nd concentration. We thus get , with an estimated % error bar. The quantum yield depends on the Neodymium ion concentration (52) and practically for 0.2 at.%-doped crystals. By combining our measured values of and , we deduce in good agreement with eq. (15). This gives confidence in our determination of the loss of our cavity without second harmonic generation.
References
- (1) C. Chin, R. Grimm, P. Julienne, and E. Tiesinga, Rev. Mod. Phys. 82, 1225 (2010).
- (2) J. T. F. Johnston, R. H. Brady, and W. Proffitt, Appl. Opt. 21, 2307 (1982).
- (3) A. Miffre, M. Jacquey, M. Büchner, G. Trénec, and J. Vigué, Physica Scripta 74, C15 (2006).
- (4) S. A. Payne, L. K. Smith, R. J. Beach, B. H. T. Chai, J. H. Tassano, L. D. DeLoach, W. L. Kway, R. W. Solarz, and W. F. Krupke, Appl. Opt. 33, 5526 (1994).
- (5) I. E. Olivares, A. E. Duarte, E. A. Saravia, and F. J. Duarte, Appl. Opt. 41, 2973 (2002).
- (6) A. Agnesi, A. Guandalini, and G. Reali, J. Opt. Soc. Am. B 19, 1078 (2002).
- (7) A. Agnesi, A. Guandalini, G. Reali, S. Dell’Acqua, and G. Piccinno, Opt. Lett. 29, 56 (2004).
- (8) Y.-F. Lü, X.-H. Zhang, J. Xia, X.-D. Yin, A.-F. Zhang, L. Bao, and W. Lü, Optics & Laser Technology 42, 522 (2010).
- (9) H. Ogilvy, M. Withford, P. Dekker, and J. Piper, Opt. Express 11, 2411 (2003).
- (10) A.-Y. Yao, W. Hou, X.-C. Lin, Y. Bi, R.-N. Li, D.-F. Cui, and Z.-Y. Xu, Optics Communications 231, 413 (2004).
- (11) A.-Y. Yao, W. Hou, Y. Bi, A.-C. geng, X.-C. Lin, Y.-P. Kong, D.-F. Cui, L.-A. Wu, and Z.-Y. Xu, Appl. Opt. 44, 7156 (2005).
- (12) L. Zhang, C. Li, D. Li, P. Li, Q. Zhang, and Z. Zhang, Optics & Laser Technology 37, 524 (2005).
- (13) Q. Zheng, H. Tan, L. Zhao, and L. Qian, Optics & Laser Technology 34, 329 (2002).
- (14) Q. Zheng, J.-Y. Wang, and L. Zhao, Optics & Laser Technology 36, 485 (2004).
- (15) F. Lenhardt, A. Nebel, R. Knappe, M. Nittmann, J. Bartschke, and J. A. L’huillier, in Conference on Lasers and Electro-Optics (Optical Society of America, San Jose, CA, USA, 2010), p. CThEE5.
- (16) R. Sarrouf, V. Sousa, T. Badr, G. Xu, and J.-J. Zondy, Opt. Lett. 32, 2732 (2007).
- (17) A. E. Siegman, Lasers (University Science Books, Mill Valley, California, 1986).
- (18) L. Fornasiero, S. Kück, T. Jensen, G. Huber, and B. Chai, Applied Physics B: Lasers and Optics 67, 549 (1998), 10.1007/s003400050543.
- (19) J. Doualan, P. Camy, and R. Moncorgé, private communication (unpublished).
- (20) M. Okida, M. Itoh, T. Yatagai, H. Ogilvy, J. Piper, and T. Omatsu, Opt. Express 13, 4909 (2005).
- (21) Y. F. Chen, T. M. Huang, C. F. Kao, C. L. Wang, and S. C. Wang, IEEE Journal of Quantum Electronics 33, 1424 (1997).
- (22) G. Trénec, W. Volondat, J. Vigué, and O. Cugat, in preparation (unpublished).
- (23) R. Sarrouf, T. Badr, and J. J. Zondy, Journal of Optics A: Pure and Applied Optics 10, 104011 (2008).
- (24) W. Leeb, Applied Physics A: Materials Science & Processing 6, 267 (1975), 10.1007/BF00883762.
- (25) L. McDonagh, R. Wallenstein, R. Knappe, and A. Nebel, Opt. Lett. 31, 3297 (2006).
- (26) F. Song, C. Zhang, X. Ding, J. Xu, G. Zhang, M. Leigh, and N. Peyghambarian, Applied Physics Letters 81, 2145 (2002).
- (27) D. B. Leviton, B. J. Frey, and T. J. Madison, Proc. SPIE 6692, 669204 (2007).
- (28) G. D. Boyd and D. A. Kleinman, Journal of Applied Physics 39, 3597 (1968).
- (29) L. E. Myers, R. C. Eckardt, M. M. Fejer, R. L. Byer, W. R. Bosenberg, and J. W. Pierce, J. Opt. Soc. Am. B 12, 2102 (1995).
- (30) R. Boyd, Nonlinear Optics (Academic Press, San Diego, 2003).
- (31) M. Peltz, U. Bäder, A. Borsutzky, R. Wallenstein, J. Hellström, H. Karlsson, V. Pasiskevicius, and F. Laurell, Applied Physics B: Lasers and Optics 73, 663 (2001), 10.1007/s003400100733.
- (32) C. Canalias, S. Wang, V. Pasiskevicius, and F. Laurell, Applied Physics Letters 88, 032905 (2006).
- (33) K. Fradkin, A. Arie, A. Skliar, and G. Rosenman, Applied Physics Letters 74, 914 (1999).
- (34) S. Emanueli and A. Arie, Appl. Opt. 42, 6661 (2003).
- (35) E. Mimoun, L. D. Sarlo, J.-J. Zondy, J. Dalibard, and F. Gerbier, Opt. Express 16, 18684 (2008).
- (36) V. A. Maslov, V. A. Mikhailov, O. P. Shaunin, and I. A. Shcherbakov, Quantum Electronics 27, 356 (1997).
- (37) B. Boulanger, I. Rousseau, J. P. Feve, M. Maglione, B. Menaert, and G. Marnier, IEEE Journal of Quantum Electronics 35, 281 (1999).
- (38) F. Torabi-Goudarzi and E. Riis, Optics Communications 227, 389 (2003).
- (39) A. Arie, G. Rosenman, A. Korenfeld, A. Skliar, M. Oron, M. Katz, and D. Eger, Opt. Lett. 23, 28 (1998).
- (40) E. Mimoun, L. De Sarlo, J.-J. Zondy, J. Dalibard, and F. Gerbier, Applied Physics B: Lasers and Optics 99, 31 (2010), 10.1007/s00340-009-3844-x.
- (41) S. Nascimbène, N. Navon, K. J. Jiang, L. Tarruell, M. Teichmann, J. McKeever, F. Chevy, and C. Salomon, Phys. Rev. Lett. 103, 170402 (2009).
- (42) W. I. McAlexander, E. R. I. Abraham, and R. G. Hulet, Phys. Rev. A 54, R5 (1996).
- (43) F. Biraben, Optics Communications 29, 353 (1979).
- (44) R. Smith, IEEE Journal of Quantum Electronics 6, 215 (1970).
- (45) W. W. Rigrod, Journal of Applied Physics 36, 2487 (1965).
- (46) P. Laporta and M. Brussard, IEEE Journal of Quantum Electronics 27, 2319 (1991).
- (47) Y. F. Chen, T. S. Liao, C. F. Kao, T. M. Huang, K. H. Lin, and S. C. Wang, IEEE Journal of Quantum Electronics 32, 2010 (1996).
- (48) Y. F. Chen, L. J. Lee, T. M. Huang, and C. L. Wang, Optics Communications 163, 198 (1999).
- (49) F. J. Kontur, I. Dajani, Y. Lu, and R. J. Knize, Opt. Express 15, 12882 (2007).
- (50)
SNLO software,
http://www.as-photonics.com/SNLO.html. - (51) A. W. Tucker, M. Birnbaum, C. L. Fincher, and J. W. Erler, Journal of Applied Physics 48, 4907 (1977).
- (52) Y.-F. Chen, IEEE Journal of Quantum Electronics 35, 234 (1999).