Magnetic Neutron Scattering in Solid Oxygen and its Applications to Ultracold Neutron Production
Abstract
Using neutron scattering, we investigate the static and dynamic structure functions of 3 distinct solid phases (using powder average techniques), and characterize the corresponding modes of energy excitation, focusing primarily on the dynamics of spin interaction. With the maps, we extract the temperature dependent production rate and upscattering cross section, that are relevant for understanding experimental data on ultracold neutron production in solid oxygen at the saturated vapor pressure.
Keywords:
Ultra-cold Neutron; UCN; Neutron moderation; Solid Oxygen; Magnetic Scattering; Magnonpacs
29.25.Dz, 28.20.Gd, 28.20.-vI Introduction
Because of its non-zero electronic spin (=1), oxygen displays a uniquely rich phase diagram when compared to other cryocrystals made of diatomic molecules, such as N2, H2 and CO. At the saturated vapor pressure, there exist 3 distinct solid phases: (44 55 K, cubic lattice, paramagnetic), (24 44 K, rhombohedral lattice, short range anti-ferromagnetic(AF)), and phase ( 24 K, monoclinic lattice, 2-D AF) [1]. When subject to high pressures, oxygen loses it magnetism and this Mott insulator becomes metallic. Upon further pressurization, the solid becomes superconducting at temperatures below 0.2 K. While there exists great theoretical interest with the complexity of these phase transitions of this seemingly simple system, in the paper, we will focus on gaining understanding of the spin dynamics in the low temperature phases at low pressures, and illustrate their potential applications of ultracold neutron (UCN) production.
The magnetic excitations in solid oxygen (s-O2) bring about an opportunity to enhance the superthermal UCN production through inelastic magnetic scattering, beyond the typical phonon couplings already applied in superfluid helium and solid deuterium with a great success. In a superthermal UCN source, the dominant upscattering loss is suppressed by reducing the number of thermally populated energy quanta (phonon or magnon) through cooling of the source material, whereas the production is relatively temperature-independent as long as the inelastic scattering channels remain open and unperturbed. The phase space of the neutrons can be compressed through energy dissipation by exciting the collective modes in the solid. In s-O2, the magnetic scattering length is comparable to that of nuclear scattering, and its spin degree of freedom allows additional inelastic neutron scattering through magnetic coupling that has never been applied to neutron moderations. In this paper, we report results on modern inelastic neutron scattering (INS) in attempt to understand the physics of magnetic excitations in s-O2 relevant to our UCN production experiment.
At low temperatures, the spin ordered state of s-O2 is a Neel state with a AF ordering in the basal plane. As the temperature rises, the spin-spin correlation remains strong enough to evade thermal fluctuations, resulting in a short-range spin order in the phase, and the spin correlation persists in the and liquid phases up to relatively high temperatures. The spin system does not follow the simple order-disorder transition, but instead an intermediate phase exists between the spin-ordered phase and spin-disordered phase. This intermediate phase is best categorized as a geometrically frustrated spin system, a topic of which much work are actively ongoing to formulate viable wave-functions to calculate energy excitations [2, 3]. Traditionally, the spin order in the phase was described by a helimagnet or a three-sublattice Yaffet-Kittel structure [4, 5]. However, due to its low spin number, the system should really be treated quantum mechanically with discrete spin quantizations. The classical spin models might not produce the correct excitation spectrum [6], especially in the strongly coupled, geometrically frustrated phase. At low temperatures under zero pressure, the frustration is relieved by a structural distortion as the hexagonal lattice structure is slightly sheared into a monoclinic structure with reduced symmetry.
The monoclinic unit cells of the and phases can be transformed into each other by a small inhomogeneous deformation of the closely packed basal planes, driven by the spin ordering. The lattice constant increases when approaching the phase transition from high temperature, leading to the dominant 2D spin alignment, with AF exchange interaction and an easy-axis anisotropy. The two-sublattice AF monoclinic lattice transforms discontinuously into the three-sublattice AF hexagonal lattice and undergoes a second order phase transition into the magnetically disordered structure (albeit with short range spin correlations). It was suggested that magneto-elastic coupling changes the order of the transition from the second to the first one with a sizable latent heat [7]. In addition, it was not yet understood why the transition happens at a temperature as low as 24 K, despite of its strong exchange field. Inter-plane exchange, spin-orbital, and magneto-dipole interactions all have the opposite effect to cut down fluctuations at the small-. This can probably be resolved if the quantum fluctuations in the quasi-two-dimensional Heisenberg AFM are taken into account.
Concerning the UCN production, we are most interested in the energy excitation modes that incident cold neutrons (CN) can efficiently couple to. While the excitation in -O2 can be described by magnons using spin wave theory, the situation in -O still needs to be clarified. The first modern many-body calculation of excitations in s-O2 revealed interesting behaviors [7]. In the phase, the ground state has a two-fold degeneracy with a low lying first excited state at 0.8 meV. Because this excited state corresponds to the center of the Brillouin zone, as opposed to the zone boundary as with typical magnon excitations, the authors speculated the existence of bound pairs of spin waves in phase. This hints to the formation of a spin singlet solid, a necessary condition to attain the spin liquid state. Another Monte-Carlo simulation which allows a deformable cell [8] also showed an abrupt increase in spin dynamics in the phase beyond that of the stable phase. Comparing the excitation spectrum in s-O2 to other well studied frustrated spin systems, such as -NaMnO2 (with ) [9] and Cs2CuCl4 () [10], we find many similarities in the INS data.
II Experiments
We measured the total cross section of cold neutrons using a standard transmission measurement, as a part of the UCN production experiment at Lujan Center neutron flight path 12 at the Los Alamos Neutron Science Center (LANSCE). Details of the experimental setup are described in [11]. The INS experiment was carried out using the Disk Chopper Spectrometer (DCS) [12] at the National Institute of Standards and Technology (NIST) Center for Neutron Research (NCNR), where neutrons are produced from a 20 MW fission reactor. Most of the data were taken using neutrons at 2.3 Å (15.4 meV). With this wavelength, the energy resolution (FWHM) of the instrument is 1 meV at elastic scattering, and improves as the neutron time-of-flight (TOF) increases to a resolution of 500 eV at energy transfer meV. The target cell was mounted inside an “orange” helium-flow cryostat. Liquid oxygen was first condensed from gaseous O2 (at 99.999%) in an annular cell made of aluminum, with an outer diameter of 12.5 mm and an inner diameter of 10.5 mm, leaving an annular thickness of 2 mm. With the height of 110 mm, the cell has a total volume of 6.1 cm3. The beam was collimated to 90 mm of total height, and illuminated the entire width of the target cell. Inside the cell, the liquid was subsequently solidified and cooled under the saturated vapor pressure. A s-O2 sample in the polycrystalline form was attained under typical cooling procedures, as the thermal contraction, in particular the abrupt 5% change of the molar volume through the - transition, would most likely crack the bulk solid into many micro-crystals. The cryostat was allowed to stabilize at each set temperature for 1 hour before beginning a measurement. Data were collected at 2 K temperature step throughout the and phase with smaller temperature steps around the - transition. In the final step, the cell was warmed up to totally evacuate oxygen and the background data were collected with the empty aluminum cell at 24 K. Calibration data on detector efficiencies were later collected using a vanadium foil (21.6 g in the beam).
The data were reduced using the DCS MSLICE routine in the DAVE analysis suite developed by NCNR. Each data file was processed with proper background subtraction and detector efficiency normalization. We used the powder average technique, in which signals from any detectors with the same diffraction angle were averaged and the final results were presented as a function of for each TOF bin (or bin). The processed data were re-binned and exported as tables of for further analysis.
III Form Factors from Elastic Scattering
(a)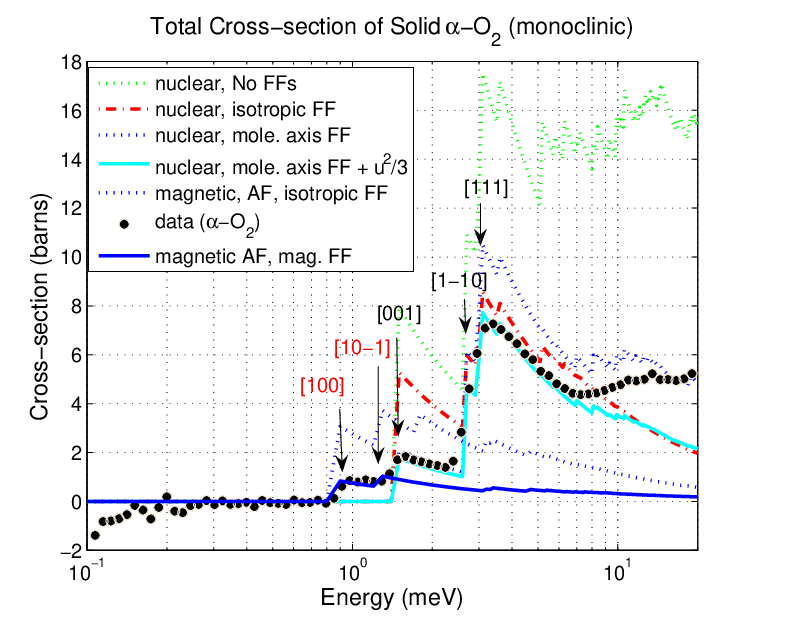 (b)
(b)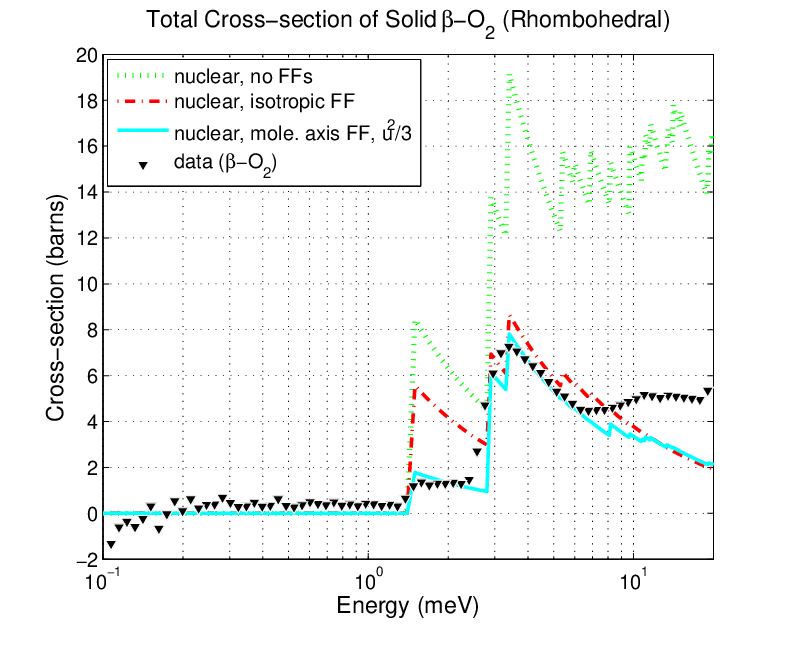
In order to get a correct handle of the distinct form factors in magnetic and nuclear scattering, required later to calculate the inelastic cross sections, we start by analyzing the data on elastic scattering. The total cross sections for - and -O2 are plotted in Fig. 1 and the elastic diffraction lines are plotted in Fig. 2. Note that the total cross section is predominantly elastic over the energy spectrum of the incident cold neutrons. The elastic cross section can be separated into coherent and incoherent contributions:
| (1) | |||||
| (2) |
where is the inter-planar spacing between the [hkl] planes in the lattice space, i.e.,
| (3) |
Here is the reciprocal lattice vector with integer numbers of . The form factor within the unit cell differs depending on whether the coherence of the scattered wave is retained:
| (7) |
In a non-Bravais crystal, the number of atoms in the unit cell, can be more than 1.
As shown in Fig. 1, form factors significantly modify the cross section in the following ways: For nuclear scattering, the intra-molecular interference between the two atomic nuclei would introduce an additional molecular form factor,
| (8) |
where is the vector representing the intra-molecular separation of the two atomic nuclei. To facilitate the AF spin ordering, the O2 molecular axis is aligned to be perpendicular to the basal plane. Hence, the vector is represented as (0,0,), with . Note that it would not be appropriate to apply the typical spherical Bessel function used in diatomic molecules having free rotations, such as H2 and D2 [13]. Librational motions would lead to an additional Debye-Waller factor. The inclusion of reduces the elastic nuclear cross sections by about 50%.

For magnetic scattering, Stephens [14] and Dunstetter [15] suggested the magnetic form factor to be used for molecular O2. In the phase, we need to introduce a sign change in the unit-cell form factor in Eq. III to reflect on the AF spin configuration. In a conventional unit cell with two O2 molecules of opposite spin orientations, the lattice form factor becomes
| (9) |
where and =(a/2,b/2,0) are the vector of the two basis in a monoclinic unit cell. The lattice constants are , , and for monoclinic -O2, and reduce to for rhombohedral -O2. As the AF long-range spin order is present only in the phase, the change of sign does not apply to the phase. Doubling the periodicity of the spin lattice in -O2 manifests as the additional Bragg edges at long neutron wavelengths in the total cross section (at the E1.5 meV in Fig.1a) and magnetic diffraction peaks below 1.7 (Fig. 2a). The lowest magnetic Bragg cutoff at 0.8 meV results from the constructive interference between the [100] planes, which is the perpendicular to the direction of spin order. The second lowest magnetic Bragg edge corresponds to scattering along the [10] plane. Due to its small intensity and close proximity to the first nuclear Bragg edge, this second magnetic Bragg edge is harder to resolve in the total cross section, but can be clearly identified in the powder diffraction data. The two lowest lines in the phase (marked by the asterisks in Fig. 2a, first reported by Collins [16] as magnetic in origin) disappear in the phase, providing the evidence of long-range spin ordering in -O2. Also note the similarity of the total cross section and the rest of the diffraction lines between and -O2, indicating an adiabatic transformation of the nuclear lattice structures with some broken symmetries in the phase. We will take advantage of the similar lattice structures in and -O2 to separate the magnetic excitations from the phonon excitations. The -O2 displays the symmetry of a cubic lattice (Fig. 2c), with quite distinct diffraction patterns.
IV Dynamics from Inelastic Scattering

The neutron scattering intensity is characterized by the double differential cross section, expressed by
| (10) |
For polycrystalline samples, the dynamic structure function is measured as a powder average. In the limit that the orientations of micro-crystals are fully randomized inside the bulk sample, the angular dependence of the momentum transfer is averaged over 4 to become . During each scattering, the incident neutron experiences a momentum transfer of , and an energy transfer of . Processes with positive involve neutron downscattering with the neutron losing energy into creations of one or more quasi-particles in the s-O2; processes with negative involves neutron upscattering with the neutron gaining an energy gain by annihilating one or more quasi-particles, absorbing all their energies. Two dimensional maps of at different temperatures were produced with on average 2 hours of neutron exposure. Samples of the maps are shown in Fig. 3 with color indicating the scattering intensity normalized by the phase space factor, . The INS measurements unfold the very distinct dynamics among the 3 solid phases.
IV.1 -O2
As we have discussed in sec. III, the long-range AF order is responsible for the two magnetic Bragg lines at (M1) and (M2). To get a quantitative measure of the intensities of these elastic magnetic lines, we integrate the from meV, and normalize to that of the first nuclear Bragg peak at . The temperature dependence of the intensity of M1 can be compared with previous optical measurements [17] (Fig. 4 inset), and shows good agreements with the prediction of 2D Ising Model. The decreasing intensity with increasing temperature is consistent with the thermally induced reduction of the spin-spin correlation predicted in the Monte-Carlo simulation [8].

Following the work by Stephens et al. [17], we describe the magnetic excitations in -O2 with a Heisenberg spin Hamiltonian:
| (11) |
based on the renormalized spin wave theory previously developed for NiCl2 [18], which is a simple AF system with a rhombohedral structure. The exchange interactions in solid -O2 include the 4 nearest neighbors, , and 2 next nearest neighbors, , all within the basal plane. The inter planar coupling is negligible due to the large planar separation. The axis is the easy magnetization direction (along the crystal axis), along which the spins align co-linearly. The axis points along the crystal axis, and perpendicular to the basal plane is the axis, along which aligns the molecular axis. The Hamiltonian contains the single particle term with a self-energy , introduced to characterize the spin anisotropy. The Ising-like behavior, as revealed by the temperature dependent intensity of the magnetic Bragg peak, strongly suggests that that the anisotropies shall satisfy and . If , we would expect the system to have an easy plane magnetization.
Using the renormalized spin wave theory, the magnon energy spectrum of this two-dimensional system is solved [17, 18]:
| (12) |
with the index as the acoustic mode and the optic mode. The coupling is summed over the nearest neighbors on the opposite sublattice, and is the next nearest neighbors on the same sublattice. The best value of the coupling constants reported by Stephens [17] are: meV, meV, , meV, and meV, which suggests an easy-plane magnetization (a XY-model). As we will show next, the coupling constants should be modified, in order to bring the model in better agreements with the new high resolution INS data and to conform with the Ising model suggested by the elastic scattering data. Fig. 5a illustrates the energy dispersion relations calculated using the updated coupling constants along major symmetry axes. Not surprisingly, there exists a finite energy gap for magnon excitations even at , as a result of the anisotropy. As we allow the scattering to be confined in the basal plane, the starts to cluster around regions with modes crossing (Fig. 5b) along the [100] direction.
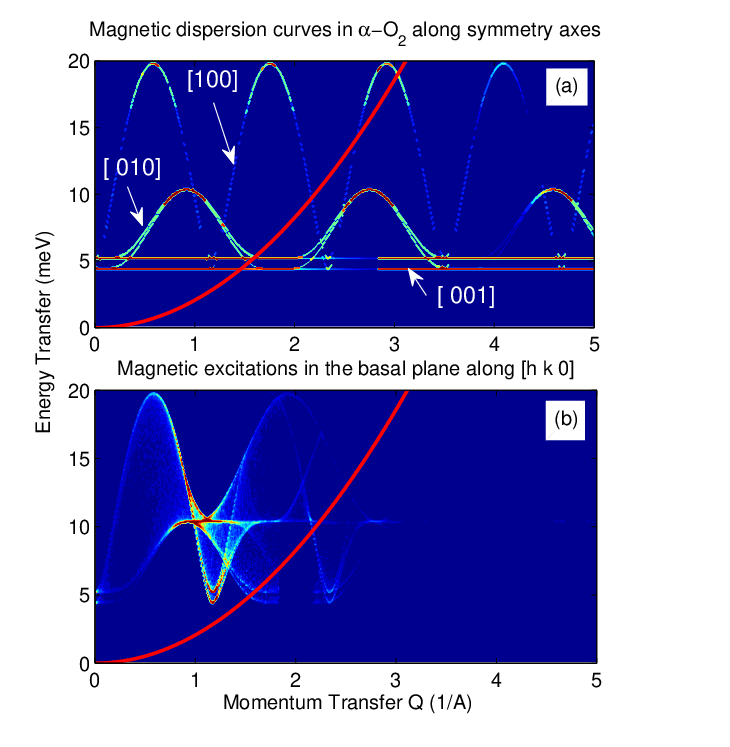
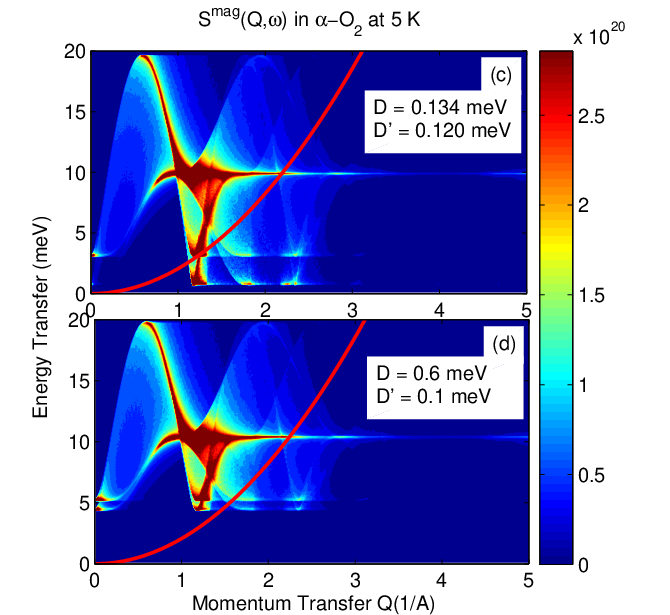
As neutron scattering probes fluctuations perpendicular to the scattering vector , the magnetic dynamic structure function of a AF system can be written as
| (13) |
Here the scattering amplitude is enhanced when the momentum transfer points along the spin aligned axis, i.e. the axis. The delta functions enforce the energy and momentum conservation in this coherent scattering process. The Holstein-Primakoff transformation coefficient used in Stephens’ paper [17], when compared against the experimental data of , is found to carry an incorrect sign, and should be corrected as the following:
| (14) |
It was this sign error together with the low values of anisotropy energies that led to predictions of magnon modes with energies lower than the result of the new INS measurements. This led us to over-predict the UCN yields when we first proposed the idea of magnetic UCN production using -O2 [19].
With the -dependent energy dispersion relation in Eq. 12, we calculate the dynamics structure function for magnon excitations in polycrystalline -O2, following the algorithm we have developed to calculate coherent inelastic scattering cross section in solid deuterium [13]. The magnetic form factors on the molecular and lattice level have already been validated using the elastic cross section as discussed in Sec. III. With the coupling constants suggested by Stephens et.al. [17], the calculated is shown as an intensity plot in Fig. 5c. Because of the molecular spin form factor, the scattering amplitude becomes negligible for , above which the phonon scattering dominates. The small anisotropy energies lead to a soft spectrum (clustered around the center of the second Brillouin zone) extending down to energies as low as meV. If , the excitation would become gapless at . If , the excitation also becomes gapless. It requires the adjustment of the easy axis anisotropy energy up to meV, to bring the low energy mode higher than 5 meV to better agree with the experimental data (Fig. 3a). This again supports the conclusion that the nature of the magnetism in -O2 is indeed 2D Ising. The increased anisotropy energy also agrees with the free gas value of 5.712 K, that characterizes the inter molecular spin-orbit and spin-spin coupling. The single spin anisotropy term is A=3.96 cm-1. When considering the molecular librations, the spin-libration interaction can only soften the anisotropy by 10% [1].
Varying the value of , on the other hand, shifts the energy of the 19 meV magnons (corresponding to excitations at the Brillouin zone boundary), which is beyond the range of energy coverage of the measurement. The difference determines the placement of the dominant magnon at 10 meV at the zone boundary. Results of our numerical studies agree with Stephens’ suggestion of meV.
We calculate the density of states of the magnetic excitations by inverting the dynamic structure function as detailed in later discussions (sec. V). As shown in Fig. 6, increasing the easy-axis anisotropy energy significantly shifts the population of low energy magnon modes towards a higher energy gap, whereas the 10 meV mode shifts only by 5%. The density of states derived from experimental data (limited to magnetic excitations at ) is plotted for comparison. Because of the limited range of coverage in the energy transfer at low , the data cuts off around 12 meV. Except for the sharp peak around 10 meV (which is washed out by the finite energy resolution no better than 0.5 meV), the measured density of state of magnetic excitations is in general agreement with the results of the 2D Ising AF spin-wave model, with a large anisotropy energy.
For , the scattering is predominantly magnetic. We fit over the constant Q slice as a sum of a Lorentzian (centered around 10 meV) peak and a phenomenological 3-pole response function Eq. 17 (as shown in Fig. 3d). As the solid temperature increases, both the high energy cluster (E10 meV) and the low energy cluster (E5 meV) shift downwards in energy (see Fig. 4, in accord with the thermally induced reduction in exchange couplings, as previously shown with the intensity of the elastic magnetic lines (Fig. 4 inset).

The Neel temperature T, calculated within the mean field approximation, is 35 K. This is about 1.5 times higher than the transition temperature of 24 K. Inclusions of the molecular field, however, could not explain the discrepancy. Perhaps the quantum fluctuations prevent the spin from ordering until the lower temperature is reached. The exchange field can be estimated using
| (15) |
is quite large. With the measured spin flop field of 7 T [20]
| (16) |
we arrive at the anisotropy field of about 0.11 T.
IV.2 -O2
As revealed with the INS measurements (Fig. 3), -O2 has a magnetic excitation that differs significantly from the magnons in the phase. First, the intensity of the magnetic Bragg line at drops by orders of magnitude when compared to that in the phase. However, there appears a prominent magnetic excitation centering broadly around . The excitation is dispersion-less in energy and extends over meV. When compared to the spin diffusion dynamics in -O2 at low [21], this dispersion-less magnetic excitation in -O2 looks intrinsically different as it does not extend continuously to low s as in -O2. There are many attempts to derive the spin configuration and its short-range order by studying the detailed structure of the broad elastic peak, based on different variations of the three-sublattice Yaffet-Kittel structure [22, 23]. We would like to point out that the spin-pairing to form a spin singlet could also account for the vanishingly small elastic scattering amplitude. However, high quality data using single crystals are required to definitely support the spinon formation in -O2.
Using the dissipation-fluctuation theorem, the amplitude of inelastic scattering in a magnetic system can be described as the imaginary part of the magnetic susceptibility . To characterize the energy dependence of this scattering, we fit the scattering amplitude (summed over ) using the phenomenological 3-pole response function,
| (17) |
where is the -dependent susceptibility, is the inter-site fluctuation rate, and is a phenomenological energy pole. Examples of the fit and the temperature dependence of the fit parameters are shown in Fig. 7.


Most of the early literatures used the “coupled paramagnet” model to explain the large Lorentzian type of dynamic response and the -dependence. However, the rhombohedral structure in -O2 is equipped with all necessary conditions of a geometrically frustrated AF magnet. We attribute the observed dispersion-less energy excitations to the unique spin dynamics in geometrically frustrated spins. The Curie-Weiss temperature is between 61 K to 55 K (using the coupling constants measured in the phase), larger than the Neel temperature TN of 35 K. The frustration parameter, defined as , is large. In temperatures between TN and , the quantum fluctuation of the spin could lead to the spin liquid state. The formation of the quantum spin liquid requires dominant direct exchange, that can be described by Heisenberg Hamiltonian. The intrinsic fluctuations lead to a small coherence scale. In addition to quantum fluctuations, the spin-orbit coupling and inter-plane coupling can both give rise to fluctuations, lifting the degeneracy of the ground state. The bandwidth of the energy excitation is on the order of = 4.7 5.3 meV, which agrees with the fitted values of (Fig. 7b) and is too big to be accounted for by thermal fluctuations alone. As an exercise, we could attempt to extract the scaling law of this transition by fitting with a power law along both sides of the transition temperature (Fig. 7c). The critical exponent is about 1/2 when approaching the transition from above, and about -1/3 when approaching the transition from below.
The dependence of the elastic scattering intensity (Fig. 3e) is best described by a short range, two dimensional helicoidal order with a correlation length of 5 Å, corresponding to the next nearest neighbor on the ab basal plane. The three-sublattice Yaffet-Kittel model is thus ruled out. The dip on the inelastic scattering intensity shown in Fig. 3e (summed over 29 meV) is an artifact of a dead detector, otherwise, it shows the broad peak centering around . The width of the elastic magnetic peak decreases by about 20% as the -O2 cools from 44 K to 24 K.
Due to the complexity of the spin dynamics in -O2, we don’t yet have an energy dispersion relation with which to construct a complete map of , like what we have done for -O2.
V Evolution of the dynamics

Up to now, we have limited our discussions on the magnetic excitations, which are dominating the dynamics for below 1.5 within the kinematic range covered by our INS measurements. Even without the polarization analysis, we can safely isolate the magnetic components by taking advantage of the similar lattice structure and lattice spacings between and -O2, which warrant the overall similarity of the translational excitations (phonon) between these two phases. To demonstrate this, we plot the dispersion curves of acoustic phonon branches along major symmetry axes on the maps of and -O2 (Fig. 3a, b). These phone dispersion curves clearly outline the regions where the phonon excitations dominate. In particular, within the second Brillouin zone, one can clearly see the typical excitations of acoustic phonons extending all the way down to zero at , connecting to the elastic nuclear Bragg lines (Fig. 2a, b). The phonon excitations within the first Brillouin zone are out of the assessable kinematic range. At larger s, the multiplicities of the inverse lattice planes increases, and it becomes harder to identify the specific phonon branches as they overlap.
Furthermore, the magnon and phonon dynamics can be well separated because the molecular spin form factor suppresses the scattering intensity at large , limiting the magnetic excitations to . To study the evolution of spin dynamics over solid phases, we integrate over , and plot the scattering intensity as a function of and temperature (Fig. 8). As the solid cools through the - transition, the magnetic excitation transforms from the broad-band dispersion-less excitations into the well defined magnon excitations consisting of a high energy mode around 10meV and a low energy mode around 6 meV, leaving almost no scattering amplitudes at low meV in the phase. The same details are illustrated in Fig. 9a, b comparing the scattering amplitudes between -O2 at 4 K and -O2 at 27 K.

The evolution of the phonon dynamics can be examined by plotting at constant slices at (Fig. 9c, d). Solid -O2 shows more quasi-elastic scattering around the phonon branches when compared to the phase. This might be a result of the additional spin-orbit and inter-plane couplings in the phase transferring the high degree of spin fluctuations to the lattice vibration. Beyond the additional quasi-elastic scattering amplitude, there are not much noticeable differences in the phonon dynamics between these two phases.
We may gain insights into how the dynamics evolve by looking into the density of states. Dividing the dynamic structure function by the trivial temperature dependent factors, including the Debye-Waller factor and the phonon (or magnon) occupation number , and integrating over the appropriate range allows us to extract the density of states of excitation modes of interest,
| (18) |
where for magnetic excitations and for phonons. The resulting density of states are plotted in Fig. 10. The phonon density of states in -O2 can be fitted by a quadratic function , as expected, and the magnon density of states in -O2 follows the theoretical predictions as discussed in sec. IV.1. For -O2, it is interesting to note that both nuclear and magnetic density of states can be fitted by a linear function in with the same slope, indicating that the fluctuations are correlated and might be due to the same cause. The density of states for -O2 at high is larger than that of -O2 as a result of the additional orbital rotational diffusion [21].

VI UCN cross sections
(a) (b)
(b)
The energy of UCN ( 100 neV) is several orders of magnitudes smaller than the energy scale of cold neutrons ( few meV). For scatterings involving UCN production, because of the small momentum carried by UCN, , the momentum transfer is approximately equal to the initial momentum of the incident neutrons. Similarly, is equal to the final momentum of the upscattered neutrons in UCN upscattering. Therefore, the differential cross sections for UCN production (via downscattering) and UCN upscattering can be attained by simply reading the value of under the parabolic curve of free neutron dispersion, , as illustrated by the solid red curve (for downscattering) and dashed curve (for upscattering) in Fig. 3a, b, c, and Fig. 5:
| (19) | |||||
| (20) |
At this stage, no effort was made to obtain the absolute cross section on the INS data, and the UCN cross sections are presented on a relative scale with an arbitrary normalization. These temperature-dependent cross sections are then used as essential input parameters in the Monte-Carlo simulations to generate UCN yields that can be directly compared to the experimental UCN production data [24]. If desired, the result of the comparison through a analysis yields the overall normalization required to set the absolute scale of the cross sections, but we omit this step here.
We plot the resulting (relative) differential cross sections for UCN production (Fig. 11a) and UCN upscattering (Fig. 11b) in s-O2 in the phase at 4 K, phase at 25 K and 42 K, and phase at 47 K. The differential cross section for UCN production can be integrated with the incident cold neutron spectrum to attain the UCN production rate specific to each experiment. Note that the production rate can be maximized by choosing an appropriate cold neutron spectrum that optimally overlaps with the differential cross section . As illustrated in Fig. 11a, the -O2 prefers a colder CN spectrum for maximum UCN production. The UCN upscattering, on the other hand, is not influenced by the CN spectrum, but instead is directly proportional to the number of magnons (or phonons) present in the solid and increases exponentially with increasing temperatures. To estimate the total UCN upscattering rate at different temperatures, we integrate Eq. 20 over all final phase space.
A totally thermalized flux can be described by a Maxwell-Boltzmann distribution characterized by the mean temperature of the energy spectrum. With a Maxwellian CN spectrum of temperature TCN, we can calculate the UCN production following the prescription described above to study the dependence of UCN production on the CN spectrum. The resulting temperature-dependent UCN production rates for s-O2 coupled to CN flux of several TCN are shown in Fig. 12. Depending on the TCN, the UCN production in -O2 is 24 times smaller than that in the -O2. The dominant mechanism of UCN production in -O2 is probably through phonon coupling around 6 meV, where the free neutron dispersion curve intersects with the phonon branch (as shown in Fig. 3a). Unfortunately, due to the large spin anisotropy energy, the kinematical range where the magnon excitation becomes strong lies above and totally misses the free neutron dispersion curve. The magnon scattering, even though strong in the -O2, is inaccessible to the inelastic scattering process that produces UCN through the superthermal principle. Above the phase transition, the spin dynamics changes into the highly unstable state with strong short-range correlations as a result of the geometrical frustration. The resulting dispersion-less magnetic excitations spread over , extending down to . These magnetic excitations overlap with the free neutron dispersion curve from , enhancing the UCN production for CN with energy ranging from meV (as illustrated in Fig. 11a). The UCN production in -O2 is even larger, but the correspondingly large upscattering rate makes the UCN loss too big to be useful.

VII Conclusion
In this work, we update the seminal work of Stephens and coworkers [17] using the modern high resolution INS measurements. Our INS data confirms the detailed prediction of the 2D AF magnon model, and we report new values of anisotropy energies that prefer the 2D Ising model over the XY model suggested by Stephens et al. Our initial over-estimate of the UCN production in -O2 is a result of the low values of spin anisotropy energy suggested by Stephens et al. With the corrected anisotropy energies, we confirm that the UCN production in -O2 is predominantly through phonon coupling, and thus suffers from the mass suppression factor because it is harder for a neutron to nuclear recoil the whole O2 molecule that initiates the translational wave. In the phase, we have reported an unexpected large UCN production [24]. The INS measurements unfold the origin of the enhanced UCN production in -O2 as the unique dispersion-less magnetic excitations observed in other similar geometrically frustrated spin systems [25, 10, 9]. The spin dynamic in -O2 has been previously characterized using a phenomenological model of coupled paramagnets [26] on a three sublattice Yaffet-Kittel structure [17], however, the ground state configuration must be highly unstable and the INS data shows many distinct features for the intriguing possibility for spinon excitations. The description of the detailed dynamics still awaits for better INS data using single crystal samples, which are challenging to prepare due to the thermal properties of oxygen.
We would like to thank the NIST neutron facility for providing the beam time and technical supports necessary to conduct this experiment. We would like to thank Gerardo Ortiz for engaging discussions on the theoretical aspect of the work. This work was supported by NSF grants 0457219, 0758018.
References
- [1] Y. A. Freiman and H. J. Jodl, Physics Reports 401, 1 (2004).
- [2] D. H. Lee, J. D. Joannopoulos, J. W. Negele, and D. P. Landau, Physical Review B 33, 450 (1986).
- [3] R. Coldea, D. A. Tennant, and Z. Tylczynski, Journal of Magnetism and Magnetic Materials 272, E649 (2004).
- [4] R. J. Meier, Physics Letters A 112, 341 (1985)
- [5] A. P. J. Jansen, Physical Review B 33, 6352 (1986).
- [6] A. P. J. Jansen and A. Vanderavoird, Journal of Chemical Physics 86, 3583 (1987).
- [7] A. J. R. da Silva and L. M. Falicov, Physical Review B 52, 2325 (1995).
- [8] R. Lesar and R. D. Etters, Physical Review B 37, 5364 (1988).
- [9] C. Stock, L. C. Chapon, O. Adamopoulos, A. Lappas, M. Giot, J. W. Taylor, M. A. Green, C. M. Brown, and P. G. Radaelli, Physical Review Letters 103, (2009).
- [10] T. J. Sato, S. H. Lee, T. Katsufuji, M. Masaki, S. Park, J. R. D. Copley, and H. Takagi, Physical Review B 68, 014432 (2003).
- [11] C. M. Lavelle, C. Y. Liu, W. Fox, G. Manus, P. M. McChesney, D. J. Salvat, Y. Shin, M. Makela, C. Morris, A. Saunders, et al., Physical Review C 82, 015502 (2010).
- [12] J. R. D. Copley and J. C. Cook, Chemical Physics 292, 477 (2003).
- [13] C.-Y. Liu, A. Young, C. Lavelle, and D. J. Salvat (2010), arXiv:1005.1016v1 [nucl-th].
- [14] P. W. Stephens, Physical Review B 31, 4491 (1985).
- [15] F. Dunstetter, O. H. Duparc, V. P. Plakhty, J. Schweizer, and A. Delapalme, Low Temperature Physics 22, 101 (1996).
- [16] M. F. Collins, Proceedings of the Physical Society of London 89, 415 (1966).
- [17] P. W. Stephens and C. F. Majkrzak, Physical Review B 33, 1 (1986).
- [18] P. A. Lindgard and et al., Journal of Physics C: Solid State Physics 8, 1059 (1975).
- [19] C.-Y. Liu and A. Young (2004), arXiv:nucl-th/0406004v1.
- [20] C. Uyeda, K. Sugiyama, and M. Date, Journal of the Physical Society of Japan 54, 1107 (1985).
- [21] F. Fernandez-Alonso, F. J. Bermejo, I. Bustinduy, M. A. Adams, and J. W. Taylor, Physical Review B 78, (2008).
- [22] E. Rastelli, L. Reatto, and A. Tassi, Journal of Physics C-Solid State Physics 19, L589 (1986).
- [23] E. Rastelli and A. Tassi, Journal of Physics C-Solid State Physics 21, 1003 (1988).
- [24] C. Liu, C. Lavelle, and D. J. Salvat (2011).
- [25] R. Coldea, D. A. Tennant, and Z. Tylczynski, Physical Review B 68, (2003).
- [26] A. Chahid, F. J. Bermejo, A. Criado, J. L. Martinez, and M. Garciahernandez, Journal of Physics-Condensed Matter 5, 6295 (1993).