The dark matter halo density profile, spiral arm morphology and supermassive black hole mass of M33
Abstract
In this paper, we investigate the dark matter halo density profile of M33. We find that the HI rotation curve of M33 is best described by a NFW dark matter halo density profile model, with a halo concentration of and a virial mass of M⊙. We go on to use the NFW concentration ( )of M33, along with the values derived for other galaxies (as found in the literature), to show that correlates with both spiral arm pitch angle and supermassive black hole mass.
Keywords:
galaxies: fundamental parameters — galaxies: haloes — galaxies: individual: M33 — galaxies: spiral — galaxies:structure — dark matter.1 Introduction
The currently favored cosmological model, Lambda Cold Dark Matter (CDM), is remarkably successful at reproducing the large-scale structure of the Universe (Blumenthal et al. 1984; Springel et al. 2005). However, small-scale observations have proven harder to explain. High-resolution N-body simulations of CDM structure formation predict that the central density profiles of dark matter halos should rise steeply at small radii, , with (Navarro, Frenk & White 1997, henceforth NFW; Navarro et al. 2004; Diemand et al. 2005). Observations of rotation curves of late-type disk galaxies and dwarf galaxies, on the other hand, have shown that quite often, mass distributions with lower than predicted densities or with constant density cores, where (i.e., a pseudo-isothermal profile), are preferred (Swaters et al. 2003; Gentile et al. 2004, 2005; Simon et al. 2005; Kuzio de Naray et al. 2006, 2008; Shankar et al. 2006; Spano et al. 2008). This is known as the cusp/core problem. One possibility is that these observations are pointing to a real problem with CDM cosmology, perhaps indicating that the dark matter is not cold, but rather warm (Zentner & Bullock 2002), in which case it is easier to produce constant density cores at the centers of dark matter halos. Another possibility is that these late-type galaxies have constant density cores because of their late formation (Wechsler et al. 2002) and that earlier-type bulge-dominated galaxies (which form at earlier times) will tend to conform to the standard expectations of the theory. This is because the central mass densities of galaxies tend to reflect the density of the Universe at their formation time (Wechsler et al. 2002).
In this paper we have chosen to model the HI rotation curve of M33 from Crobelli & Salucci (2000). Due to its proximity, M33 can be studied in exquisite detail, and it therefore provides a crucial testing ground of our ideas of galaxy formation. Its Hubble classification is SA(s)cd (de Vaucouleurs et al. 1991), meaning that is of particularly late-type, with little or no bulge. This is reflected in the central supermassive black hole mass of M⊙ (Gebhardt et al. 2001), and black hole masses tend to be related to the central bulge mass (Magorrian et al. 1998; Häring & Rix 2004). In this paper we model the rotation curve of M33 with both a pseudo-isothermal profile dark matter halo density model and an NFW dark matter halo density model. We then use parameters derived from these fits to look at relations between the dark matter halo and other galaxy properties, such as supermassive black hole mass and spiral arm pitch angle.
This paper is organized as follows. Section 2 describes the observed data and data analysis. Section 3 describes how the rotation curve is modeled and how we derive the baryonic and dark matter halo contributions to the rotation curve. Section 4 discusses our results and Section 5 summarizes our findings. Throughout this paper, we assume a flat CDM cosmology with and a Hubble constant km s-1 Mpc-1.
2 Observations and Data Reduction
We have made use of the Spitzer/IRAC 3.6-m image of M33. The IRAC observations were taken as part of the Gehrz Guaranteed Time Observer Program ID 5. The mapping sequence for each epoch consisted of positions per channel. Each position was observed with three 12 s frames dithered with the standard, small, cycling pattern. The FWHM of the point-spread function (PSF) at 3.6-m is 1.7′′ or 6.9 pc at the distance of M33. The final mosaic spans an area of . We adopt a distance to M33 of kpc (e.g., Magrini, Corbelli & Galli 2007), and it has a redshift of (de Vaucouleurs et al. 1991).
For dynamical measurements, we make use of the HI rotation curve of Corbelli & Salucci (2000). We also make use of the inclination corrected HI linewidth from HyperLeda11 1 http://leda.univ-lyon.fr/ of km s-1 (e.g., Paturel et al. 2003).
For the determination of the spiral arm morphology we have made use of an band image from the Digital Sky Survey (DSS).
2.1 Measurement of spiral arm pitch angle
Spiral arm pitch angles are measured using a two-dimensional fast Fourier decomposition technique, which employs a program described in Schröder et al. (1994). Logarithmic spirals are assumed in the decomposition.
The amplitude of each Fourier component is given by
| (1) |
where and are polar coordinates, is the intensity at position , represents the number of arms or modes, and is the variable associated with the pitch angle , defined by . Throughout this work we measure the pitch angle of the component.
Pitch angles are determined from peaks in the Fourier spectra, as this is the most powerful method to find periodicity in a distribution (Considère & Athanassoula 1988; Garcia-Gomez & Athanassoula 1993).
The image was first projected to face-on. Mean uncertainties of position angle and inclination as a function of inclination were discussed by Considère & Athanassoula (1988). For a galaxy with low inclination, there are clearly greater uncertainties in assigning both a position angle and an accurate inclination. These uncertainties are discussed by Block et al. (1999) and Seigar et al. (2005, 2006), who took a galaxy with low inclination () and one with high inclination () and varied the inclination angle used in the correction to face-on. They found that for the galaxy with low inclination, the measured pitch angle remained the same. M33 has a relatively low inclination of , and so the uncertainty in the inclination angle in this case, does not result in a large error in the pitch angle we measure for M33. Our deprojection method assumes that spiral galaxy disks are intrinsically circular in nature.
3 Mass modeling
3.1 The baryonic contribution
Our goal is to determine a mass model for M33 from direct fitting of mass models to its rotation curve. We perform a bulge-disk decomposition in order to estimate the baryonic contribution. We then determine several different models and try to recreate the nuclear spiral by minimizing reduced-.
We first extract the surface brightness of M33 using the Spitzer 3.6-m image and the IRAF ELLIPSE routine, which fits ellipses to an image using an iterative method described by Jedrzejewski (1987). In order to mask out foreground stars, SEXTRACTOR (Bertin & Arnouts 1996) was used. An inclination correction was then applied to the surface brightness profile (de Jong 1996; Seigar & James 1998) as follows
| (2) |
where is the surface brightness when viewed at some inclination , is the corrected surface brightness, is the major axis, is the minor axis and is a factor dependent on whether the galaxy is optically thick or thin; if then the galaxy is optically thin; if then the galaxy is optically thick (e.g., Seigar & James 1998; de Jong 1996). Graham (2001a) showed that is a good value to use for the near-infrared band. Adopting a simple reddening law, where extinction falls as the square of wavelength, it can be shown that a value of is appropriate at 3.6-m (Seigar, Barth & Bullock 2008a) and we adopt this value here.

| Parameter | Measurement |
|---|---|
| Hubble Type | SA(s)cd |
| Distance (kpc) | 840 |
| Position angle of major axis (∘) | 23 |
| Bulge effective radius, (arcmin) | 1.600.11 |
| Bulge effective radius, (kpc) | 0.390.03 |
| Bulge surface brightness at the effective radius, (3.6 m-mag arcsec-2) | 19.570.98 |
| Bulge Sérsic index, | 1.0 |
| Disk central surface brightness, (3.6 m-mag arcsec-2) | 18.081.02 |
| Disk scalelength, (arcmin) | 6.950.49 |
| Disk scalelength, (kpc) | 1.700.12 |
| Disk luminosity, (L⊙) | |
| Bulge-to-disk ratio, | 0.03 |
The resulting surface brighntess profile Fig. 1 reaches a surface brightness of mag arcsec-2 at a radius of 13.2 kpc (equivalent to 54.0 arcmin). From this surface brightness profile, we perform a one-dimensional bulge-disk decomposition, which employs the Sérsic model for the bulge component and an exponential law for the disk component (e.g., Andredakis, Peletier & Balcells 1995; Seigar & James 1998; Khosroshahi, Wadadekar & Kembhavi 2000; D’Onofrio 2001; Graham 2001b; Möllenhoff & Heidt 2001; see Graham & Driver 2005 for a review). The Sérsic (1963, 1968) model is most commonly expressed as a surface brightness profile, such that
| (3) |
where is the surface brightness at the effective radius that encloses half of the total light from the model (Ciotti 1991; Caon, Capaccioli & D’Onofrio 1993). The constant is defined in terms of the parameter , which described the overall shape of the light profile. When , the Sérsic model is equivalent to a de Vaucouleurs (1948, 1959) model and when it is equivalent to an exponential model. The parameter has been approximated by , for (Capaccioli 1989; Prugniel & Simien 1997). The exponential model for the disk surface brightness profile can be written as follows
| (4) |
where is the disk central surface brightness and is the disk exponential scalelength. The results of our surface brightness fitting are summarized in Table 1.
We now assign masses to the disk and bulge of M33. The stellar mass-to-light ratio in the band is a well-calibrated quantity (Bell et al. 2003) which depends on color. Seigar et al. (2008a) extended this to a 3.6-m image of M31 using the population synthesis codes of Bruzual & Charlot (2003) and Maraston (2005). Using their results, we find a central mass-to-light ratio of with a gradient of -0.014 kpc-1. This results in a disk mass of M⊙ and a bulge mass of M⊙ for M33.
A concern in using the 3.6-m Spitzer waveband to determine the underlying stellar mass, is the effect of emission from hot dust in this waveband, although this is probably only important in or near HII regions. In order to place some constraint on this, we have chosen to explore the emission from dust in the near-infrared band at 2.2 m. Using near-infrared spectroscopy at 2.2 m, it has been shown that hot dust can account for up to 30 per cent of the continuum light observed at this wavelength in areas of active star formation, i.e., spiral arms (James & Seigar 1999). When averaged over the entire disk of a galaxy, this reduces to a percent effect, if one assumes that spiral arms can be up to 12∘ in width. At 3.6 m, this would therefore result in 3 percent of emitted light from dust.
Another concern for the 3.6-m waveband would be the contribution from the polycyclic aromatic hydrocarbon (PAH) emission feature at 3.3 m. However, an Infrared Space Observatory (ISO) spectroscopic survey of actively star-forming galaxies by Helou et al. (2000) found that the 3.3-m feature was very weak when they analysed the average 2.5–11.6-m spectrum of 45 galaxies. The contribution of the PAH feature to the 3.6-m Spitzer waveband, is therefore not a major concern.
One other important contribution to the baryonic mass of M33 is the gas mass. Corbelli & Salucci (2000) have shown that beyond a radius of 10 kpc, the gas contributes about the same to the rotation curve as the stars. Since, the best current estimate of the gas distribution comes from Corbelli & Salucci (2000), we have chosen to adopt their model for the distribution of gas mass in M33.
3.2 The dark halo contribution

A range of allowed dark matter halo masses and density profiles is now explored, using two models for dark matter halo density profiles, the pseudo-isothermal model (e.g., Simon et al. 2005; see Equation 5) and the Navarro, Frenk & White (1997; hereafter NFW) profile. A pseudo-isothermal density profile is given by
| (5) |
which in terms of rotational velocity becomes
| (6) |
where is the core radius, and . The NFW profile is given by
| (7) |
where is a characteristic ‘inner’ radius, and is the present critical density and a characteristic overdensity. This overdensity is defined as
| (8) |
where = is the concentration parameter and
| (9) |
The circular velocity associated with this density is given by Battaglia et al. (2005) and is
| (10) |
where is the circular velocity at the virial radius and . This NFW profile is a two parameter function and completely specified by choosing two independent parameters, e.g., the virial mass (or virial radius ) and concentration (see Bullock et al. 2001a for a discussion). Similarly, given a virial mass and the dark matter circular velocity at any radius, the halo concentration is completely determined.
We now proceed by finding the best-fitting NFW and pseudo-isothermal (or constant density core) dark matter halo density profiles that describe the complete HI rotation curve of M33 as observed by Corbelli & Salucci (2000). The result of this is shown in Figure 2. The pseudo-isothermal fit is shown as the solid blue line, with best-fitting parameters of km s-1 and kpc, and a reduced- value of , where is the degrees of freedom. The NFW fit is shown as a dotted red line, with best-fitting parameters and M⊙, with a reduced- value of . As can be seen from Figure 2, the pseudo-isothermal model (or core model in the figure) underestimates the rotation velocities beyond 7 kpc. However, the NFW fit more closely recreates the observed data. This is also clear from the values of reduced-. We therefore conclude that the NFW model best represents these data, and this is consistent with the results of Corbelli & Salucci (2000). This is somewhat surprising for a late-type, bulgeless galaxy like M33, since these late-type galaxies are often shown to have constant density cores (e.g., Kuzio de Naray, 2006, 2008).
Table 2 lists the best-fit parameters of the best-fit NSF and pseudo-isothermal models based upon direct fitting to the HI rotation curve data.
| Parameter | NFW model |
|---|---|
| M⊙ | |
| 1.18 | |
| Parameter | Core model |
| kpc | |
| km s-1 | |
| 3.19 |
It is probably worthwhile noting that our best-fitting NFW model yields a concentration parameter, . This is somewhat lower than the concentration parameter of reported by Corbelli & Salucci (2000). Furthermore, we derive a virial mass of M⊙, which is significantly lower than the virial mass of M⊙ found by Corbelli & Salucci (2000). Here we discuss some reasons that could account for these apparent differences. Since we use the same gas distribution as Corbelli & Salucci (2000), the only difference can come from the stellar mass component. The main difference between our stellar mass component, and that of Corbelli & Salucci (2000), is that ours is determined from a Spitzer 3.6-m observed in 2007, and that of Corbelli & Salucci (2000) is determined from a band image reported by (Regan & Vogel 1994). The band image from 1994 was taken when near-infrared arrays were really in their infancy, and so it is probably more important to rely on the more modern datasets when possible. Furthermore, Corbelli & Salucci (2000) assume a distance to M33 of 0.7 Mpc, whereas we use the more accurate measurement of 0.84 Mpc from Magrini et al. (2007). As a result of this underestimate in the distance to M33, Corbelli & Salucci (2000) have underestimated the size of the visible galaxy by a factor of 17 percent, and this in turn has probably affected the total mass of M33 that they derive. Taking into account the different distances to M33, the disk scalelength of kpc used by Corbelli & Salucci (2000) would become kpc if they had used the more accurate distance of 0.84 Mpc. This is still lower than the scalelngth of kpc that we report here. In converting this light distribution into stellar mass, we have then used a combination of the stellar mass-to-light ratios from Bell et al. (2003) and the population synthesis codes from Maraston (2005). These papers provide the best estimates currently available for determining the stellar mass-to-light ratios, and they were not available to Corbelli & Salucci when they performed their analysis. One final difference between our results, and those of Corbelli & Salucci (2000), is that we include the bulge mass, although considering the bulge-to-disk ratio of this is unlikely to have a significant effect on the mass models. As a result, we conclude that the differences between our results and those of Corbelli & Salucci (2000), are caused by the different treatment of the disk starlight, updated stellar mass-to-light ratios, and more recent data.
Finally, it should be noted that Corbelli & Walterbos (2007) revealed that M33 has a weak central bar. This could potentially have the affect of inducing non-circular motions in the central regions, i.e., within 1 kpc. However, Kuzio de Naray & Kaufmann (2010) have shown that, even in the case of barred galaxies, it is difficult to confuse an NFW dark matter halo profile with that of a pseudo-isothermal profile. In other words, our result that M33 is best described by an NFW profile, still holds, and given that the potential of the stellar bar is weak, the concentration is unlikely to change significantly.
In the following discussion, we use the NFW concentration parameter to reveal some interesting relationships.
4 Discussion
Seigar et al. (2004, 2005, 2006) have demonstrated that a relationship exists between spiral arm pitch angle and rotation curve shear. Rotation curve shear is defined as:
| (11) |
where is the first Oort constant, is the angular velocity, and is the velocity measured at radius . Using this equation it is possible to determine the shear from a rotation curve. We have performed such an analysis on the HI rotation curve for M33 and found a value for its shear of . We have also measured the spiral arm pitch angle for M33, which turns out to be (Seigar et al. 2008b). This pitch angle is in good agreement with previous measurements (Sandage & Humphreys 1980; Block et al. 2004). Figure 3 shows the relationship between spiral arm pitch angle and rotation curve shear. One can easily see that the pitch angle and shear values for M33 are consistent with the overall relationship.

Given the spiral arm pitch angles of a number of other galaxies, we can also now compare this quantity with the NFW concentration parameters for the galaxies listed in Table 3. Figure 4 shows a plot of NFW concentration as a function of spiral arm pitch angle in degrees. This plot may only be for 5 galaxies, but a relatively strong correlation appears to exist between these two quantities. Indeed Pearson’s linear correlation coefficient is 0.95 for this plot, although the significance at which the null hypothesis of zero correlation is disproved in onlt 54 percent, probably due to low number statistics. Nevertheless, an interesting correlation seems to exist between spiral arm morphology and dark matter concentration, and this could be further studied by targeting more galaxies in an observational campaign. Indeed, these data seem consistent with the suggestion that pitch angle and mass concentration are related (Seigar et al. 2005, 2006).
| Galaxy name | Spiral arm pitch angle | Source | Source | ||
|---|---|---|---|---|---|
| (degrees) | (M⊙) | ||||
| Malin 1 | (1) | – | – | ||
| Milky Way | – | 12.0 | (2) | (5) | |
| M31 | (3) | (6) | |||
| M33 | (7) | ||||
| IC2522 | (4) | – | – | ||
| ESO582G12 | (4) | – | – |

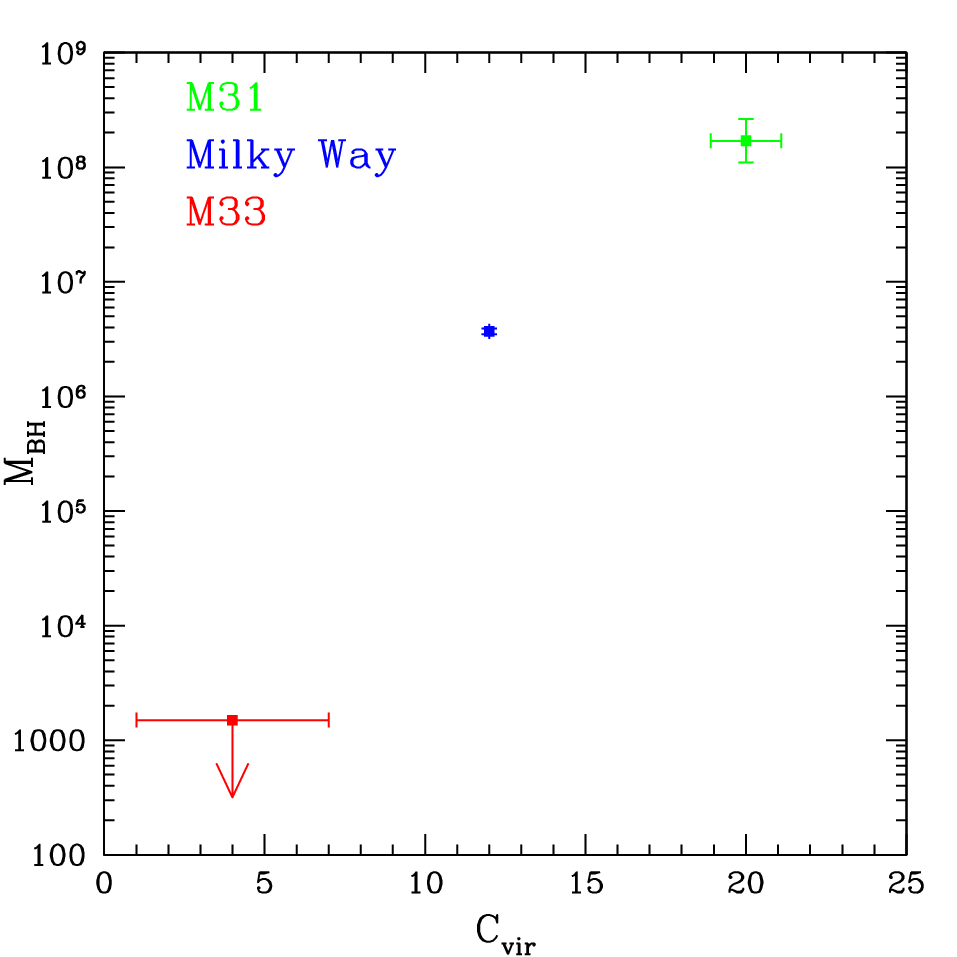
Finally Figure 5 shows a plot of supermassive black hole mass as a function of NFW concentration parameter. Unfortunately, here we only have data for three galaxies. Nevertheless, a hint of a correlation is starting to show, and seeing that such a correlation has been suggested by Seigar et al. (2008b), as well as Satyapal et al. (2008) and Booth & Schaye (2010), this plot is somewhat intriguing. This hint of a correlation should, of course, be expanded on by studying more galaxies along the Hubble sequence from type Sa to Sd.
5 Summary
We have shown that the HI rotation curve of M33 can be best modeled with a dark matter halo that follows a NFW profile, with low NFW concentration of . Using the NFW concentration parameter from this fit, we find that interesting correlations between (1) spiral arm pitch angle and NFW concentration and (2) central supermassive black hole mass and NFW concentration, start to appear. Although the second correlation is only for three galaxies, on the surface it appears to be in disagreement with the argument made by Kormendy & Bender (2011) that the dark matter halos of galaxies have no affect on the masses of supermassive black holes found in their centers. These correlations are very intriguing and our results warrant further investigation, as we have been limited to data that was available for just a few galaxies.
6 Acknowledgements
This research has made use of the NASA/ IPAC Infrared Science Archive, which is operated by the Jet Propulsion Laboratory, California Institute of Technology, under contract with the National Aeronautics and Space Administration. The authors wish to thank the reviewers who helped to improve the content of this paper.
References
- [1] Andredakis, Y. C., Peletier, R. F., & Balcells, M. 1995, MNRAS, 275, 874
- [2] Arp, H. 1964, ApJ, 139, 1045
- [3] Battaglia, G., et al. 2005, MNRAS, 364, 433
- [4] Bell E. F., McIntosh D. H., Katz N., & Weinberg M. D., 2003, ApJ, 585, 117
- [5] Bender, R., et al. 2005, ApJ, 631, 280
- [6] Bertin, E., & Arnouts, S. 1996, A&AS, 117, 393
- [7] Block, D. L., Puerari, I., Frogel, J. A., Eskridge, P. B., Stockton, A., & Fuchs, B. 1999, Ap&SS, 269, 5
- [8] Block, D. L., Freeman, K. C., Jarrett, T. H., Puerari, I., Worthey, G., Combes, F., & Groess, R. 2004, A&A, 425, L37
- [9] Blumenthal, G. R., Faber, S. M., Flores, R., Primack, J. R. 1986, ApJ 301, 27
- [10] Booth, C. M., & Schaye, J. 2010, MNRAS, 405, L1
- [11] Braun, R. 1991, ApJ, 372, 54
- [12] Bruzual, G., & Charlot, S., 2003, MNRAS, 344, 1000
- [13] Bullock, J. S., Dekel, A., Kolatt, T. S., Kravtsov, A. V., Klypin, A. A., Porciani, C., & Primack, J. R. 2001a, ApJ, 555, 240
- [14] Caon, N., Capaccioli, M., & D’Onofrio, M. 1993, MNRAS, 265, 1013
- [15] Capaccioli, M. 1989, In The World of Galaxies, ed. H. G. Corwin, & L. Bottinelli (Berlin: Springer-Verlag), 208
- [16] Ciotti, L. 1991, A&A, 249, 99
- [17] Considère, S., & Athanassoula, E. 1988, A&AS, 76, 365
- [18] Corbelli, E., & Salucci, P. 2000, MNRAS, 311, 441
- [19] Corbelli, E., & Walterbos, R. A. M. 2007, ApJ, 669, 315
- [20] de Jong, R. S. 1996, A&AS, 118, 557
- [21] de Vaucouleurs, G. 1948, Ann. Astrophys., 11, 247
- [22] de Vaucouleurs, G. 1959, Handbuch der Physik, 53, 275
- [23] de Vaucouleurs, G., de Vaucouleurs, A., Corwin, H. G., Jr., Buta, R. J., Paturel, G., & Fouqué, R. 1991, The Third Reference Catalog of Bright Galaxies (New York: Springer) (RC3)
- [24] Diemand, J., Zemp, M., Moore, B., Stadel, J., & Carollo, C. M. 2005, MNRAS 364, 665
- [25] D’Onofrio, M. 2001, MNRAS, 326, 1517
- [26] Garcia-Gomez, C., & Athanassoula, E. 1993, A&AS, 100, 431
- [27] Gebhardt, K., et al. 2001, AJ, 122, 2469
- [28] Gentile, G., Salucci, P., Klein, U., Vergani, D., & Kalberla, P. 2004, MNRAS 351, 903
- [29] Gentile, G., Burkert, A., Salucci, P., Klein, U., & Walter, F. 2005, ApJ 634, L145
- [30] Ghez, A. M., Salim, S., Hornstein, S. D., Tanner, A., Lu, J. R., Morris, M., Becklin, E. E., & Duchêne, G. 2005, ApJ, 620, 744
- [31] Graham, A. W. 2001a, MNRAS, 326, 543
- [32] Graham, A. W. 2001b, AJ, 121, 820
- [33] Graham, A. W., & Driver, S. 2005, PASA, 22, 118
- [34] Häring, N., & Rix, H.-W. 2004, ApJ, L89
- [35] Helou, G., Lu, N. Y., Werner, M. W., Malhotra, S., & Silbermann, N. 2000, ApJ, 532, L21
- [36] James, P. A., & Seigar, M. S. 1999, A&A, 350, 791
- [37] Jedrzejewski, R. I. 1987, MNRAS, 226, 747
- [38] Khosroshahi, H. G., Wadadekar, Y., & Kembhavi, A. 2000, ApJ 533, 162
- [39] Klypin, A. A., Zhao, H., & Somerville, R. S. 2002, ApJ, 573, 597
- [40] Kormendy, J., & Bender, R. 2011, Nature, 469, 377
- [41] Kuzio de Naray, R., McGaugh, S. S., de Blok, W. J. G., & Bosma, A. 2006, ApJS 165, 461
- [42] Kuzio de Naray, R., McGaugh, S. S., & de Blok, W. J. G. 2008, ApJ 676, 920
- [43] Kuzio de Naray, R., & Kaufmann, T. 2010, MNRAS, submitted (arXiv1012.3471)
- [44] Magorrian, J., et al. 1998, AJ 115, 2285
- [45] Magrini, L., Corbelli, E., & Galli, D. 2007, A&A, 470, 843
- [46] Maraston, C. 2005, MNRAS, 362, 799
- [47] Möllenhoff, C., & Heidt, J. 2001, A&A, 368, 16
- [48] Moore, L., & Parker, Q. A. 2006, PASA. 23. 165
- [49] Navarro, J. F., Frenk, C. S., & White, S. D. M. 1997, ApJ, 490, 493
- [50] Navarro, J. F., Hayashi, E., Power, C., Jenkins, A. R., Frenk, C. S., White, S. D. M., Springel, V., Stadel, J., & Quinn, T. R. 2004, MNRAS 349, 1039
- [51] Paturel, G., Petit, C., Prugniel, P., Theureau, G., Rousseau, J., Brouty, M., Dubois, P., & Cambresy, L. 2003, A&A, 412, 45
- [52] Prugniel, P., & Simien, F. 1997, A&A, 321, 111
- [53] Regan, M. W., & Vogel, S. S., 1994, ApJ, 434, 536
- [54] Sandage, A., & Humphreys, R. M. 1980, ApJ, 236, L1
- [55] Satyapal, S., Vega, D., Dudik, R. P., Abel, N. P., & Heckman, T. 2008, ApJ, 677, 926
- [56] Schröder, M. F. S., Pastoriza, M. G., Kepler, S. O., & Puerari, I., 1994, A&AS, 108, 41
- [57] Seigar, M. S. 2008, PASP, 120, 945
- [58] Seigar, M. S., & James, P. A. 1998, MNRAS, 299, 672
- [59] Seigar, M. S., Block, D. L., & Puerari, I. 2004, in Penetrating Bars Through Masks of Cosmic Dust: The Hubble Tuning Fork Strikes a New Note, ed. D. L. Block, I. Puerari, K. C. Freeman, R. Groess, & E. K. Block (Dordrecht: Springer), 155
- [60] Seigar, M. S., Block, D. L., Puerari, I., Chorney, N. E., & James, P. A. 2005, MNRAS, 359, 1065
- [61] Seigar, M. S., Bullock, J. S., Barth, A. J., & Ho, L. C. 2006, ApJ, 645, 1012
- [62] Seigar, M. S., Barth, A. J., & Bullock, J. S. 2008a, MNRAS, 389, 1911
- [63] Seigar, M. S., Kennefick, D., Kennefick, J., & Lacy, C. H. S. 2008b, ApJ, 678, L93
- [64] Sérsic, J.-L. 1963, Bol. Asoc. Argentina Astron., 6, 41
- [65] Sérsic, J.-L. 1968, Atlas de Galaxies Australes. Observatorio Astronomico, Cordoba
- [66] Shankar, F., Lapi, A., Salucci, P., de Zotti, G., & Danese, L. 2006, ApJ 643, 14
- [67] Simon, J. D., Bolatto, A. D., Leroy, A., Blitz, L., & Gates, E. L. 2005, ApJ, 621, 757
- [68] Spano, M., Marcelin, M., Amram, P., Carignan, C., Epinat, B., & Hernandez, O. 2008, MNRAS, 383, 297
- [69] Springel, V., et al. 2005, Nature 435, 629
- [70] Swaters, R. A., Madore, B. F., van den Bosch, F. C., & Balcells, M. 2003, ApJ, 583, 732
- [71] Wechsler, R. H., Bullock, J. S., Primack, J. R., Kravtsov, A. V., & Dekel, A. 2002, ApJ 568, 52
- [72] Zentner, A. R., & Bullock, J. S. 2002, Phys. Rev. D, 66, 043003