Photon multiplicity measurements at forward rapidity in the ALICE experiment at CERN
Abstract
We present the first preliminary results on photon multiplicity measurements at LHC at forward pseudorapidity (2.3 3.9) in proton-proton () collisions at = 7 TeV. The multiplicity distribution is found to be reasonably well explained by a double Negative Binomial Distribution (NBD). The average photon multiplicity increases logarithmically with . It is found that none of the models we used (PYTHIA6D6T, PHOJET, and HERWIG) could explain the data.
1 Introduction
One of the aims of studying the relativistic heavy-ion collisions is to create, study and understand a system of deconfined states of quarks and gluons commonly known as the Quark-Gluon-Plasma (QGP). A set of proposed signatures provides evidences for the formation of such a system in these collisions. Measurements in collisions define a baseline for drawing a definite conclusion in heavy-ion collisions. Recently, measurements of multiplicity and pseudorapidity distributions have been reported for charged particles at midrapidity in collisions for = 0.9, 2.36, and 7 TeV by ALICE, CMS and ATLAS experiments at CERN-LHC [1, 2]. Photon measurements provide complementary information. The majority of photons emitted from the reaction are decay products of produced particles. The multiplicity measurements at forward pseudorapidity represent an additional tool for testing the limiting fragmentation (LF) hypothesis which is found to hold at lower energies [3].
In this article, we report the first measurement of the multiplicity distribution of inclusive photons at forward pseudorapidities of 2.3 to 3.9 using the ALICE detector at the CERN-LHC for collisions at = 7 TeV.
2 The experiment and data analysis
The present analysis uses data from the Photon Multiplicity Detector (PMD). The PMD is a preshower detector with a three radiation length thick lead converter sandwiched between two planes of highly granular gas proportional counters. The information from one of the detector planes, placed in front of the converter is used to veto the charged particles, whereas the preshower data from the other detector plane is used for photon identification [4]. In the present analysis data from preshower plane only is used.
We use triggered event sample (OR between the signals from the Silicon Pixel Detector and the VZERO, [1]) which corresponds to the minimum bias inelastic (INEL) events. Events with vertex Z-position within 10 cm from the interaction point are analyzed. The total number of events used in the analysis after the trigger and the vertex selections is around 390 K.
3 Photon reconstruction and unfolding method
The reconstruction of photons is achieved by finding clusters of hits and then discriminating photons and hadrons. A simple clustering algorithm with a contiguous cell search is employed to find the clusters. The properties of each cluster with regard to the number of cells (cluster ) contained in it and the total energy deposition (ADC) have been obtained. Discrimination between photons and hadrons is made by using a threshold method by putting a cut-off in the cluster and ADC content.


The method used to correct the measured raw distribution for efficiency, acceptance and other detector effects, is based on unfolding with -minimization with regularization, similar to what is followed for charged particles measurement [1]. In this method all the detector effects are described by a response matrix, A. The matrix element gives the conditional probability that an event with true multiplicity t is measured as an event with the multiplicity m (see Ref. [5] and references therein for detail). Figure 1(Left) shows the PMD detector response in terms of reconstructed photon multiplicity vs. true photon multiplicity within 2.3 3.9 in collisions at = 7 TeV using 1.2 M events from the PHOJET event generator. The detector simulation is done using GEANT3 package in ALICE environment. This 2-dimensional distribution forms the response matrix to unfold the measured distribution in data. The unfolded spectrum is found by minimizing
where is the error in the measurement g, and U is the guessed spectrum. A regularization term P(U) is added to the -function to get rid of the spurious oscillations in the solution. The coefficient is the weight factor. Figure 1(Right) shows the true, measured and unfolded multiplicity distributions of photons (Top) and the ratio of unfolded to true distributions (Bottom) using simulated data. The ratio between the unfolded and the true distribution is unity within 10% up to a multiplicity 40 indicating that the performance of the method is satisfactory.
4 Results and Discussion
Figure 2 (Left) shows the multiplicity distribution of photons within 2.3 3.9 compared to the model predictions from PYTHIA6D6T, PHOJET, and HERWIG. The ratios between the data and the models are shown in Figure 2 (Right).
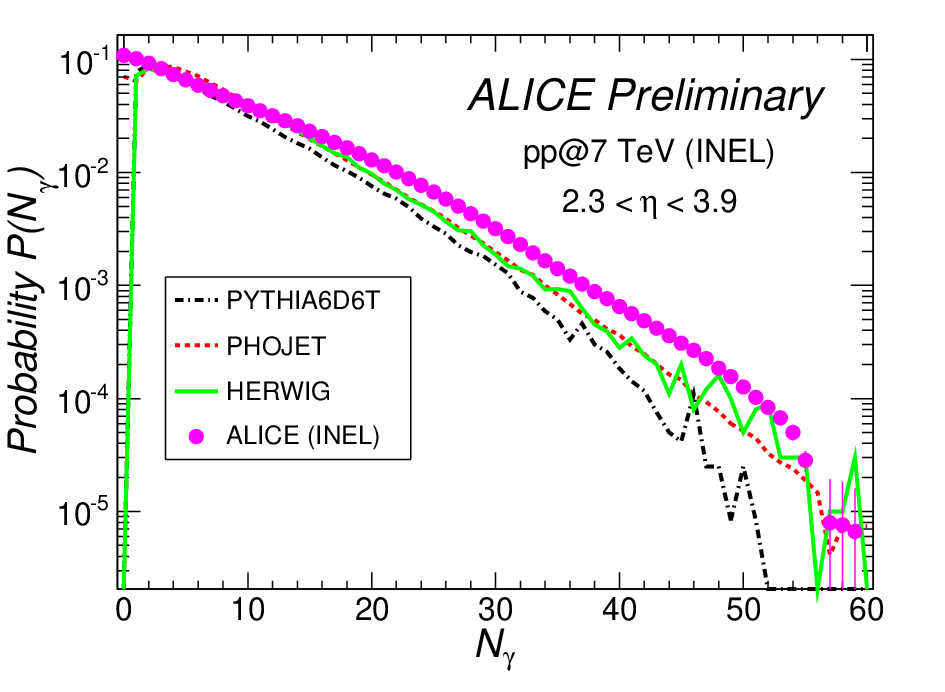

It is found that none of the models reproduces the data. At higher multiplicities ( 10) all models under-predict the data. However, at lower multiplicities ( 10), PYTHIA under-predicts the data whereas PHOJET and HERWIG seems to over-predict the data. The multiplicity distribution of photons can be described by a double NBD as shown in Figure 3 (Left). Studies show that a single NBD explains the data up to a multiplicity of 30 only, at higher multiplicities ( 30) it over-predicts the data. Figure 3 (Right) shows the dependence of the average number of photons per event within 2.3 3.9 for non-single diffractive (NSD) events. The data points at lower energies are obtained from Ref. [6]. In Ref. [6] the UA5 experiment presented the results for NSD events, therefore, the data points at 7 TeV, which are measured for INEL events, are scaled to the corresponding NSD using PYTHIA simulations. The solid line is the fit to the data points with a logarithmic function of the form p0 + p1 .


The average number of photons within 2.3 3.9 for NSD events increases with , and the dependence is found to be logarithmic of the form as mentioned earlier. For comparison our results for INEL are also shown in Figure 3 (Right).
5 Summary
In summary, we have presented the first measurement of multiplicity distribution of photons produced in collisions at the LHC, at forward pseudorapidity (2.3 3.9) using the PMD data at = 7 TeV for INEL events. The multiplicity distribution is found to be reasonably well explained by a double NBD. The average photon multiplicity for NSD events increases with and the dependence on is found to be logarithmic of the form p0 + p1 . The multiplicity distribution is compared with the available model predictions from PYTHIA6D6T, PHOJET and HERWIG and it is found that none of them could explain the data.
References
- [1] ALICE Collaboration, Eur. Phys. J. C68, 89 (2010).
- [2] ALICE Collaboration, Eur. Phys. J. C65, 111 (2010); ALICE Collaboration, Eur. Phys. J. C68, 345 (2010); CMS Collaboration, JHEP 1002, 041 (2010); CMS Collaboration, Phys. Rev. Lett. 105, 022002 (2010); ATLAS Collaboration, Phys. Lett. B688, 21 (2010).
- [3] STAR Collaboration, Phys. Rev. Lett. 95, 062301 (2005); STAR Collaboration, Phys. Rev. C73, 034906 (2006); STAR Collaboration, Nucl. Phys. A832, 134 (2010); J. Benecke et al., Phys. Rev. 188, 2159 (1969).
- [4] ALICE Technical Design Report on Photon Multiplicity Detector, CERN/LHCC/99-32, 1999; ALICE Technical Design Report on Photon Multiplicity Detector, Addendum-1, CERN/LHCC 2003-038 (2003); M. M. Aggarwal et al., Nucl. Instrum. Methods Phys. Res., Sect. A488, 131 (2002).
- [5] Sidharth Kumar Prasad, Ph.D. Thesis, Calcutta University, 2011.
- [6] UA5 Collaboration, Z. Phys. C43, 75 (1989).