First Observation of the Decays
Abstract
We present a study of the -wave spin -triplet charmonium decays () into . The analysis is based on 106 million decays recorded with the BESIII detector at the BEPCII electron positron collider. The decay into the hadronic final state is observed for the first time. We measure the branching fractions , , and , where the uncertainties are statistical and systematical, respectively.
pacs
13.25.Gv, 14.40.Pq, 13.20.GdI Introduction
In the quark model, the () mesons are the charmonium states. Their decays are experimentally and theoretically not as well studied as the vector charmonium states and . In contrast to the latter ones, cannot be produced directly in annihilation. However, they can be produced in radiative decays , providing a clean environment to study their decays.
Recent theoretical work indicates that the Color Octet Mechanism [1] could have large contributions to the decays of the -wave charmonium states. However, these calculations as well as experimental measurements still have large errors and thus more precise experimental data besides more theoretical efforts are mandatory to further understand decay dynamics. Furthermore, the and states are expected to annihilate via two-gluon processes into light hadrons and may therefore allow the study of glueball dynamics. Thus the measurement of as many exclusive hadronic decays as possible is valuable.
The decays into four pions have the largest branching fractions among the known hadronic decay modes [5]. Presently only the decays into and into are measured by previous experiments. The branching fractions are shown in Table 1. In this paper, we present a study of exclusive decays into .
| channel | branching fraction [%] |
|---|---|
II The BESIII Experiment and Data Set
We use a data sample of about 106 million decays recorded with the BESIII detector [3] at the energy-symmetric double-ring collider BEPCII [4]. The primary data sample corresponds to an integrated luminosity of 156.4 collected at the peak of the resonance. In addition, a 42.6 data sample collected about 36 below the resonance is used for background studies.
The BESIII detector is described in detail elsewhere [3]. Charged particle momenta are measured with a small-celled, helium gas-based main drift chamber with 43 layers operating within the magnetic field of a solenoidal superconducting magnet. Charged particle identification is provided by measurements of the specific ionization energy loss in the tracking device and by means of a plastic scintillator Time of Flight system composed of a barrel part and two end caps. Photons are detected and their energies and positions measured with an electromagnetic calorimeter (EMC) consisting of 6240 CsI(Tl) crystals arranged in a barrel and two end caps. The return yoke of the magnet is instrumented with Resistive Plate Chambers arranged in 9 (barrel) and 8 layers (end caps) for discrimination of muons and charged hadrons.
III Data Selection
We reconstruct the entire event from the decay chain of the charmonium transitions followed by the hadronic decays . A photon candidate is defined as a shower detected with the EMC exceeding an energy deposit of 25 in the barrel region (covering the region of the polar angle) and of 50 in the end caps (). The average event vertex of each run is assumed as the origin of these candidates. We restrict the analysis to events having nine photon candidates and no reconstructed charged particle. The energy sum of the nine photons must be within the range 3.45-3.80. To reconstruct candidates we use pairs of photon candidates, having an invariant mass between 110 and 150. Fig. 1 shows the invariant mass distribution of all photon pair combinations for selected events. A clear signal is visible. By combining four candidates with an additional photon candidate being detected in the EMC barrel, where the same photon candidate must not be used more than once, the complete event is reconstructed. Different pairings of the photon candidates can yield more than one candidate per event. Therefore we use the pairing which leads to the minimal
| (1) |
calculated from the invariant mass of the candidate for a given candidate, the nominal mass [5] , and the invariant mass resolution of 6.5. Combinatorial background is suppressed strongly by demanding .
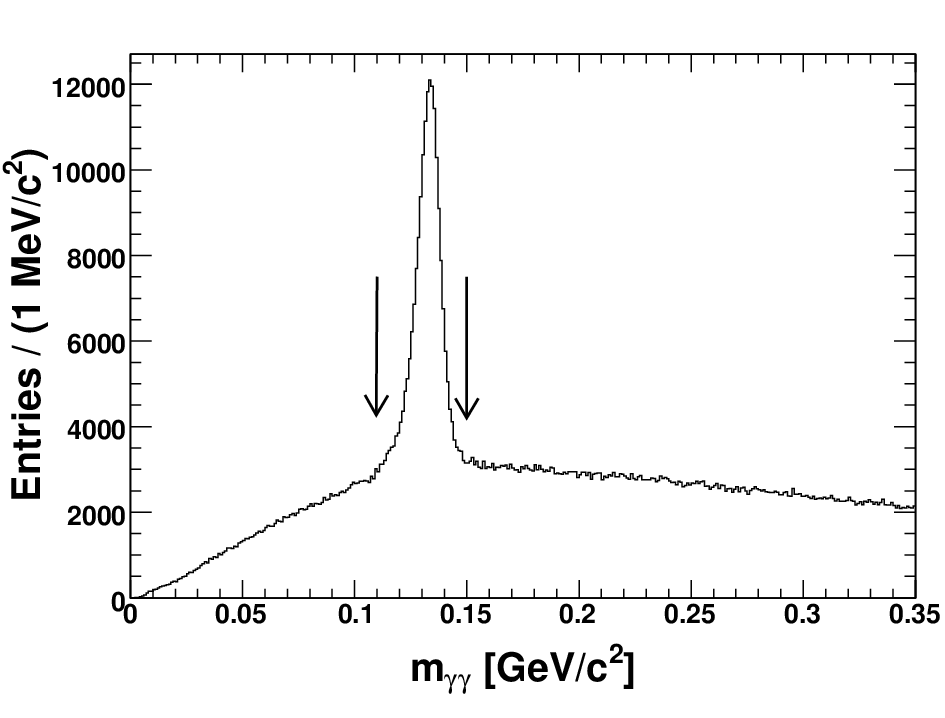
Potential backgrounds can arise from the transition followed by hadronic or radiative decays of the to final states with higher photon multiplicity. We therefore require the recoil mass of any di- pair with respect to the to be , where is the nominal mass [5].
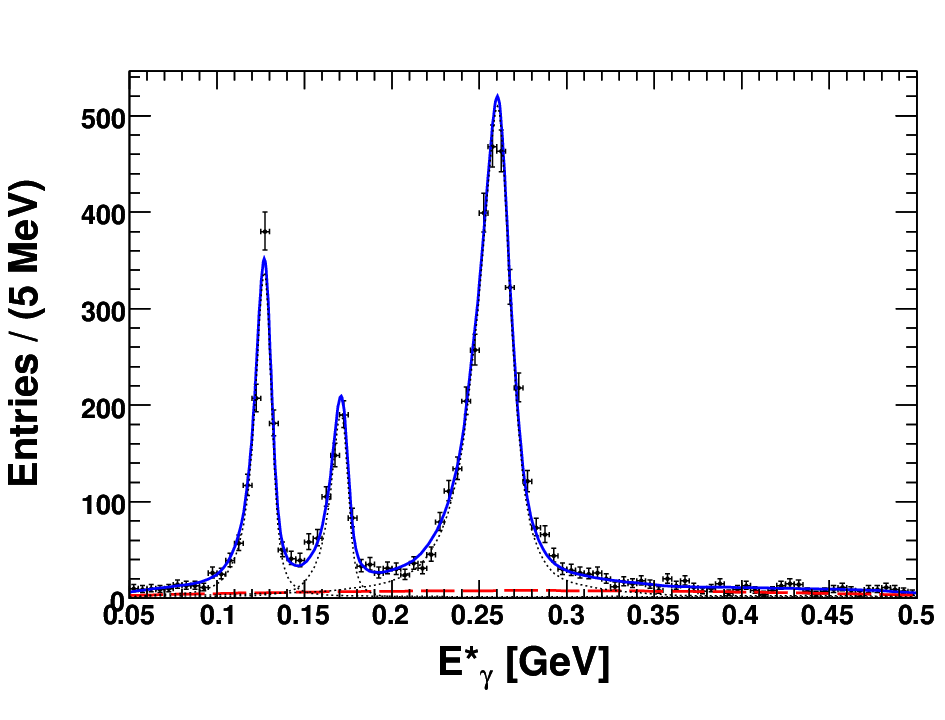
The spectrum of the energy of the photon from the radiative transition in the center of mass frame is shown in Fig. 2. Clear , ,and signals with small background are evident. Analysis of the continuum data sample yields only four events passing the selection criteria and thus reveals no significant background. Peaking components of the background are investigated from simulated Monte Carlo (MC) events and are discussed in Sec. IV.
We further look into resonant substructures in the final state. The production of intermediate resonances in the decay could have an impact on the detection efficiencies. Here, we only investigate the gross substructures by plotting the invariant mass of any di- pair in the final state versus the corresponding mass of the other pair for the three signal regions (Fig. 3). The defined , , and signal regions correspond to energy ranges of 220-290, 160-180, and 115-135, respectively. As seen in Fig. 3 production of and in the decay is evident. Accumulation of events is also observed in the mass region around 1300, 1700, and 1950. Structures around 1300 are observed in and decays. All these structures need further careful investigation using partial wave analysis techniques with increased data samples being collected in the future. As for decays, production is also observed in decays, while the decay is forbidden by parity-conservation.
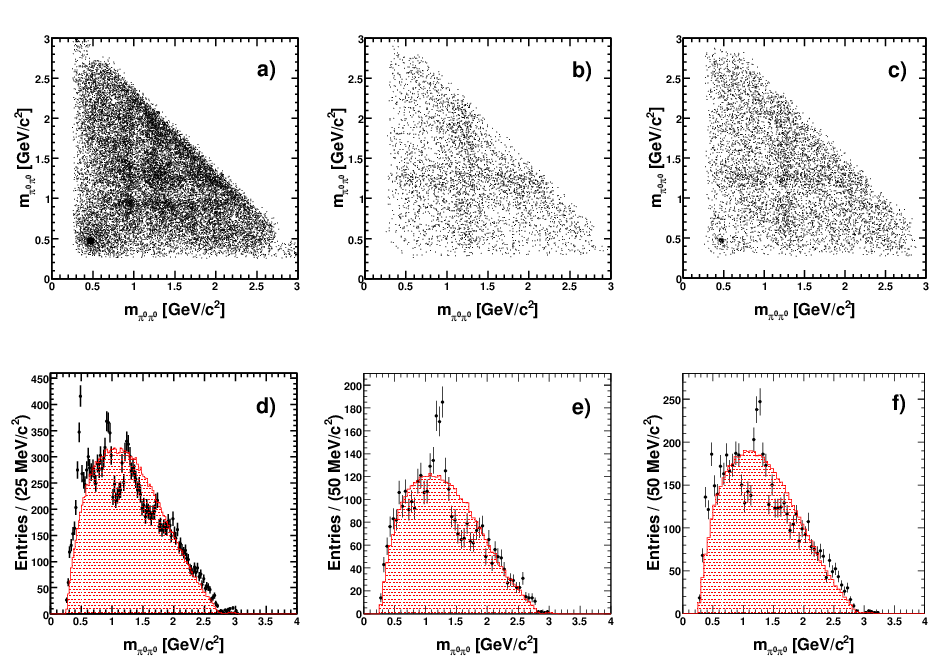
For the measurement of branching fractions we include all sub-resonant decay modes but explicitly exclude the and decay mode to . Therefore we reject events where the invariant mass of any di- pair and the invariant mass of the corresponding other di- pair of the final state fulfills , where is the nominal mass [5].
IV Monte Carlo Studies
A detailed MC simulation of the BESIII detector based on geant4 [6] is used to determine efficiencies, signal shapes, and background contributions. The production of the resonance is simulated using the kkmc event generator [7]. Decays of the and subsequent particles in the event are modeled by evtgen [8]. Simulated events pass the same reconstruction algorithms and selection criteria as data.
Signal MC data samples of 500k events for each decay , are generated using a distribution, where is the angle between the direction of the radiative photon and the positron beam, and for in accord with expectations for electric dipole (E1) transitions. The decay products are generated using a flat angular distribution. Intrinsic width and mass values as given in [5] are used for the states in the simulation. The obtained efficiencies for , , and are , , and , respectively, including detector acceptance as well as reconstruction and selection efficiencies.
In addition we use MC data samples to investigate sources of the peaking backgrounds. For each of the studied decay modes listed in Table 2 we generated at least 100k events. The contribution of the total peaking background is estimated from a fit to the reconstructed spectrum. The fit procedure is the same as applied for data and will be addressed in Sect. V. The largest peaking background contribution is found to come from decays, with , where one of the has low momentum and is not detected.
| channel | |||
| 1.6 | 0.3 | 0 | |
| 0.2 | 0 | 0 | |
| 1.2 | 45.2 | 0 | |
| 0 | 1.3 | 0 | |
| 0 | 0 | 0.1 | |
| 0 | 0 | 0.6 | |
| 0 | 0 | 3.8 | |
| 0 | 0 | 0 | |
| 0 | 0 | 0.6 | |
| 0 | 0 | 0 | |
| Sum | 3.0 | 46.8 | 5.1 |
V Fitting Procedure and Extraction of Branching Fractions
The spectrum shown in Fig. 2 is fitted using an unbinned maximum likelihood fit. The signal line shapes are extracted from the MC simulation. A 2nd order Chebychev polynomial is used to describe the non-peaking background. From the fit , , and signal yields of , , and , respectively, are obtained.
To access the goodness of the fit, we repeat the fit to the spectrum using a binned least-squared fit. Applying a binning of 5, this fit yields a value of 102 with 84 degrees of freedom.
The fit does not account for the peaking component of the background. We estimate the number of events peaking at the position of the signals by fitting the spectrum derived from the MC samples generated for background studies. The same fitting procedure as for data is applied, except that the parameters of the polynomial function describing the shape of the non-peaking combinatorial background are fixed to the values obtained from the fit to data. From the extracted signal yields the expected number of peaking background events is calculated using the branching fractions of the decays as given in [5]. We relate the unmeasured branching fractions of the decays to the corresponding branching fractions of decays by the iso-spin ratio of the two final states. The estimated number of peaking background events for the investigated channels is given in Table 2. In total a peaking background of 3.0, 46.8 and 5.1 events to the , , and signals, respectively, is derived. The largest contribution arises from the decay , amounting to 45 events at the signal region.
Although and decays for the branching fraction measurement were excluded, we considered these channels as a potential peaking background source. The feed-through of the two decays to the , , and signals is expected to be 1.6, 0.3, and 0.6 events, respectively.
The expected number of peaking background events is subtracted from the yields observed for data. These corrected yields are then converted to branching fractions using
| (2) |
where is the efficiency; is the number of in the data sample; and and are the branching fractions of radiative transitions into and of the decay [5], respectively. The number of and its combined statistical and systematical uncertainties are determined to be [9].
VI Estimation of Systematic Uncertainties
Several sources of systematic uncertainties are considered for the measurement of the branching fractions, including uncertainties on the photon detection and reconstruction; the event selection; the fitting procedure and peaking background subtraction; and the number of decays in the data sample. The investigated uncertainties are summarized in Table 3 and will be discussed in detail in the following.
| photon detection | 9.0 | 9.0 | 9.0 |
| decay model | 6.3 | 6.3 | 6.3 |
| 3.2 | 4.3 | 4.0 | |
| number of events | 4.0 | 4.0 | 4.0 |
| total energy | 3.0 | 3.0 | 3.0 |
| 2.5 | 2.5 | 2.5 | |
| reconstructed mass | 1.4 | 1.4 | 1.4 |
| fitting range | 1.4 | 2.9 | 0.9 |
| signal line shape (energy resolution) | 0.5 | 1.2 | 0.4 |
| signal line shape (energy shift) | 0.1 | 0.6 | 1.0 |
| background shape | 1.0 | 1.0 | 1.0 |
| peaking background subtraction | |||
| MC statistics | 0.5 | 0.5 | 0.5 |
| trigger efficiency | 0.1 | 0.1 | 0.1 |
| total uncertainty | 13.2 | 13.6 | 13.2 |
Photon Detection
The uncertainty due to photon detection and conversion is 1% per photon. This is determined from studies of photon detection in well understood decays such as and the study of photon conversion in the process .
Event Selection
By varying the requirement on , the mass window and the total energy of the candidates used for the event selection in data and MC events, we investigate the systematic uncertainties in modeling the distribution of these parameters. The largest deviation of the branching fractions from the default values sets the scale of our systematic uncertainty, and we assign a uncertainty of 2.5% for the ; 3% for the total energy; and 1.4% for the mass window requirement.
Monte Carlo Decay Model
The efficiencies for the processes , are determined from MC simulations, where no intermediate resonances and a flat angular distribution have been considered in the decays. As discussed in Sect. III this analysis reveals the presence of intermediate resonances in the decays. This could have an impact on the detection efficiencies, which we consider as a systematic uncertainty. We determine the efficiencies from our simulations including the sub-resonant modes , , , and for . We considered for and and for . We find there is no large efficiency difference from that of phase space. The largest difference with respect to the efficiency obtained for the simulation without intermediate resonances is observed for decay. We take this difference as a conservative estimate of the uncertainty due to the MC decay model and assign a uncertainty of 6.3% for the , , and branching fractions.
Fitting Procedure
The yields determined from the fit to the spectrum determines the branching fractions. We repeat the fit with appropriate modifications to estimate the systematic uncertainties due to the fitting procedure. The difference of the derived branching fractions with respect to the values derived from the standard fit is considered as a systematic uncertainty.
We smear the resolution function of the signals obtained from MC simulations by to estimate the systematic uncertainties of modeling the photon resolution in the MC simulation and shift the signal mean values by to estimate the systematic uncertainties due to the absolute energy calibration. The assigned uncertainties are given in Table 3. To estimate the uncertainty due to the non-peaking background parametrization we use a third order instead of a second order Chebychev polynomial. This uncertainty is found to be . For the nominal fit, the spectrum is fitted in the interval 0.05-0.5. A series of fits using different intervals is performed and the largest change of the individual branching fractions is assigned as a systematic uncertainty (see Table 3).
Peaking Background Subtraction
The number of peaking background events is estimated from MC simulations and is subtracted from the signal yields obtained from the nominal fit. The major source of peaking background is the decay . To determine the number of background events, the branching fraction of this decay mode is computed from the branching fraction exploiting the isospin relation of the two decays. The uncertainty of the branching fraction of leads to a systematic uncertainty of 0.8% for . For and we take the number of subtracted background events as systematic uncertainties.
Other Systematic Uncertainties
For the normalization of the branching fractions, the number of events in the data sample determined according to the method as given in [9] is used. This method yields a systematic uncertainty of . The uncertainty due to the branching fractions is 3.2% for , 4.3% for , and 4.0% for .
A systematic uncertainty of 0.5% is assigned due to the statistical error of the efficiencies as determined from MC simulations.
The systematic uncertainty due to the simulation of the trigger efficiency is found to be less than [10].
Total Systematic Uncertainty
We assume that all systematic uncertainties given above are independent and add them in quadrature to obtain the total systematic uncertainty.
VII Conclusion
In summary we have measured the branching fractions of decays , , for the first time, where the quoted uncertainties are statistical and systematical, respectively. The hadronic final state contains a rich substructure of intermediate resonances. The reported branching fractions include decay modes with intermediate resonances except and , which have been removed from this measurement. Our observation improves the existing knowledge of the states and provides further insight into their decay mechanisms. Based on our results detailed studies of the sub-resonant decay structure with increased data samples may follow in the future.
VIII Acknowledgments
The BESIII collaboration thanks the staff of BEPCII and the computing center for their hard efforts. This work is supported in part by the Ministry of Science and Technology of China under Contract No. 2009CB825200; National Natural Science Foundation of China (NSFC) under Contracts Nos. 10625524, 10821063, 10825524, 10835001, 10935007; the Chinese Academy of Sciences (CAS) Large-Scale Scientific Facility Program; CAS under Contracts Nos. KJCX2-YW-N29, KJCX2-YW-N45; 100 Talents Program of CAS; Istituto Nazionale di Fisica Nucleare, Italy; Russian Foundation for Basic Research under Contracts Nos. 08-02-92221, 08-02-92200-NSFC-a; Siberian Branch of Russian Academy of Science, joint project No 32 with CAS; U. S. Department of Energy under Contracts Nos. DE-FG02-04ER41291, DE-FG02-91ER40682, DE-FG02-94ER40823; University of Groningen (RuG) and the Helmholtzzentrum fuer Schwerionenforschung GmbH (GSI), Darmstadt; WCU Program of National Research Foundation of Korea under Contract No. R32-2008-000-10155-0
References
- [1] G.T. Bodwin, E. Braaten and G.P. Lepage, Phys. Rev. D 51, 1125 (1995); H.-W. Huang and K.-T. Chao, Phys. Rev. D 54, 6850 (1996); A. Petrelli, Phys. Lett. B 380, 159 (1996); J. Bolz, P. Kroll and G. A. Schuler, Eur. Phys. J. C 2, 705 (1998); S.H.M. Wong , Eur. Phys. J. C 14, 643 (2000).
- [2] C. Amsler and F.E. Close, Phys. Rev. D 53, 295 (1996).
- [3] M. Ablikim et al. (BESIII Collaboration), Nucl. Instrum. Meth. A 614, 345 (2010).
- [4] J.Z. Bai et al. (BES Collaboration), Nucl. Instrum. Meth. A 344, 319 (1994); J.Z. Bai et al. (BES Collaboration), Nucl. Instrum. Meth. A 627, 319 (2001).
- [5] K. Nakamura et al. (Particle Data Group), J. Phys. G 37, 075021 (2010).
- [6] S. Agostinelli et al. (geant4 Collaboration), Nucl. Instrum. Meth. A 506, 250 (2003).
- [7] S. Jadach, B.F.L. Ward and Z. Was, Comput. Phys. Commun. 130, 260 (2000); S. Jadach, B.F.L. Ward and Z. Was Phys. Rev. D 63, 113009 (2001).
- [8] D.J. Lange et al., Nucl. Instrum. Meth. A 462, 1 (2001).
- [9] M. Ablikim et al. (BESIII Collaboration), Phys. Rev. D 81, 052005 (2010).
- [10] N. Berger, K. Zhu et. al., Trigger efficiencies at BESIII, Chinese Physics C 34, 1779 (2010)