Galaxy counterparts of metal-rich damped Ly absorbers – II. A solar-metallicity and dusty DLA at Thanks: Based on observations carried out under prog. ID 084.A-0303 with the X-shooter spectrograph installed at the Cassegrain focus of the Very Large Telescope (VLT), Unit 2 – Kueyen, operated by the European Southern Observatory (ESO) on Cerro Paranal, Chile.
Abstract
This is the second paper in a series reporting on results from a survey conducted with the ESO VLT/X-shooter spectrograph. We target high metallicity damped Lyman- absorbers (DLAs) with the aim of investigating the relation between galaxies detected in emission and those detected in absorption. Here, we report on the discovery of the galaxy counterpart of the DLA on the line-of-sight to the quasar SDSS J 091826.16163609.0 (hereafter Q 09181636). The galaxy counterpart of the DLA is detected in the Oiii and Oii emission lines redshifted into the NIR at an impact parameter of 2.0 arcsec (16 kpc at ). Ly emission is not detected down to a detection limit of erg s-1 cm-2, which, compared to the strength of the oxygen lines, implies that Ly emission from this galaxy is suppressed by more than an order of magnitude. The DLA has one of the highest metallicities measured so far at comparable redshifts. We find evidence for substantial depletion of refractory elements onto dust grains. Fitting the main metal line component of the DLA, which is located at , we measure metal abundances from \textZn ii, \textS ii, \textSi ii, \textCr ii, \textMn ii, \textFe ii and \textNi ii of , , , , , and , respectively. In addition, we detect absorption in the Lyman and Werner bands of molecular hydrogen (H2), which represents the first detection of H2 molecules with X-shooter. The background quasar Q 09181636 is amongst the reddest QSOs at redshifts from the SDSS catalogue. Its UV to NIR spectrum is well fitted by a composite QSO spectrum reddened by SMC/LMC-like extinction curves at with a significant amount of extinction given by mag. This supports previous claims that there may be more metal-rich DLAs missing from current samples due to dust reddening of the background QSOs. The fact that there is evidence for dust both in the central emitting regions of the galaxy (as evidenced by the lack of Ly emission) and at an impact parameter of 16 kpc (as probed by the DLA) suggests that dust is widespread in this system.
Keywords:
galaxies: formation – galaxies: high-redshift – galaxies: ISM – quasars: absorption lines – quasars: individual: SDSS J 091826.16163609.0 – cosmology: observations1 Introduction
The comparison between absorption-line selected and emission-selected galaxies at redshifts has a long history (e.g., Smith et al., 1989; Møller & Warren, 1993; Wolfe et al., 2005, and references therein). However, progress in this field has been slow and, for many years, there has been little overlap between observational samples (Fynbo et al., 1999; Møller et al., 2002; Colbert & Malkan, 2002; Kulkarni et al., 2006, e.g.,). Recently, some progress has been made though in order to build the bridge between the two populations. Emission-selected galaxies have been studied to much deeper rest frame flux limits than a decade before (Sawicki & Thompson, 2006; Gronwall et al., 2007; Rauch et al., 2008; Ouchi et al., 2008; Grove et al., 2009; Reddy & Steidel, 2009; Cassata et al., 2011, e.g.,). Fynbo et al. (2010, hereafter F10) also presented the first results from a small survey to search for the galaxy counterparts of metal-rich damped Ly absorbers (DLAs; see Wolfe et al., 2005, for a review). In F10, the detection of the galaxy counterpart of a high-metallicity DLA at toward Q 22220946 was presented. F10 described the strategy and sample selection of the survey in details. Here, we reiterate that the candidates were selected amongst SDSS QSOs based on the strengths of \textSi ii and \textFe ii absorption lines (i.e., not directly from Ly).
In this paper, we present new results based on observations of the second target of the survey, the quasar SDSS J 091826.16163609.0 (hereafter Q 09181636). Q 09181636 was selected as its spectrum features a metal-rich absorber at having rest frame equivalent widths (EWs) of the targeted \textSi ii and \textFe ii lines of 2.1 Å, 2.1 Å, 1.4 Å and 2.6 Å, respectively. The properties of this absorber will be the subject of another paper describing a sample of objects. For now, we note that this absorber, which is also a DLA, has a high metallicity with [Si/H. Here, we describe the serendipitous discovery and properties of a second DLA, at , along the line-of-sight to Q 09181636. This system happens to also fulfill our sample selection criteria, with rest frame EWs of 2.4 Å, 2.4 Å, 1.6 Å and 3.0 Å for \textSi ii and \textFe ii, respectively. The \textFe ii lines from this system are redshifted outside of the wavelength interval suited for automatic searches of absorption lines in SDSS spectra and hence were not identified. Interestingly also, neither of the two DLAs in this QSO spectrum have been identified in automatic DLA (i.e., Ly-based) searches in SDSS (Prochaska et al., 2005; Noterdaeme et al., 2009b). This is due to a recently identified bias against the detection of damped Lyman-alpha absorption lines at the blue end of the spectra (Noterdaeme et al., 2009b, see). Indeed, the signal-to-noise ratio is decreased significantly by the presence of any strong and/or several closeby DLA lines.
Throughout this paper, we assume a flat cosmology with , and a Hubble constant of km s-1 Mpc-1.
2 Observations and data reduction
Q 09181636 was observed on February 16 2010 with X-shooter at the VLT. The QSO was observed at three position angles (PAs), namely , and (all East of North). The purpose of using three slit positions is to cover a larger field of view around the QSO as shown in fig. 1 of F10. The integration time at each PA was 3600 s, and a 1.3-wide slit in the UVB arm and 1.2-wide slits in the VIS and NIR arms were used.
The expected resolving power with the above setup is 4000, 6700 and 4300 in the UVB, VIS and NIR arms, respectively. This is confirmed by the width of sky emission lines in the spectra. However, the seeing during the observations was significantly smaller than the widths of the slits (i.e., 0.67 arcsec in all three exposures as measured from the width of the QSO trace around 7500 Å) and hence the true spectral resolution is higher than that measured from sky emission lines. In the VIS arm, we measure the resolution directly from the width of telluric absorption lines. We then assume that the ratio between expected and true resolutions is the same in all three spectroscopic arms, and the degradation of seeing as a function of decreasing wavelength is calculated as the ratio of the wavelengths to the power of 0.2. In this way, we infer resolving power values of 6400, 11900 and 8800 in the UVB, VIS and NIR arm, respectively.
We processed the spectra using the X-shooter data reduction pipeline (see Goldoni et al., 2006, see also F10). First, raw frames were corrected for the bias level (UVB and VIS) or dark current (NIR). Then, after background subtraction, cosmic ray hits were detected and removed using the method developed by van Dokkum (2001) while sky emission lines were subtracted using the method described in Kelson (2003). After division by a master flat-field, the spectral orders were extracted and rectified in wavelength space using a wavelength solution previously obtained from calibration frames. The orders were then merged and in their overlapping parts the merging was weighted by the corresponding errors which were propagated in the process. From the resulting merged 2D spectrum, a one-dimensional spectrum of the QSO was extracted. This 1D spectrum together with its error file and bad-pixel map are the final products of the reduction. Intermediate products such as the sky spectrum and individual echelle orders (with errors and bad-pixel maps) were also produced. The spectra were flux-calibrated using a spectrophotometric standard star observed during the same night. The flux calibration was checked against the flux-calibrated SDSS QSO spectrum and found to be consistent with it.
3 Results
3.1 Emission properties of the DLA-galaxy counterpart
We do not detect Ly emission at any of the three position angles (see Fig. 1). We calculate a conservative 3 detection limit from a 1000 km s-1 2.0 arcsec square aperture inside the trough of the damped Ly absorption line. The velocity width of 1000 km s-1 is based on the Ly line from the galaxy counterpart of the DLA towards Q 22220946 (F10, see also theoretical profiles in Laursen et al. (2010)), whereas the spatial width of 2 arcsec is based on the fact that Ly emission can be quite extended (Møller & Warren, 1998; Fynbo et al., 2003; Rauch et al., 2008, e.g.,). The resulting limit is erg s-1 cm-2. Assuming that all Ly photons escape, case-B recombination and the relation between H luminosity and star formation rate (SFR) from Kennicutt (1998), we would place an upper limit on the SFR of 0.3 M☉ yr-1. Unfortunately, the expected position of the H emission line is in a part of the NIR spectrum where the sky background is too high to allow for a useful detection limit to be derived. However, we do detect the Oiii emission line in the PA spectrum at an impact parameter of 2.0 arcsec (see Fig. 1). The redshift of the Oiii line is consistent with that of low-ionisation metal lines to within an uncertainty of about 50 km s-1. This line is detected neither in the PA nor the PA spectra. We also detect both components of the Oii doublet but with a lower signal-to-noise ratio and in a region somewhat affected by telluric absorption lines. The flux of the Oiii line is erg s-1 cm-2, which corresponds to a luminosity of erg s-1. This is a lower limit due to the possibility of slit-loss. For the Oii doublet, we infer a total flux of about erg s-1 cm-2 after correcting for telluric absorption. Using the relation from Kennicutt (1998), we infer a SFR of about 20 M☉ yr-1. Hence, Ly emission from this system appears to be suppressed by more than an order of magnitude.
In order to exclude the possibility of the existence of a galaxy counterpart located at small impact parameter, we also performed spectral point spread function subtraction as in F10. No emission line is detected at an impact parameter smaller than 2 arcsec. Any line with a flux similar to or larger than the detected Oiii line would be detected in the data.

3.2 Absorption-line properties of the DLA
3.2.1 Metal lines
The total \textH i column density of the system is well constrained by the damped Ly absorption line to be \textH i (see Fig. 1), where the error is a conservative error on the uncertainty, which is dominated by the systematic error from the normalisation. In particular, the fact that the DLA line is located in the red wing of the \textO vi emission line of the QSO complicates the normalisation somewhat.
The absorption profiles of the strongest \textFe ii and \textMg ii lines span a velocity range of up to 600 km s-1 (see \textFe ii in the upper right panel of Fig. 2). However, most of the absorption as seen from unsaturated or weakly saturated lines from singly ionized species is concentrated within a single broad velocity component at . In order to derive overall metallicities in the neutral gas phase, we focus on fitting this main component. For the fitting, we use the package FITLYMAN as available in MIDAS. From the weak \textSi ii line, one can see that this main component is responsible for 85% of the total EW and hence most likely – at least – 85% of the total column density of low-ionisation species.
The results of Voigt-profile fitting are summarised in Table 1 and displayed in Fig. 2. The instrumental resolution FWHM is 47 and 25 km s-1 for the UVB- and VIS-arm spectra, respectively. With a broadening parameter km s-1, the fitted metal-line profile is well-resolved. However, should it include in reality one or several narrow components, hidden saturation could be an issue and strictly speaking our measurements should be considered as lower limits. This means that the overall metallicity of this DLA could be even higher than solar. However, apart from \textS ii and to some extent also \textSi ii, we are considering relatively weak absorption lines in the fitting process (see Fig. 2) so that the measured column densities for the corresponding species should depend weakly on individual values if at all.
The usual complications of line blending in low-resolution spectra are avoided here as a single well-defined component is fit and therefore the presence of blending with unrelated absorption line features is easier to identify. Absorption from neutral carbon is detected (\textC i) but due to blending with \textC i⋆ and \textC i⋆⋆ lines neutral carbon is not considered in the analysis any further. Also, it is not possible to infer whether \textC ii⋆ is present due to blending with the \textC ii line which is highly saturated. Hence, we cannot determine the relative strengths of \textC ii⋆ and \textC ii and use them as diagnostics to infer the presence of local radiation fields (Wolfe et al., 2008). The errors given in Table 1 are the formal statistical errors from FITLYMAN. The systematic errors from, e.g., normalisation and not knowing the instrumental resolution precisely, are larger than this. An error of 0.05 dex would be a conservative estimate including all error sources.
The metallicity of the system is exceptionnally high. From \textZn ii, which is little depleted onto dust grains (Meyer & Roth, 1990), we infer a metallicity of . Note that the splitting between \textZn ii and \textMg i is 50 km s-1 implying that \textMg i cannot significantly contribute to the \textZn ii column density. Here, we adopt the solar photosphere abundances from Asplund et al. (2009). Given that we only fitted the main velocity component, the overall metallicity of the DLA must be solar or higher than solar in case of hidden saturation. We also note that the [Mn/Fe] ratio is larger than solar, which is only seen at or above solar metallicity (Ledoux et al., 2002). For elements which are sensitive to dust depletion (Meyer & Roth, 1990; Pettini et al., 1997; Ledoux et al., 2002, e.g.,), we find [Fe/H, [Ni/H, [Mn/H, and [Cr/H implying substantial dust depletion for these elements.
To compare the kinematics of the absorption-line profiles with that of other DLAs, we follow the procedure of Ledoux et al. (2006) and calculate the line-profile velocity width, , as , where and are the wavelengths corresponding to, respectively, the 5 and 95 percentiles of the apparent optical depth distribution, and is the first moment (the average) of this distribution (Ledoux et al., 2006, see fig. 1 of). We again choose the \textSi ii 1808 transition as it is a low-ionisation transition and the line is only mildly saturated. The apparent line optical depth and the derived velocity width are shown in Fig. 3. We infer a velocity width of 295 km s-1 in good agreement with the velocity-metallicity relation for DLAs (Ledoux et al., 2006).
3.2.2 Molecular absorption
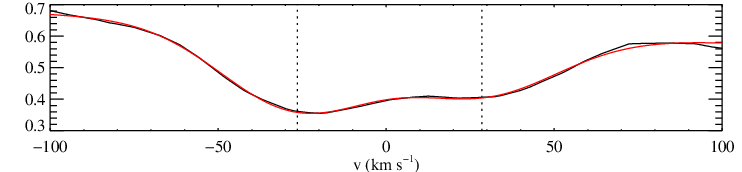
Absorption lines from the Lyman and Werner bands of molecular hydrogen (H2) are detected at in the X-shooter spectrum of Q 09181636 (see Fig. 4). The observed velocity extent of the H2 profile is wider than the instrumental resolution FWHM (48 km s-1 at 3800 Å) and much wider than the typical Doppler parameter of individual molecular lines as measured from high-resolution spectroscopy (Ledoux et al., 2003, usually km s-1;). This indicates that the actual H2 profile comprises several blended components. Two absorption peaks separated by about 55 km s-1 can be distinguished in the H2 profile, while they are not seen in the profile of metal lines that are fitted with a single component having km s-1. This means that the metals are somehow continuously spread over FWHM km s-1, while the H2 components are discrete and well-separated in velocity space. Indeed, this is a general behaviour as seen in other H2-bearing systems studied at high spectral resolution (Ledoux et al., 2002b, e.g.)
In order to estimate the H2 column density, we compared the data with synthetic profiles of H2 absorption consisting of two components separated by 55 km s-1 built with the same spectral resolution and binning. We varied the column density in rotational levels from to for each component until we got a synthetic spectrum consistent with the data. We repeated this exercise for a wide range of Doppler parameters ( to 20 km s-1) to get a realistic range on the total H2 column density: H2)=1.51016 – 1.11019 cm-2. This corresponds to an overall molecular fraction HH+H i–.
Details on the column densities in each rotational level and for the two components are given in Table 2. These measurements are only indicative and should be considered with caution because of the various uncertainties. Only high spectral resolution observations are suitable to properly resolve the H2 line profile in individual components, measure accurately the column densities, and study the physical conditions in the gas (Srianand et al., 2005; Noterdaeme et al., 2007, e.g.,). Nevertheless, the presence of H2 in this system is firmly established.

| Ion | Transition | [M/H] | ||
|---|---|---|---|---|
| lines used | (km s-1) | |||
| \textSi ii | 1808 | 16.010.01 | 0.460.05 | 52.10.5 |
| \textS ii | 1250,1253 | 15.820.01 | 0.260.05 | 52.10.5 |
| \textCr ii | 2056,2062,2066 | 13.720.01 | 0.880.05 | 52.10.5 |
| \textMn ii | 2576,2594 | 13.470.01 | 0.920.05 | 52.10.5 |
| \textFe ii | 1611,2249 | 15.430.01 | 1.030.05 | 52.10.5 |
| \textNi ii | 1709,1741,1751 | 14.400.01 | 0.780.05 | 52.10.5 |
| \textZn ii | 2026,2062 | 13.400.01 | 0.120.05 | 52.10.5 |

 |
 |
| Rot. level | (cm-2) | |
|---|---|---|
| component | =1 km s-1 | =20 km s-1 |
| 18.45 | 15.4 | |
| 18.2 | 15.1 | |
| 18.1 | 15.1 | |
| 18.75 | 15.85 | |
| 18.5 | 15.5 | |
| 18.4 | 15.6 | |
| 18.35 | 15.6 | |
| 18.2 | 15.3 | |
| 17.8 | 15.3 | |
| 17.7 | 15.0 | |
| 17.7 | 14.8 | |
| 16.4 | 14.6 | |
| Total | 19.05 | 16.15 |
4 Discussion and conclusions
4.1 Nature of the DLA galaxy counterpart
The DLA toward Q 09181636 is amongst the highest metallicity DLAs known to date (Kaplan et al., 2010, compared, e.g., to the sample of). The fact that we detect the galaxy counterpart of this DLA is consistent with our suggestion that high metallicity DLAs should have bright galaxy counterparts (Møller et al., 2004; Fynbo et al., 2008; Fynbo et al., 2010). Indeed, stellar mass, metallicity and star formation rate in galaxies are intimately related (Mannucci et al., 2010). Galaxy mass-metallicity relations have been found to exist up to at least (Tremonti et al., 2004; Savaglio et al., 2005; Erb et al., 2006; Kewley & Ellison, 2008; Maiolino et al., 2008; Lamareille et al., 2009, e.g.,). The mass-metallicity relations at high redshift are steeper and offset towards higher stellar masses for a given metallicity compared to the relation observed in the local Universe (Maiolino et al., 2008, see, e.g., fig. 8 in). Therefore, by selecting high-metallicity systems we should pick the most massive structures. In turn, because the star formation rate in galaxies is at any redshift correlated with total stellar mass (see fig. 1 in Dutton et al., 2010, and references therein), the most massive galaxies have expected star formation rates high enough (SFR M⊙ yr-1) to be detected with our observing method. It is encouraging that we have already found a second case after F10 in agreement with this reasoning.
The large impact parameter of 2.0 arcsec, corresponding to 16.0 kpc, is also consistent with the expectations from a simple model (Fynbo et al., 2008, see fig. 3 in). The detection of H2 absorption is consistent with the previously found trend that H2 is predominantly found in high-metallicity (Petitjean et al., 2006) and dusty (Ledoux et al., 2003; Noterdaeme et al., 2008) systems. Unlike the system studied in F10, Ly emission from the DLA galaxy toward Q 09181636 is strongly suppressed. A plausible reason for this is dust obscuration given the high metallicity and the evidence for dust in the galaxy along the line-of-sight to the background QSO (Charlot & Fall, 1991). Whereas we have no direct information on the amount of dust in the centre of the galaxy, presumably traced by the centroid of the line emission, it is likely to be higher than in the outer parts of the galaxy traced by the DLA.
4.2 Ly escape fraction
Whereas the limit we infer for the Ly luminosity is a similar to the mean Ly luminosity for DLA galaxies inferred by Rahmani et al. (2010) (Rauch & Haehnelt, 2010, see also) it is still very low compared to the strength of the [\textO iii] and [\textO ii] emission lines from the galaxy.
The escape fraction of Ly photons at high redshift is a highly coveted quantity as a plethora of interesting physical properties of galaxies can be revealed by studying this line. A number of authors have attempted to assess this matter, yielding quite different results; the standard procedure has been to compare the ratio of Ly-inferred SFRs to those of other proxies with what is expected theoretically assuming case-B recombination, e.g., Le Delliou et al. (2005, a universal 2% from comparing observational data with modelled galaxies); Le Delliou et al. (2006, a universal 2% from comparing observational data with modelled galaxies), Dayal et al. (2009, 30% from comparing simulated galaxies with observed luminosity functions), and Gawiser et al. (2006, 80% from comparing Ly α -inferred SFRs to spectral energy distribution (SED) modelling of observed Ly α emitters). Laursen et al. (2009b), using the Ly radiative transfer code MoCaLaTA (Laursen et al., 2009a), calculated the full radiative transfer equations in simulated galaxies, obtaining an anticorrelation between and galactic size, from order unity to order a few per cent.
Similarly, although Hayes et al. (2010) found that an average % adequate to explain their observations, their fig. 3 shows a trend of decreasing with . Comparing the inferred SFR from Oii with that of Ly, an upper limit of % is inferred for the galaxy counterpart of the DLA studied here. The extinction is found to be (see below), corresponding to a colour excess of . The extinction in the centre of the galaxy is likely to be higher. Furthermore, in calculating Hayes et al. (2010) assume a metallicity of 1/3 solar, whereas the present galactic system was shown to have at least solar metallicity, thus probably resulting in higher extinction. Another possible cause could be that SFRs inferred from Oii are after all associated with rather large uncertainties, as the mean Oii/H ratios vary substantially from galaxy to galaxy, up to an order of magnitude (Gallagher et al., 1989; Kennicutt, 1992).
4.3 Dust reddening
In Fig. 5, we show the X-shooter spectrum of Q 09181636. With a dashed line we show the composite QSO spectrum from Telfer et al. (2002) and it is evident that Q 09181636 is redder than the composite spectrum. The evidence for dust in the system comes from the observed strong depletion of refractory elements. In addition, the spectrum of Q 09181636 appears substantially redder than the spectra of typical QSOs around . Q 09181636 was selected as a candidate high- QSO based on its red colour. It falls outside the selection criteria for candidate QSOs in SDSS (Richards et al., 2003). In Fig. 6, we compare the colours of Q 09181636 with the colours of QSOs with redshift within from the SDSS DR7 QSO catalogue after removing BAL QSOs (Schneider et al., 2007). As seen, the distributions of QSO colours are relatively narrow. However, the distributions have small extensions towards redder colours and Q 09181636 is among the reddest 4%, 0.7% and 12% of QSOs at these redshifts for , and , respectively. With contours we show the colours of the stellar locus from stripe 82 in the same colours (Ivezić et al., 2007). Only in the colour has the reddening moved Q 09181636 further away from the stellar locus and in these bands the QSO is very faint. Hence, it is very difficult to select reddened QSOs at these redshifts using optical colours. In a future study, we will address how one can select even redder QSOs using photometry in the near-IR bands. The most likely cause of the red colour of Q 09181636 is dust in the DLA given its high metallicity and strong evidence for depletion of refractory elements on dust grains. Dust in the DLA could also contribute, but as mentioned in the introduction this DLA not as metal rich as the DLA. The presence of dust along the line-of-sight is supported by the fact that the SED of Q 09181636 can be well fitted with the composite QSO spectrum from Telfer et al. (2002) reddened by SMC/LMC-like extinction at with a total amount of extinction given by mag. Here, we have used the prescription given in Pei (1992) to model the extinction curve. The agreement with the observed spectrum is very good. It is not possible to get a good fit with the MW extinction curve.
The corresponding extinction-to-gas ratio, H i) mag cm2, is in between the ratios inferred from LMC and MW sightlines (Gordon et al., 2003, e.g.) and substantially higher than what is found on average for DLAs (Vladilo et al., 2008, H i) 2-4 mag cm2). The fact that reddening has moved Q 09181636 to the boundary of the colour space where QSOs are selected in SDSS is consistent with previous studies arguing that metal-rich DLAs most likely are systematically missing from current DLA samples from optical QSO surveys (e.g., Pei et al. 1999 and references therein; Noterdaeme et al. 2009a; Noterdaeme et al. 2010; Pontzen & Pettini 2009).
In conclusion, our results support the suggestion of F10 that high-metallicity DLAs are associated with bright galaxy counterparts. The DLA has a high metallicity (for its redshift) of close to solar despite probing a region about 16 kpc away from the central emitting region of the DLA galaxy counterpart. We establish the presence of H2 absorption, and also dust grains based on the depletion of refractory elements and from reddening of the background QSO.


Acknowledgments
The Dark Cosmology Centre is funded by the DNRF. We thank our anonymous referee for a fast and constructive report and K. Schmidt and C. Péroux for useful discussions. PN is supported by a CONICYT/CNRS fellowship. PL acknowledges funding from the Villum Foundation. JRM is a Sophie & Tycho Brahe fellow. ST is supported by the Lundbeck foundation.
References
- Asplund et al. (2009) Asplund, M., Grevesse, N., Sauval, A. J., & Scott, P., 2009, ARA&A, 47, 481
- Cassata et al. (2011) Cassata, P., Le Fèvre, O., Garilli, B., et al., 2011, A&A, 525, A143+
- Charlot & Fall (1991) Charlot, S. & Fall, S. M., 1991, ApJ, 378, 471
- Colbert & Malkan (2002) Colbert, J. W. & Malkan, M. A., 2002, ApJ, 566, 51
- Dayal et al. (2009) Dayal, P., Ferrara, A., Saro, A., Salvaterra, R., Borgani, S., & Tornatore, L., 2009, MNRAS, 400, 2000
- Dutton et al. (2010) Dutton, A. A., van den Bosch, F. C., & Dekel, A., 2010, MNRAS, 405, 1690
- Erb et al. (2006) Erb, D. K., Shapley, A. E., Pettini, M., Steidel, C. C., Reddy, N. A., & Adelberger, K. L., 2006, ApJ, 644, 813
- Fynbo et al. (2010) Fynbo, J. P. U., Laursen, P., Ledoux, C., et al., 2010, MNRAS, 408, 2128 (F10)
- Fynbo et al. (2003) Fynbo, J. P. U., Ledoux, C., Möller, P., Thomsen, B., & Burud, I., 2003, A&A, 407, 147
- Fynbo et al. (2008) Fynbo, J. P. U., Prochaska, J. X., Sommer-Larsen, J., Dessauges-Zavadsky, M., & Møller, P., 2008, ApJ, 683, 321
- Fynbo et al. (1999) Fynbo, J. U., Møller, P., & Warren, S. J., 1999, MNRAS, 305, 849
- Gallagher et al. (1989) Gallagher, J. S., Hunter, D. A., & Bushouse, H., 1989, AJ, 97, 700
- Gawiser et al. (2006) Gawiser, E., van Dokkum, P. G., Herrera, D., et al., 2006, ApJS, 162, 1
- Goldoni et al. (2006) Goldoni, P., Royer, F., François, P., Horrobin, M., Blanc, G., Vernet, J., Modigliani, A., & Larsen, J., 2006, in Presented at the Society of Photo-Optical Instrumentation Engineers (SPIE) Conference, Vol. 6269, Society of Photo-Optical Instrumentation Engineers (SPIE) Conference Series
- Gordon et al. (2003) Gordon, K. D., Clayton, G. C., Misselt, K. A., Landolt, A. U., & Wolff, M. J., 2003, ApJ, 594, 279
- Gronwall et al. (2007) Gronwall, C., Ciardullo, R., Hickey, T., et al., 2007, ApJ, 667, 79
- Grove et al. (2009) Grove, L. F., Fynbo, J. P. U., Ledoux, C., Limousin, M., Møller, P., Nilsson, K. K., & Thomsen, B., 2009, A&A, 497, 689
- Hayes et al. (2010) Hayes, M., Östlin, G., Schaerer, D., et al., 2010, Nature, 464, 562
- Ivezić et al. (2007) Ivezić, Ž., Smith, J. A., Miknaitis, G., et al., 2007, AJ, 134, 973
- Kaplan et al. (2010) Kaplan, K. F., Prochaska, J. X., Herbert-Fort, S., Ellison, S. L., & Dessauges-Zavadsky, M., 2010, PASP, 122, 619
- Kelson (2003) Kelson, D. D., 2003, PASP, 115, 688
- Kennicutt (1992) Kennicutt, Jr., R. C., 1992, ApJ, 388, 310
- Kennicutt (1998) —, 1998, ARA&A, 36, 189
- Kewley & Ellison (2008) Kewley, L. J. & Ellison, S. L., 2008, ApJ, 681, 1183
- Kulkarni et al. (2006) Kulkarni, V. P., Woodgate, B. E., York, D. G., Thatte, D. G., Meiring, J., Palunas, P., & Wassell, E., 2006, ApJ, 636, 30
- Lamareille et al. (2009) Lamareille, F., Brinchmann, J., Contini, T., et al., 2009, A&A, 495, 53
- Laursen et al. (2009a) Laursen, P., Razoumov, A. O., & Sommer-Larsen, J., 2009a, ApJ, 696, 853
- Laursen et al. (2009b) Laursen, P., Sommer-Larsen, J., & Andersen, A. C., 2009b, ApJ, 704, 1640
- Laursen et al. (2010) Laursen, P., Sommer-Larsen, J., & Razoumov, A. O., 2010, ArXiv e-prints
- Le Delliou et al. (2005) Le Delliou, M., Lacey, C., Baugh, C. M., Guiderdoni, B., Bacon, R., Courtois, H., Sousbie, T., & Morris, S. L., 2005, MNRAS, 357, L11
- Le Delliou et al. (2006) Le Delliou, M., Lacey, C. G., Baugh, C. M., & Morris, S. L., 2006, MNRAS, 365, 712
- Ledoux et al. (2002) Ledoux, C., Bergeron, J., & Petitjean, P., 2002, A&A, 385, 802
- Ledoux et al. (2006) Ledoux, C., Petitjean, P., Fynbo, J. P. U., Møller, P., & Srianand, R., 2006, A&A, 457, 71
- Ledoux et al. (2003) Ledoux, C., Petitjean, P., & Srianand, R., 2003, MNRAS, 346, 209
- Ledoux et al. (2002b) Ledoux, C., Srianand, R., & Petitjean, P., 2002b, A&A, 392, 781
- Maiolino et al. (2008) Maiolino, R., Nagao, T., Grazian, A., et al., 2008, A&A, 488, 463
- Mannucci et al. (2010) Mannucci, F., Cresci, G., Maiolino, R., Marconi, A., & Gnerucci, A., 2010, MNRAS, 408, 2115
- Meyer & Roth (1990) Meyer, D. M. & Roth, K. C., 1990, ApJ, 363, 57
- Møller & Warren (1998) Møller, P. & Warren, S. J., 1998, MNRAS, 299, 661
- Møller et al. (2004) Møller, P., Fynbo, J. P. U., & Fall, S. M., 2004, A&A, 422, L33
- Møller & Warren (1993) Møller, P. & Warren, S. J., 1993, A&A, 270, 43
- Møller et al. (2002) Møller, P., Warren, S. J., Fall, S. M., Fynbo, J. U., & Jakobsen, P., 2002, ApJ, 574, 51
- Noterdaeme et al. (2008) Noterdaeme, P., Ledoux, C., Petitjean, P., & Srianand, R., 2008, A&A, 481, 327
- Noterdaeme et al. (2009a) Noterdaeme, P., Ledoux, C., Srianand, R., Petitjean, P., & Lopez, S., 2009a, A&A, 503, 765
- Noterdaeme et al. (2010) Noterdaeme, P., Petitjean, P., Ledoux, C., López, S., Srianand, R., & Vergani, S. D., 2010, A&A, 523, A80+
- Noterdaeme et al. (2009b) Noterdaeme, P., Petitjean, P., Ledoux, C., & Srianand, R., 2009b, A&A, 505, 1087
- Noterdaeme et al. (2007) Noterdaeme, P., Petitjean, P., Srianand, R., Ledoux, C., & Le Petit, F., 2007, A&A, 469, 425
- Ouchi et al. (2008) Ouchi, M., Shimasaku, K., Akiyama, M., et al., 2008, ApJS, 176, 301
- Pei (1992) Pei, Y. C., 1992, ApJ, 395, 130
- Pei et al. (1999) Pei, Y. C., Fall, S. M., & Hauser, M. G., 1999, ApJ, 522, 604
- Petitjean et al. (2006) Petitjean, P., Ledoux, C., Noterdaeme, P., & Srianand, R., 2006, A&A, 456, L9
- Pettini et al. (1997) Pettini, M., King, D. L., Smith, L. J., & Hunstead, R. W., 1997, ApJ, 478, 536
- Pontzen & Pettini (2009) Pontzen, A. & Pettini, M., 2009, MNRAS, 393, 557
- Prochaska et al. (2005) Prochaska, J. X., Herbert-Fort, S., & Wolfe, A. M., 2005, ApJ, 635, 123
- Rahmani et al. (2010) Rahmani, H., Srianand, R., Noterdaeme, P., & Petitjean, P., 2010, MNRAS, 409, L59
- Rauch et al. (2008) Rauch, M., Haehnelt, M., Bunker, A., et al., 2008, ApJ, 681, 856
- Rauch & Haehnelt (2010) Rauch, M. & Haehnelt, M. G., 2010, ArXiv e-prints
- Reddy & Steidel (2009) Reddy, N. A. & Steidel, C. C., 2009, ApJ, 692, 778
- Richards et al. (2003) Richards, G. T., Hall, P. B., Vanden Berk, D. E., et al., 2003, AJ, 126, 1131
- Savaglio et al. (2005) Savaglio, S., Glazebrook, K., Le Borgne, D., et al., 2005, ApJ, 635, 260
- Sawicki & Thompson (2006) Sawicki, M. & Thompson, D., 2006, ApJ, 642, 653
- Schlegel et al. (1998) Schlegel, D. J., Finkbeiner, D. P., & Davis, M., 1998, ApJ, 500, 525
- Schneider et al. (2007) Schneider, D. P., Hall, P. B., Richards, G. T., et al., 2007, AJ, 134, 102
- Smith et al. (1989) Smith, H. E., Cohen, R. D., Burns, J. E., Moore, D. J., & Uchida, B. A., 1989, ApJ, 347, 87
- Srianand et al. (2005) Srianand, R., Petitjean, P., Ledoux, C., Ferland, G., & Shaw, G., 2005, MNRAS, 362, 549
- Telfer et al. (2002) Telfer, R. C., Zheng, W., Kriss, G. A., & Davidsen, A. F., 2002, ApJ, 565, 773
- Tremonti et al. (2004) Tremonti, C. A., Heckman, T. M., Kauffmann, G., et al., 2004, ApJ, 613, 898
- van Dokkum (2001) van Dokkum, P. G., 2001, PASP, 113, 1420
- Vladilo et al. (2008) Vladilo, G., Prochaska, J. X., & Wolfe, A. M., 2008, A&A, 478, 701
- Wolfe et al. (2005) Wolfe, A. M., Gawiser, E., & Prochaska, J. X., 2005, ARA&A, 43, 861
- Wolfe et al. (2008) Wolfe, A. M., Prochaska, J. X., Jorgenson, R. A., & Rafelski, M., 2008, ApJ, 681, 881