The First Ultra-Cool Brown Dwarf Discovered by the Wide-field Infrared Survey Explorer
Abstract
We report the discovery of the first new ultra-cool brown dwarf found with the Wide-field Infrared Survey Explorer (WISE). The object’s preliminary designation is WISEPC J045853.90643451.9. Follow-up spectroscopy with the LUCIFER instrument on the Large Binocular Telescope indicates that it is a very late-type T dwarf with a spectral type approximately equal to T9. Fits to an IRTF/SpeX 0.8-2.5 m spectrum to the model atmospheres of Marley and Saumon indicate an effective temperature of approximately 600 K as well as the presence of vertical mixing in its atmosphere. The new brown dwarf is easily detected by WISE, with a signal-to-noise ratio of 36 at 4.6 m. Current estimates place it at a distance of 6 to 10 pc. This object represents the first in what will likely be hundreds of nearby brown dwarfs found by WISE that will be suitable for follow up observations, including those with the James Webb Space Telescope. One of the two primary scientific goals of the WISE mission is to find the coolest, closest stars to our Sun; the discovery of this new brown dwarf proves that WISE is capable of fulfilling this objective.
Keywords:
(stars:) brown dwarfs; (Galaxy:) solar neighborhood; infrared: stars; stars: late-type; stars: low-massI Introduction
Brown dwarfs (BDs) are star-like objects with masses too low to sustain core fusion of hydrogen to helium. Although first predicted to exist in the early 1960’s [30, 23], BDs were not discovered in bulk until decades later by deep, large-area surveys such as the Two Micron All Sky Survey [51, 2MASS;], the Sloan Digital Sky Survey [59, SDSS;], and the DEep Near-Infrared Southern Sky Survey [18, DENIS;]. Strong methane absorption characterizes the coolest observed class of brown dwarfs, providing the hallmark of the “T” spectral type. To date, more than 200 T dwarfs have been discovered (DwarfArchives.org). T dwarfs have effective temperatures ranging from 1300 K down to 450 K [38, 8, 10, 16, 21, 56], and the coldest T dwarfs are characterized by deep absorption bands of CH4, H2O, H2 and NH3 appearing throughout the near- and mid-infrared portions of their spectrum [4, 25, 33]. No census of our solar neighborhood can be complete without discovering the lowest-temperature brown dwarfs, as it is anticipated that they exist in numbers rivaling those of normal stars [12, 37, 42, 47]. Additionally, the spatial density of ultra-cool and low mass BDs can be used as a sensitive probe of the lowest masses that can be produced via different star formation processes [2, 7].
One of the two primary science objectives for the Wide-field Infrared Survey Explorer (WISE) is to find these coldest brown dwarfs, which represent the final link between the lowest mass stars and the giant planets in our own solar system. WISE is a NASA Medium-class Explorer mission designed to survey the entire sky in four infrared wavelengths, 3.4, 4.6, 12 and 22 m [57, 36, 39]. WISE consists of a 40 cm telescope that images all four bands simultaneously every 11 seconds. It covers nearly every part of the sky a minimum of eight times, ensuring high source reliability, with more coverage at the ecliptic poles. Astrometric errors are less than 0.5 arcsec with respect to 2MASS [57]. The preliminary estimated SNR5 point source sensitivity on the ecliptic is 0.08, 0.1, 0.8 and 5 mJy in the four bands (assuming eight exposures per band; Wright et al. 2010). Sensitivity improves away from the ecliptic due to denser coverage and lower zodiacal background.
WISE’s two shortest wavelength bands, centered at 3.4 and 4.6 m ( and , respectively), were specifically designed to optimize sensitivity to the coolest types of brown dwarfs [29]. In particular, BDs cooler than 1500 K exhibit strong absorption due to the band of CH4 centered at 3.3 m, with the onset of methane absorption at this wavelength beginning at 1700 K [43]. The as-measured sensitivities of 0.08 and 0.1 mJy in and allow WISE to detect a 300 K BD out to a distance of 8 pc, according to models by Marley et al. [41] and Saumon & Marley [49].
II Observations of Known L and T Dwarfs with WISE
In order to facilitate the search for new BDs in the WISE dataset, we first examined the WISE fluxes and colors of known BDs. The and IRAC colors of a sample of L and T dwarfs are shown in Figure 1a along with their Spitzer/IRAC colors [44]. The WISE band spans the deep H2O and CH4 absorption features found in the coolest BDs, while the band is centered on the window near 5 m where much of the flux of these objects is emitted; it also includes the 4.6 m CO absorption feature and the 4.2 m CO2 feature [58]. While the and bands are superficially similar to the Spitzer/IRAC bands 1 and 2 [19, which were also designed to isolate cool BDs;], the WISE band is wider to improve discrimination between normal stars and ultra-cool BDs (Wright et al. in preparation). This results in a systematically larger color compared to [3.6][4.5]. Figures 1b and 1c show that and increase with spectral type, with showing the smoothest correlation between color and spectral type for BDs later than T5, in good agreement with Leggett et al. [31]; these indices are likely to be a valuable means of identifying new L and T dwarfs. Table 1 contains the WISE photometry of the small sample of L and T dwarfs shown in the figures, and Figure 2 shows a model of a cool BD along with the WISE and transmission curves.
III Search for New Brown Dwarfs with WISE
Several methods were employed for searching for new BD candidates in the WISE dataset. The WISE preliminary data processing pipeline produces calibrated frames for each of the individual exposures. These images have been dark-subtracted, flat-fielded, distortion corrected, have had artifacts flagged and sources extracted. Once the individual images are produced, they are coadded to produce a single frame for each inertial position.
Searches for new BD candidates were performed on both the single-frame and multi-frame coadded mosaic source lists. The coadd search provided the maximum depth and sensitivity since the coadded frames generally feature the combination of at least eight frames per position. The coadd search was performed by searching the source lists for objects with a , a signal-to-noise ratio (SNR) 10, although sources were not required to be detected in (limiting magnitudes are given to 2.5 ). Sources were required to have been observed a minimum of four times in order to ensure reliability. Sources affected by artifacts such as diffraction spikes and latent images were excluded, and the reduced chi-squared point spread function goodness-of-fit parameter was required to be consistent with a point source (w2rchi23, where the quantity w2rchi2 represents the goodness of fit of a point source model to the set of observed pixel values in band , whereby a value close to unity indicates consistency). No requirement on the signal-to-noise ratio was levied in order to increase sensitivity to the coolest BDs, which can fall below the sensitivity limits. Subsequent searches were performed with varied criteria, including requiring the SNR to be 5, and only sources with high reliability were accepted (as determined by comparing the number of detections to the number of coverages). Once sources meeting these criteria were extracted from the WISE data, they were compared with images from the Digitized Sky Survey (DSS), 2MASS, and SDSS. BD candidates were required to have blue and red optical fluxes from DSS and SDSS (where SDSS data were available) consistent with expectations for very late T dwarfs observed with WISE. Cold WISE BD candidates were required to be unseen in DSS or SDSS, or in some cases visible at the longest wavelengths only in these surveys.
A source, given the provisional designation WISEPC J045853.90643451.9 (hereafter WISEPC J045864), was located in the coadd source list that met all of the above criteria; Table 2 summarizes the astrometry, and Table 3 summarizes the WISE magnitudes and colors for the source. Although WISEPC J045864 is faintly visible in the 2MASS band original scans, slightly offset from the WISE-derived position, the source was not bright enough to have been included in either the 2MASS All-Sky Point Source Catalog or Reject Table. Aperture photometry of the -band flux using standard IDL astronomy library routines reveals it to be detected at 3 . Figure 3 shows the WISE, 2MASS and DSS finder images. At the position of the BD candidate, there are 13 separate images from WISE. The signal-to-noise ratios in the resulting coadded data in are 11.9 and 36.3 in . The source was not detected in due to contaminating cirrus, which can confound photometry at these wavelengths. The object is not detected in to a limiting magnitude of 9.3 (Vega system), or 1.70 mJy. The images of WISEPC J045864 were searched for widely separated companions, but none were found. No known nearby stars with common proper motion were found.
IV Follow-Up Observations of WISEPC J045864
IV.1 Fan Mountain - FanCam
photometry of WISEPC J045864 was obtained on 2010 March 17 (UT) with FanCam, a HAWAII-1 based infrared imager operating at the University of Virginia’s Fan Mountain 31” telescope [27]. The source position was dithered by approximately 10” between 30 s () or 60 s () exposures during total exposures of 40, 35, and 60 minutes at , and -band respectively. The FanCam field of view (FOV) is 8.7’ x 8.7’ (0.51”/pixel). The combined, dithered exposures covered 7’ x 7’, providing several 2MASS stars for photometric reference within the exposure area. A median “sky” frame was subtracted from each individual exposure prior to flat fielding with the median background level subsequently restored to the image.
aperture photometry was computed for WISEPC J045864 using an aperture with a radius of 3 pixels. The zero points for the -bands were computed using stars in the FOV with measured 2MASS magnitudes since the -band filters in FanCam are based on the 2MASS system. In order to derive the -band zero point, we first computed the -band magnitudes of stars in the FOV using their 2MASS and magnitudes and the transformation given by Hamuy et al. [22]. The final uncertainty in the magnitudes include the photon noise from the sky and source, the read noise, and the uncertainty in the zero point. The resulting magnitudes and uncertainties are given in Table 3.
IV.2 Large Binocular Telescope - LUCIFER
The LBT Near Infrared Spectroscopic Utility with Camera and Integral Field Unit for Extragalactic Research (LUCIFER) near-infrared camera/spectrograph [40], operating in long-slit grating spectroscopy mode, provided 1.5-2.3 m spectra of WISEPC J045864 at the Gregorian focus of the Large Binocular Telescope’s SX (“left”) 8.4-meter primary mirror on 2010 March 19 (UT). The 0.75” slit spanned 3.0 pixels and provided a spectral resolving power () ranging from 1300 at 1.6 m to 1700 at 2.2 m dispersing the light in a single order across the array. The orientation of the 200 lines/mm “H+K” grating centered 1.98 m on the array. Observations consisted of 300 second exposures with the source nodded between two slit positions separated by 20 arcseconds in declination following an ABBA position sequence. Three repetitions of this sequence provided for 60 minutes of on-source integration. A0 telluric standards were observed both before and after the observation.
The spectra were processed using a modified version of the Spextool data reduction package [14]. Each pair of exposures was subtracted and then flat fielded. The spectra were then extracted and wavelength calibrated using sky emission features. The raw spectrum of WISEPC J045864 was corrected for telluric absorption using the A0 V star HD 33541 and the technique described by Vacca et al. [55]. The spectrum was rebinned to have 1 pixel per resolution element resulting in a final signal-to-noise ratio of 20 and 10 in the and bands respectively.
IV.3 NASA Infrared Telescope Facility - SpeX
We obtained a 0.82.5 m spectrom of WISEPC J045864 on 2010 Sep 12 (UT) using SpeX [45] on the 3.0 m NASA Infrared Telescope Facility on Mauna Kea. We used the low-resolution prism mode with the 0”.5 wide slit which yielded an average resolving power of 150. A series of 120 sec exposures at two positions along the 15” slit were obtained to facilitate sky subtraction. Observations of the A0 star HD 14632 were obtained after the science exposures for telluric correction and flux calibration purposes as well as flat and arc lamp exposures.
The data were reduced using Spextool [14], the IDL-based data reduction package for SpeX. Given the faintness of WISEPC J045864, the images were first pair-subtracted and then averaged together robustly in order to facilitate extraction. The spectra were then optimally extracted [24, e.g.] and wavelength calibrated using argon lamp exposures. The raw spectrum was then corrected for telluric absorption and flux-calibrated using the observations of the A0 V star HD14632 and the technique described in [55]. The SNR of the final spectrum ranges from a maximum of 40 in the band to 5 in the band. The spectrum was absolutely flux calibrated as described in Rayner et al. [46, see Equation 1] using the FanCam - and -band magnitudes. The agreement between the LUCIFER and SpeX data is excellent (Figure 4).
V Analysis
V.1 Spectral Analysis
The LUCIFER and SpeX spectra are shown in Figure 5. The spectra exhibit the deep absorption features of CH4 and H2O indicative of a very late T dwarf. The spectrum of WISEPC J045864 can be compared to the NIR spectra of the very late T dwarfs 2MASS J041509 [6], ULAS J003402.77005206.7 [56, hereafter ULAS J003400;] , CFBDS J005910.90011401.3 [16, CFBDS J005900;], ULAS J133553.45113005.2 [10, ULAS J133511;], and ULAS J141623.94134836.3 [50, ULAS J141613;]. As shown in Figure 5, WISEPC J045864 appears to best match the spectrum of the T9 dwarfs, although formal assignment of a spectral type will have to wait for the identification of spectral standards for objects this late.
The atmospheric parameters of WISEPC J045864 were estimated by comparing the SpeX spectrum and the WISE photometry to the model spectra of Marley et al. [41] and Saumon & Marley [49]. We used a grid of 80 cloudless models with ranging from 500 to 1000 K in steps of 100 K, = 4.0, 4.5, 5.0, 5.5 [cm s-2], [M/H] = 0, 0.3, and = 0, cm2 s-1. is the eddy diffusion coefficient and ranges from 102 cm2 s-1 to 105 cm2 s-1 in planetary atmospheres [48, e.g.,]. 0 corresponds to an atmosphere without vertical mixing in the radiative zone where chemical equilibrium prevails. The models were first smoothed to the resolution of the spectra and interpolated onto the wavelength scale of the data. In order to include the WISE photometry in the comparison, we converted the observed W1 and W2 magnitudes to average fluxes using the following zero points on the Vega system: 306.681, 170.663, 29.0448 & 8.2839 Jy in bands through and using the relative spectral response curves from [57, 26].
We identified the best fitting model spectra in the grid using the goodness-of-fit statistic (=1; all data points receiving equal weight) described in Cushing et al. [15]. For each model , we compute the scale factor =, where and are the radius and distance of the dwarf respectively, that minimizes . The best-fitting model is identified as having the global minimum value. To access the uncertainty in the selection process, we run a Monte Carlo simulation using both the uncertainties in the individual spectral and photometric points and the overall absolute flux calibration of the SpeX spectrum [15, 3, see]. We report the quality of the fit between the data and model as , the fraction of Monte Carlo simulations in which model is identified as the best fitting model.
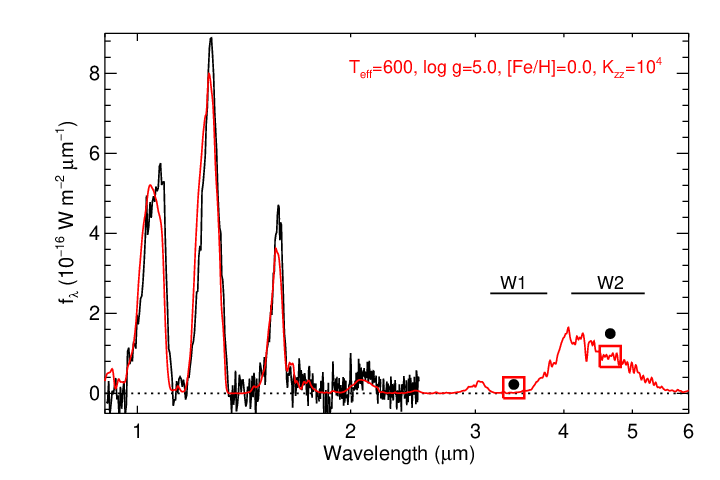
The best-fitting model has =600 K, =5.0, [Fe/H]=0, =104 cm2 s-1, and =0.66 while the second best-fitting model has =600 K, =5.5, [Fe/H]=0, =104 cm2 s-1, and =0.34. Given their values, these are the only two models in the grid that fit the data given the uncertainties. Figure 6 shows the SpeX spectrum and WISE photometry of WISEPC J045864 along with the best-fitting model. The spectrum is well-matched by the model, but the point is discrepant by over 10 . Although Figure 5 shows that WISEPC J045864 appears to show suppressed K band flux relative to other late T dwarfs, the interpretation of the feature is uncertain as the models for objects in this temperature regime are as yet not well-validated. Suppressed -band flux has previously been ascribed to low metallicity and/or high surface gravity [32, 54]; however, our model fits do not indicate unusual metallicity. The atmospheric parameters derived herein for WISEPC J045864 are consistent with those derived for other late-type T dwarfs [32, 11, e.g.,]. In particular there is evidence for the presence of vertical mixing in the atmosphere of WISEPC J045864 as =104 cm2 s-1. However the poor mismatch between the data and the model at 4.6 m, a spectral region particularly sensitive to vertical mixing [34, 20], makes drawing any conclusions difficult.
Following Bowler et al. [3], we can also estimate a spectrophometric distance to WISEPC J045864 using the scale factor . We first estimate the radius of WISEPC J045864 using the derived (, ) values and the evolutionary models of Saumon & Marley [49]. Using errors given by half the grid spacing of 50 K and 0.25 dex, we estimate a distance of 68 pc for WISEPC J045864.ú This distance is in rough agreement with the photometric distance of 9.01.9 pc, using the apparent magnitude of 17.470.05 and absolute magnitude MJ = 17.70.45. This was computed from a weighted average of MJ for the late T dwarfs Wolf 940B [11], ULAS003400 [52], and ULAS141623.94134836.3 [50], using the worst-case error.
V.2 Astrometry
The source is not present in either the 2MASS All-Sky Point Source Catalog or the Reject Catalog, but it is faintly visible in the 2MASS image as shown in 3. We performed a Gaussian fit to the source in the 2MASS image to measure its position. Astrometry at three epochs (2MASS, WISE, FanCam) is listed in Table 2. A linear least-squares fit to the measured positions, weighted by their astrometric errors, gives a motion of 0.19680.0291”/yr in right ascension and 0.15930.0291”/yr in declination over 11.2 years, or a total motion of 0.2560.032”/yr.
VI Discussion
One of the key questions in brown dwarf science is whether or not the spectral sequence ends with the T dwarfs, or whether another spectral type (with a proposed designation of Y; Kirkpatrick et al. [28]) is justified. Currently, only about two dozen objects with spectral types later than T7 are known, and four objects are known to have type T9 or later: ULAS J003400 [56], CFBDS J005900 [16], ULAS J133511 [10], and UGPS J072205 [38]. New spectral indices for typing these late-type T dwarfs have been developed as the CH4 absorption band depths may not continue to increase in the NIR with temperatures lower than those of T8/T9 dwarfs [12]. We compute the H2O, CH, , H2O, CH and CH indices given by Burgasser et al. [8], Burningham et al. [10] and Warren et al. [56] for WISEPC J045864 (see Table 3). However, as noted in Burningham et al. [10], these indices must viewed with caution for extremely late T dwarfs; the values we compute for WISEPC J045864 tell us only that it is later than T7/T8. Given the paucity of very late T dwarfs, assignment of a definitive spectral type will await the identification and definition of spectral standards. As this remarkably cool object was found easily in some of the first WISE data, WISE is likely to find many more similar objects, as well as cooler ones, inevitably producing abundant candidates for the elusive Y class brown dwarfs. Scaling from the Spitzer sample of 4.5 m selected ultra-cool BD candidates [17], we expect to find hundreds of new ultra-cool brown dwarfs with WISE. We compute that for most likely initial mass functions, WISE has a better than 50% chance of detecting a cool BD which may actually be closer to our Sun than Proxima Centauri [57].
VII Conclusions
We report the discovery of the first ultra-cool brown dwarf with WISE, an object which is consistent with an extremely late T dwarf. The object is easily detected by WISE, with signal-to-noise ratio of 40 at 4.6 m. Further, WISEPC J045864 lies in projection only 13 degrees off the Galactic midplane. WISE can pick out ultra-cool brown dwarfs like this one easily even in regions that are traditionally confused, as the number of sources per square at 4.6 m is significantly lower than in optical and near-IR wavelengths. The WISE survey offers an all-sky survey with extremely uniform and stable instrumental characteristics and survey cadence. By surveying the entire sky, including the galactic plane, WISE can provide an accurate census of cold BDs in the solar neighborhood, which is necessary for determining the initial mass function at low masses. WISEPC J045864, along with UGPS J072205 and the few other brown dwarfs like it, represents the first in what is anticipated to be a significant population of objects revealed by the WISE survey. We expect that brown dwarfs discovered by WISE will at last close the remaining gap in temperature between the coolest objects currently known (500 K) and potentially those of the giant planets in our own solar system [57].
VIII Acknowledgments
References
- [1] Artigau, E., Doyon, R., Lafreniere, D., Nadeau, D., Robert, J., Albert, L., 2006, ApJ, 651, L57
- [2] Bate, M. R., 2009, MNRAS, 392, 590
- [3] Bowler, B. P.; Liu, M. C.; & Cushing, 2009, ApJ, 706, 1114
- [4] Borysow, Jorgensen & Zheng, 1997, A&A, 324, 185
- [5] Burgasser, A., Kirkpatrick, J., Cutri, R., McCallon, H., Kopan, G., Gizis, J., Liebert, J., Reid, I., Brown, M., Monet, D., Dahn, C., Beichman, C., Skrutskie, M., 2000, ApJ, 531, L57
- [6] Burgasser, A.; Kirkpatrick, J.; Brown, M.; Reid, I.; Burrows, A.; Liebert, J.; Matthews, K.; Gizis, J.; Dahn, C.; Monet, D.; Cutri, R.; Skrutskie, M., 2002, ApJ, 564, 421
- [7] Burgasser, A., 2004, ApJS, 155, 191
- [8] Burgasser, A. J., Burrows, A., & Kirkpatrick, J. D. 2006, ApJ, 639, 1095
- [9] Burgasser, A., Looper, D., Rayner, J., 2010, AJ, 139, 2448
- [10] Burningham, B., et al., 2008, MNRAS, 391, 320
- [11] Burningham, B., et al. 2009, MNRAS, 395, 1237
- [12] Burningham, B., et al., 2010, astro-ph/1004.1912v2
- [13] Cruz, K., Reid, I., Liebert, J., Kirkpatrick, J. D., Lowrance, P., 2003 AJ, 126, 2421
- [14] Cushing, M. C., Vacca, W. D., & Rayner, J. T. 2004, PASP, 116, 362
- [15] Cushing, M. C., et al. 2008, ApJ, 678, 1372
- [16] Delorme, P., et al. 2008, A&A, 482, 961
- [17] Eisenhardt, P., Griffith, R.; Stern, D.; Wright, E.; Ashby, M.; Brodwin, M.; Brown, M.; Bussmann, R.; Dey, A.; Ghez, A.; Glikman, E.; Gonzalez, A.; Kirkpatrick, J.; Konopacky, Q.; Mainzer, A.; Vollbach, D.; Wright, S., 2010, AJ, 139, 2455
- [18] Epchteim, N.; de Batz, B.; Capoani, L.; Chevallier, L.; Copet, E.; Fouqu, P.; Lacombe, P.; Le Bertre, T.; Pau, S.; Rouan, D.; Ruphy, S.; Simon, G.; Tiphne, D.; Burton, W. B.; Bertin, E.; Deul, E.; Habing, H.; Borsenberger, J.; Dennefeld, M.; Guglielmo, F.; Loup, C.; Mamon, G.; Ng, Y.; Omont, A.; Provost, L.; Renault, J.-C.; Tanguy, F.; Kimeswenger, S.; Kienel, C.; Garzon, F.; Persi, P.; Ferrari-Toniolo, M.; Robin, A.; Paturel, G.; Vauglin, I.; Forveille, T.; Delfosse, X.; Hron, J.; Schultheis, M.; Appenzeller, I.; Wagner, S.; Balazs, L.; Holl, A.; Lpine, J.; Boscolo, P.; Picazzio, E.; Duc, P.-A.; Mennessier, M.-O. 1997, The Messenger, 87, 27
- [19] Fazio, G., et al., 1998, SPIE, 3354, 1024
- [20] Geballe, T., et al. 2009, MNRAS, 395, 1237B
- [21] Golimowski, D., Leggett, S., Marley, M., Fan, X., Geballe, T., et al., 2004, AJ, 127, 3516
- [22] Hamuy, M., Folatelli, G., Morrell, N. I., Phillips, M. M., Suntzeff, N. B., Persson, S. E., Roth, M., Gonzalez, S., Krzeminski, W., Contreras, C., Freedman, W. L., Murphy, D. C., Madore, B. F., Wyatt, P., Maza, J., Filippenko, A. V., Li, W., Pinto, P. A., 2006, PASP, 118, 839
- [23] Hayashi, & Nakano, 1963, Progress of Theoretical Physics, 30, 460
- [24] Horne, K. 1986, PASP, 98, 609
- [25] Irwin et al., 1999, J. Quant. Spectr. Radiat. Transf., 62, 193
- [26] Jarrett, T., et al., 2010, in preparation
- [27] Kanneganti, S., Park, Chan, Skrutskie, M. F., Wilson, J. C., Nelson, M. J., Smith, A. W., Lam, C. R.,2009, PASP, 121, 882, pp.885
- [28] Kirkpatrick, J. D., et al., 1999
- [29] Kirkpatrick, J. D., 2010 in preparation
- [30] Kumar, 1963, ApJ, 137, 1121
- [31] Leggett, S. K., Saumon, D., Burningham, B., Cushing, M., Marley, M., Pinfield, D., 2010, astroph 1007.1252
- [32] Leggett, S. K., et al. 2009, ApJ, 695, 1517
- [33] Leggett, S. K., Marley, M. S., Freedman, R., Saumon, D., Liu, M. C., Geballe, T. R., Golimowski, D. A., & Stephens, D. C. 2007, ApJ, 667, 537
- [34] Leggett, S. K., et al. 2007, ApJ, 655, 1079L
- [35] Leggett, S. K., et al. 2000, ApJ, 536, 35
- [36] Liu, F.; Cutri, R.; Greanias, G.; Duval, V.; Eisenhardt, P.; Elwell, J.; Heinrichsen, I.; Howard, J.; Irace, W.; Mainzer, A.; Razzaghi, A.; Royer, D.; Wright, E. L., 2008, SPIE, 7017, 16
- [37] Lodieu, N.; Hambly, N. C.; Jameson, R. F.; Hodgkin, S. T.; Carraro, G.; Kendall, T. R., 2007, MNRAS, 374, 372
- [38] Lucas, P. W.; Tinney, C. G.; Burningham, B.; Leggett, S. K.; Pinfield, David J.; Smart, Richard; Jones, Hugh R. A.; Marocco, Federico; Barber, Robert J.; Yurchenko, Sergei N.; Tennyson, Jonathan; Ishii, M.; Tamura, Motohide; Day-Jones, Avril C.; Adamson, Andrew, 2010, MNRAS, 408, L56
- [39] Mainzer, A.; Eisenhardt, P.; Wright, E. L.; Liu, F.; Irace, W.; Heinrichsen, I.; Cutri, R.; Duval, V. 2005, SPIE, 5899, 262
- [40] Mandel, H., Seifert, W., Hofmann, R., Jtte, M., Lenzen, R., Ageorges, N., Bomans, D., Buschkamp, P., Dettmar, R., Feiz, C., Gemperlein, H., Germeroth, A., Geuer, L., Heidt, J., Knierim, V., Laun, W., Lehmitz, M., Mall, U., Mller, P., Naranjo, V., Polsterer, K., Quirrenbach, A., Schffner, L., Schwind, F., Weiser, P., Weisz, H., 2008, SPIE, 7014, 124
- [41] Marley, M. S., Seager, S., Saumon, D., Lodders, K., Ackerman, A. S., Freedman, R. S., & Fan, X. 2002, ApJ, 568, 335
- [42] Moraux, E.; Bouvier, J.; Stauffer, J. R.; Cuillandre, J.-C., 2003, A&A, 400, 891
- [43] Noll, K., Geballe, T., Leggett, S., Marley, M., 2000, ApJ, 541, L75
- [44] Patten, B. M., et al. 2006, ApJ, 651, 502
- [45] Rayner, J., Toomey, D., Onaka, P., Denault, A., Stahlberger, W., Vacca, W., Cushing, M., Wang, S. 2003, PASP, 115, 362
- [46] Rayner, J., et al. 2009, ApJS, 185, 289
- [47] Reid, I. Neill; Kirkpatrick, J. Davy; Liebert, J.; Burrows, A.; Gizis, J. E.; Burgasser, A.; Dahn, C. C.; Monet, D.; Cutri, R.; Beichman, C. A.; Skrutskie, M., 1999, ApJ, 521, 613
- [48] Saumon, D.; Marley, M. S.; Cushing, M. C.; Leggett, S. K.; Roellig, T. L.; Lodders, K.; Freedman, R. S., 2006, ApJ, 647, 552
- [49] Saumon, D., & Marley, M. S. 2008, ApJ, 689, 1327
- [50] Scholz, R. D., 2010, A&A, 510, L8
- [51] Skrutskie, M. F., et al. 2006, AJ, 131, 1163
- [52] Smart, R. L., et al., 2010, A&A, 511, A30
- [53] Strauss, M., Fan, X., Gunn, J., Leggett, S., Geballe, T., Pier, J., Lupton, R., Knapp, G., Annis, J., Brinkmann, J., Crocker, J., Csabai, I., Fukugita, M., Golimowski, D., Harris, F., Hennessey, G., Hindsley, R., Ivezic, Z., Kent, S., Lamb, D., Munn, G., Newberg, H., Rechenmacher, R., Schneider, D., Smith, J., Stoughton, C., Tucker, D., Waddell, P., York, D., 1999, ApJ, 522, L61
- [54] Stephens, D. C., et al. 2009, ApJ, 702, 154
- [55] Vacca, W. D., Cushing, M. C., & Rayner, J. T. 2003, PASP, 115, 389
- [56] Warren, S. J., et al. 2007, MNRAS, 381, 1400
- [57] Wright, E. L., et al. 2010 AJ, 140, no. 6
- [58] Yamamura, I., Takashi, T., Tanabe, T. 2010, ApJ, 722, 682
- [59] York, D., et al. 2000, AJ, 120, 1579
| Object | Spectral Type | Error | Error | |||
|---|---|---|---|---|---|---|
| 2MASS J045100933402150aaCruz et al. [13] | L0.5 | 11.933 | 0.016 | 11.690 | 0.015 | 0.243 |
| 2MASS J083542560819237aaCruz et al. [13] | L5 | 10.403 | 0.025 | 10.04 | 0.020 | 0.363 |
| 2MASS J163229111904407bbKirkpatrick et al. [28] | L8 | 13.151 | 0.029 | 12.637 | 0.024 | 0.514 |
| SDSSp J083717.22000018.3ccLeggett et al. [35] | T0T1 | 15.512 | 0.056 | 14.697 | 0.079 | 0.815 |
| IPMS J013656.57093347.3ddArtigau et al. [1] | T2.5 | 11.922 | 0.026 | 10.943 | 0.024 | 0.979 |
| 2MASSI J1546291332511eeBurgasser et al. [6] | T5.5 | 15.044 | 0.072 | 13.447 | 0.037 | 1.597 |
| SDSSp J162414.37002915.6ffStrauss et al. [53] | T6 | 15.2 | 0.053 | 13.146 | 0.030 | 2.054 |
| Gliese 570DggBurgasser et al. [5] | T7 | 15.029 | 0.119 | 12.151 | 0.045 | 2.878 |
| 2MASSI J0415195093506eeBurgasser et al. [6] | T8 | 15.207 | 0.051 | 12.28 | 0.022 | 2.927 |
| UGPS J072227.51054031.2hhLucas et al. [38] | T9+ | 15.168 | 0.047 | 12.197 | 0.027 | 2.971 |
| RA (J2000, ∘) | Dec (J2000, ∘) | Ra err () | Dec err () | MJD | Reference |
|---|---|---|---|---|---|
| 74.7245712 | 64.5810776 | 0Ó.1696 | 0Ó.1703 | 55262.18273aaThis is the average of the date of the earliest frame (MJD= 55261.554191) and that of the latest frame (MJD=55262.811271) contributing to the coadded image. | WISE Pass 1 Database |
| 74.723142 | 64.580773 | 0Ó.3 | 0Ó.3 | 51179.32788 | 2MASS Images |
| 74.724583 | 64.581224 | 0Ó.2 | 0Ó.2 | 55272.03133 | FanCam images |
| Parameter Name | Value (mag) |
|---|---|
| (2MASS) | 16.80.3 |
| (2MASS) | (undetected) |
| (2MASS) | (undetected) |
| (FanCam) | 18.340.07 |
| (FanCam) | 17.470.07 |
| (FanCam) | 17.410.11 |
| 16.4010.100 | |
| 13.0200.031 | |
| (undetected - cirrus) | |
| ( 9.322 - undetected; lower limit) | |
| 0.870.10 | |
| 0.060.13 | |
| 4.390.11 | |
| 3.3810.105 | |
| Proper motion (arcsec/yr) | 0.2560.032 |
| Position angle | 517 degrees east of north |
| H2O | 0.03 |
| CH | 0.32 |
| 0.46 | |
| H2O | 0.10 |
| CH | 0.09 |
| CH | 0.19 |