Measurements on the 3He+ system at ANKEThanks: Presented at the International Symposium on Mesic Nuclei, Cracow, Poland, 2010
Abstract
The differential and total cross sections for the reaction have been measured in a high precision high statistics COSY–ANKE experiment near threshold using a continuous beam energy ramp up to an excess energy of 11.3 MeV with essentially 100% acceptance. The kinematics allowed the mean value of to be determined to about 9 keV. Evidence is found for the effects of higher partial waves for MeV. The very rapid rise of the total cross section to its maximum value within MeV of threshold implies a very large He scattering length and hence the presence of a quasi–bound state extremely close to threshold. In addition, differential and total cross sections have been measured at excess energies of 19.5, 39.4, and 59.4 MeV over the full angular range. While at 19.5 MeV the results can be described in terms of - and -wave production, by 59.4 MeV higher partial waves are required. Including the 19.5 MeV point together with the near-threshold data in a global - and -wave fit gives a poorer overall description of the data though the position of the pole in the He scattering amplitude, corresponding to the quasi-bound or virtual state, is hardly changed.
14.40.Aq, 21.85.+d, 25.45.-z
1 Introduction
The concept of –mesic nuclei was introduced by Liu and Haider [1]. Since the –meson has isospin–zero, the attraction noted for the –nucleon system should add coherently when the meson is introduced into a nuclear environment. On the basis of the rather small –nucleon scattering length assumed, they estimated that the lightest nucleus on which the might bind would be 12C. Experimental searches for the signals of such effects have generally proved negative, as for example in the 16OO∗ reaction [2]. The larger subsequently advocated [3] means that the should bind tightly with such heavy nuclei, generating large and overlapping widths, and thus be hard to detect [4]. On the other hand, it also leads to the possibility of binding even in light systems, such as He.
Therefore, very precise data on the reaction near threshold have been taken at the COSY accelerator of the Forschungszentrum Jülich [5, 6, 7]. The obtained results confirm the energy dependence of the total cross section found in earlier experiments [8, 9], but with much finer steps in energy over an extended range. The measurements at the lowest excess energies (the centre–of–mass kinetic energy in the He system) are of especial interest since they allow to gain detailed information about the final state interaction of the meson-nucleus system.
2 Experiment
The experiment was performed with a hydrogen cluster–jet target [10] using the ANKE spectrometer [11] placed at an internal station of the COoler SYnchrotron COSY–Jülich. In case of the measurements very close to threshold the deuteron beam energy was ramped slowly and linearly in time, from an excess energy of MeV to MeV. In addition, for measurements at higher excess energies (Q = 19.5, 39.4 and 59.4 MeV) three fixed values of the beam momentum were requested.
The 3He produced were detected in the ANKE forward detection system, which consists of two multi-wire proportional chambers, one drift chamber and three layers of scintillation hodoscopes. The geometrical acceptance for the 3He of interest was %, so that systematic uncertainties from acceptance corrections are negligible. The tracks of charged particles could be traced back through the precisely known magnetic field to the known interaction point, leading to a momentum reconstruction for registered particles. The luminosity required to determine cross sections was found by simultaneously measuring elastic scattering, with the scattered deuterons being registered in the forward detector and the proton reconstructed from the missing mass.
The 3He were selected by the method, with the meson being subsequently identified through a peak in the missing–mass distribution [12]. In order to determine the differential cross section for each excess energy, the whole range of the c.m. production angles was divided into individual angular bins and a missing-mass distribution constructed for each of them. The method to subtract the background below the peak of the meson is described in detail in [5] and [7].
2.1 Results
The total cross sections obtained at 195 bins in excess energy are displayed in Fig. 1. The minimal relative systematic errors resulting from the measurement of the excitation function in a single experiment form a robust data set for any phenomenological analysis. Our data are broadly compatible with those of SPESII [9] and any global difference is within our overall normalization uncertainty. However, in contrast to our data presented in Fig. 1b, the SPESII results do not define firmly the energy dependence in the near–threshold region. The total cross section reaches its maximum value within 0.5 MeV of threshold and hardly decreases after that. This behavior is in complete contrast to phase–space expectations and indicates a very strong final state interaction [13].
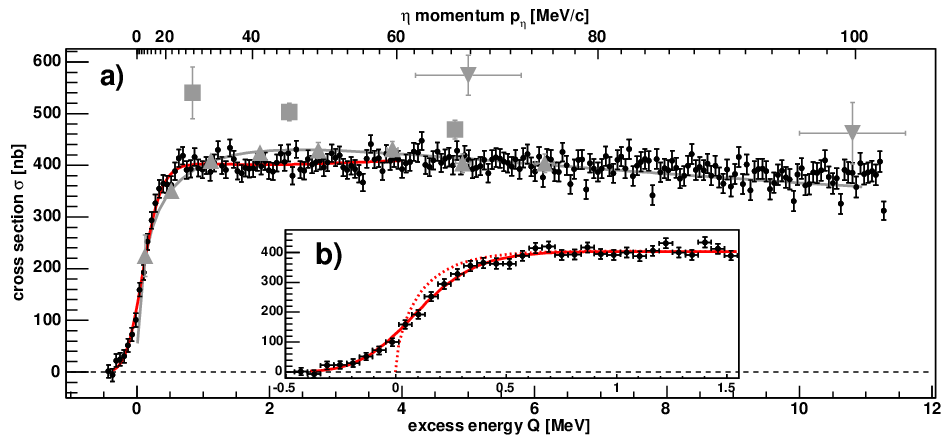
Figure 2 shows the angular distributions obtained at the three highest energies. Also presented are the points measured in a missing-mass experiment by a CELSIUS collaboration in the vicinity of MeV and 40 MeV, as well as those at 80 MeV [15]. These are generally in agreement with the present results, though our data have smaller statistical error bars and cover the complete range. There is no sign of a forward dip at 19.5 MeV and that any at 39.4 MeV is much weaker than the one found at CELSIUS. However, although the statistics were poorer and the number of points fewer, the CELSIUS group also measured events where the meson was detected through its two photon decay in coincidence with the 3He. These data also seemed to show less of a forward dip at both 20 and 40 MeV [15]. Figure 2 also shows polynomial fits to our points.

With the very precise ANKE data the excitation function near threshold is now given by Figure 3.

In order to prove that a nearby pole in the complex plane is responsible for the unusual energy dependence of the cross section, it is necessary to show that the pole induces a change in the phase as well as in the magnitude of the –wave amplitude. Since the cross section is proportional to the absolute square of the amplitude, much phase information is thereby lost. However, as will be shown the interference between the – and –waves, as seen in the newly published angular distributions [5, 6], leads to the required confirmation.
The differential cross sections close to threshold were found to be linear in , where is the c.m. angle between the initial proton and final . Throughout the range of the new COSY measurements, MeV [5, 6], there is no sign of the term that is needed for the description of the angular distributions at higher energies [15]. The angular dependence may therefore be summarised in terms of an asymmetry parameter , defined as
| (1) |
The variation of the ANKE measurements of with the momentum is shown in Fig. 4.

On kinematic grounds, the angular dependence near threshold might be expected to develop like , where and are the c.m. momenta of the incident proton and final –meson, respectively. However, one striking feature of Fig. 4 is that, although rises sharply with , it only does so from about 40 MeV/c instead of from the origin, as one might expect on the basis of the above kinematic argument. At low values of the error bars are necessarily large and might even to go negative in this region. This feature is not inconsistent with the results of other measurements [6, 9] that have different systematic uncertainties and so it is possibly a genuine effect. Part of this non–linear behaviour arises from the steep decrease in the magnitude of the –wave amplitude with momentum. However, the size of the effect observed can only arise through the rapid variation of the phase of this amplitude, of the type generated by a nearby pole in the complex plane.
There are two independent –wave amplitudes ( and ) [17] and five –wave though, to discuss the data phenomenologically, we retain only the two ( and ) that give a pure dependence in the cross section. The production operator
| (2) |
has to be sandwiched between 3He and proton spinors. Here is the polarisation vector of the deuteron. The corresponding unpolarised differential cross section depends upon the spin-averaged value of
| (3) |
Using the amplitudes of Eq. (2) this yields
| (4) |
which has the desired linear dependence on , with an asymmetry parameter
| (5) |
The strong He final–state interaction that gives rise to the quasi–bound pole should affect the two –wave amplitudes and in a similar way and some evidence for this is to be found from the deuteron tensor analysing power , which is small and seems to change little, if at all, from near threshold to their measurement limit 16.6 MeV above threshold [8]. As a consequence, throughout our range of interest and it is plausible to represent the data using a spin–average amplitude. However, further experiments to measure both the deuteron tensor analysing powers and spin–correlations will be undertaken at COSY–ANKE [18, 19].
In the original fit to the whole of the ANKE total cross section data [5] shown in Fig. 1, any influence of –waves was neglected and the data represented by
| (6) |
with
| (7) |
The first error bar is statistical and the second, where given, systematic. The error on is dominated by the 15% luminosity uncertainty [5]. Note that only the first pole (at ) is of physical significance and for this unitarity requires that . The signs of the imaginary parts of the pole positions are not defined by the data. As will be seen later, the position of the first pole remains stable when fitting simultaneously the angular dependence and the total cross section. In contrast, the second pole is introduced to parametrise the residual energy dependence, which can arise from the reaction mechanism as well as from a final–state interaction.
Equation (6) shows an –wave amplitude whose phase and magnitude vary quickly with , but we expect that, apart from the momentum factor, the –wave amplitudes should be fairly constant. In the absence of detailed analysing power information, we take and to be a complex constant. With these assumptions the total cross section and asymmetry parameter become [13]:
| (8) |
If the phase variation of the –wave amplitude is neglected, by replacing by , the best fit to the asymmetry parameter considering data up to Q = 11 MeV does display a little curvature due to the falling of with . Nevertheless, it fails badly to reproduce shape of the low–momentum data.
On the other hand, when the phase variation of given by Eq. (6) is retained, the much better description of the data given by the dashed line in Fig. 4 is achieved, with no degradation in the description of the total cross section presented in Fig. 1. Furthermore, the difference in the behaviour of in the low and not–so–low momentum regions can now be easily understood. The parameters of the fit are
| (9) |
An inclusion of the 19.5 MeV point leads to the solid line of Fig. 4 and Fig. 3, which gives a much poorer overall description of the near-threshold data though the position of the pole in the He scattering amplitude, corresponding to the quasi-bound or virtual state, is hardly changed.
Since the overall phase is unmeasurable, it is permissable to take the of Eq. (6) to be real. Furthermore, because of the interference between the – and –waves, the relative phases of , , and do now influence the observables, though the differential cross section remains unchanged if the signs of all the imaginary parts are reversed. Compared to the original solution, where the effects of the –waves were neglected [5], the position of the nearby pole is little changed. This is hardly surprising because this parameter is mainly fixed by the data from a region which is dominated by the –waves. Less expected is the very modest change in the position of , which could have been affected more by the introduction of . As a consequence, the He scattering length is also changed only marginally to fm, where the two signs of again reflect the possibility of either a quasi–bound or a virtual state. These results nicely explain the strong decrease of the scattering amplitude squared extracted from the data obtained at ANKE as function of the c.m. momentum (Fig. 5).
The ANKE data indicate that the –wave amplitude for undergoes a very rapid change of phase in the near–threshold region of the type expected from the presence of a quasi–bound or virtual He state.

References
- [1] Q. Haider and L.C. Liu, Phys. Rev. C 34 (1986) 1845.
- [2] R.E. Chrien et al., Phys. Rev. Lett. 60 (1988) 2595.
- [3] M. Batinić et al., Phys. Rev. C 51 (1995) 2310 [arXiv:nucl-th/9501011], idem arXiv:nucl-th/9703023.
- [4] See, for example: C. Garcia-Recio, J. Nieves, T. Inoue, and E. Oset, Phys. Lett. B 550 (2002) 47 [arXiv:nucl-th/0206024]; M. Post, S. Leupold, and U. Mosel, Nucl. Phys. A 741 (2004) 81 [arXiv:nucl-th/0309085].
- [5] T. Mersmann et al., Phys. Rev. Lett. 98 (2007) 242301.
- [6] J. Smyrski et al., Acta Physica Slovaca 56, 213 (2006).
- [7] T. Rausmann et al., Phys. Rev. C 80 (2009) 017001.
- [8] J. Berger et al., Phys. Rev. Lett. 61 (1988) 919.
- [9] B. Mayer et al., Phys. Rev. C 53 (1996) 2068.
- [10] A. Khoukaz et al., Eur. Phys. J. D 5 (1999) 275.
- [11] S. Barsov et al., Nucl. Instr. Meth. A 462 (2001) 364.
- [12] A. Wrońska et al., Eur. Phys. J. A 26 (2005) 421.
- [13] C. Wilkin et al., Phys. Lett. B 654 (2007) 92.
- [14] H.-H. Adam et al., Phys. Rev. C 75, 014004 (2007).
- [15] R. Bilger et al., Phys. Rev. C 65 (2002) 044608.
- [16] M. Betigeri et al., Phys. Lett. B 472 (2000) 267.
- [17] J.-F. Germond and C. Wilkin, J. Phys. G 14 (1988) 181.
- [18]
T. Rausmann & A. Khoukaz, COSY proposal #157
(2006);
www.fz-juelich.de/ikp/anke/en/proposals.shtml. - [19] A. Kacharava, F. Rathmann, and C. Wilkin (ANKE Collaboration), COSY proposal #152, nucl-ex/0511028.