A Bayesian analysis of the 27 highest energy cosmic rays detected by the Pierre Auger Observatory
Abstract
It is possible that ultra-high energy cosmic rays (UHECRs) are generated by active galactic nuclei (AGNs), but there is currently no conclusive evidence for this hypothesis. Several reports of correlations between the arrival directions of UHECRs and the positions of nearby AGNs have been made, the strongest detection coming from a sample of 27 UHECRs detected by the Pierre Auger Observatory (PAO). However, the PAO results were based on a statistical methodology that not only ignored some relevant information (most obviously the UHECR arrival energies but also some of the information in the arrival directions) but also involved some problematic fine-tuning of the correlation parameters. Here we present a fully Bayesian analysis of the PAO data (collected before 2007 September), which makes use of more of the available information, and find that a fraction of the UHECRs originate from known AGNs in the Veron-Cetty & Veron (VCV) catalogue. The hypothesis that all the UHECRs come from VCV AGNs is ruled out, although there remains a small possibility that the PAO-AGN correlation is coincidental ( is 200 times as probable as ).
Keywords:
cosmic rays – methods: statistics – galaxies: active – surveys1 Introduction
Cosmic rays (CRs) are highly accelerated protons and nuclei that reach Earth with arrival energies in the wide range (see, e.g. Stoker 2009). However the origin of ultra-high energy cosmic rays (UHECRs) with , in particular, remains uncertain. The most promising theory is that UHECRs are generated by active galactic nuclei (AGNs), and there are several physical models to motivate this idea (e.g. Protheroe & Szabo 1992; Diehl 2009), but this hypothesis requires empirical verification.
A number of difficulties hinder efforts to gain experimental evidence about UHECRs. The most fundamental problem is that CRs are deflected by the Galaxy’s magnetic field: the arrival directions of lower energy protons are essentially independent of their point of origin, although UHECRs are expected to be deflected by no more than a few degrees (e.g. Dolag et al. 2005; Medina Tanco et al. 1998). It is also problematic that UHECRs are very rare, with the observed number flux falling off with energy as (e.g. Abraham et al. 2010). The fall-off is expected to be even more extreme above , as protons at these energies interact with cosmic microwave background (CMB) photons to produce pions (Greisen, 1966; Zatsepin & Kuz’min, 1966, hereafter GZK). The GZK mean free path between interactions for an proton is only about , and each interaction typically reduces a CR’s energy by approximately (e.g. Rachen & Biermann 1993), so any observed UHECRs must have originated within an effective ‘GZK horizon’ of about . (If, alternatively, UHECRs are primarily Fe nuclei the GZK horizon is expected to be even smaller, although the deflection due to magnetic fields is greatly increased.) The GZK effect reduces the number of detectable UHECRs, but a fortunate consequence is that it also reduces the number of plausible AGN sources to the few thousand with distances of or, equivalently, redshifts of . This makes it plausible to search for a correlation between the arrival directions of UHECRs and locations of local AGNs, provided sufficiently many UHECRs can be observed.
The problem of the low UHECR arrival rate can only be overcome by using a large collecting area, and by observing for long periods of time. At present, the largest CR observatory is the Pierre Auger Observatory (PAO; Abraham et al. 2004), which has been operational since 2004 January. During its first years of observing, the PAO made reliable detections of the arrival directions and energies of 81 UHECRs, of which 27 had an (esimated) arrival energy of (Abraham et al., 2007b). These 27 events were found to be strongly correlated with a sample of local AGNs in the Veron-Cetty & Veron (2006, hereafter VCV) catalogue; this was the first strong empirical support for the hypothesis that UHECRs are generated by AGNs. The PAO has continued to operate in the time since these results were obtained; the latest data (Abreu et al., 2010) show a much weaker correlation. As discussed in Beatty & Westerhoff (2009), there have been many attempts to find a correlation between AGNs and UHECRs, using a variety of techniques and data, such as those reported by Nemmen et al. (2010), Abraham et al. (2008); Abraham et al. (2007b), Abbasi et al. (2008), Ghisellini et al. (2008) and George et al. (2008). In particular, Abbasi et al. (2008) claim no significant correlation.
Given the small numbers of UHECRs on which the PAO results are based, some care must be taken with statistical methods, both to ensure that all the available information is utilised and to avoid over-interpretation. These aims can be achieved by adopting a Bayesian approach in which the relevant stochastic processes (e.g. the GZK interactions of the UHECRs with the CMB, deflection by the Galaxy’s magnetic field, measurement errors) are explicitly modelled. Even though the details of some of these processes are not well known (most relevantly the strength of the magnetic fields and the energy calibration of the UHECRs), such uncertainties can be accounted for by marginalisation. Whereas the simple correlation analysis of Abraham et al. (2007b) ignores the arrival energy of the individual UHECRs, implicitly assuming that the GZK horizon is independent of , a likelihood-based approach can incorporate the fact that the very highest energy events are expected to have come from the most nearby AGNs. Similarly, the use of circular angular regions to match UHECR arrival directions and AGN positions is both sub-optimal (as real matches would tend to be more centrally concentrated) and potentially misleading (because any resultant statistic is as sensitive to physically implausible correlations as to the tighter angular matches that would be expected if the AGNs were the UHECRs’ progenitors).
While neither ignoring the individual UHECRs’ arrival energies nor using a hard effective GZK horizon are necessarily inconsistent, both choices decrease the constraining power of the data-set. For instance, a strong prediction of the AGN hypothesis is not only that UHECRs’ arrival directions will be correlated with nearby AGNs, but that every AGN-sourced UHECR will be directly associated with at least one candidate source, and that the most energetic events will come from the closer AGNs. Critically, it is possible to use a physical model of UHECR generation, propagation and observation, hence extracting much more of the valuable information in a UHECR data-set than is possible with other, more heuristic, analysis methods.
In this paper we take the first steps to developing a comprehensive Bayesian formalism for analysing UHECR data. Our starting point is to reanalyse the UHECR and AGN samples used by Abraham et al. (2007b), changing only the statistical method. Aside from providing an answer to the question of whether the 27 PAO UHECRs come from the local VCV AGNs, we will show directly how the results depend on the statistical method used to analyse such data-sets. After describing the UHECR and AGN samples in Section 2, our statistical method and CR propagation model are presented in Section 3. The results of applying this methodology are given in Section 4 and the overall conclusions are summarised in Section 5.
2 Data
The sample of UHECRs (Section 2.1) and the putative AGN sources (Section 2.2) analysed here are the same as used by Abraham et al. (2007b).


2.1 PAO observations of UHECRs
The PAO South is located near Malargüe in Argentina, at a longitude of 694 and a latitude of . It has 1600 surface detectors (SDs) that cover an area of , as well as four arrays of six atmospheric fluorescence telescopes. The PAO recorded UHECRs with reliable detected energies of between 2004 January 1 and 2007 August 31 (Abraham et al., 2007b). These 27 events are shown in Fig. 1.
The arrival directions of UHECRs are measured with an accuracy of about (Abraham et al., 2008) by the PAO, although there is an additional effective uncertainty in the progenitor directions as the UHECRs are deflected by Galactic and inter-galactic magnetic fields. The magnitude of this effect is somewhat uncertain, with estimates of the typical deflection angles ranging from (e.g. Dolag et al. 2005; Medina Tanco et al. 1998) to (e.g. Sigl et al. 2004) for UHECRs. Despite lack of knowledge about the magnetic field strengths, the combined effect of both the deflection and the errors in the directional reconstruction is to ensure that the observed arrival direction, , and the unit vector to the progenitor, , are separated by, typically, a smearing angle of a few degrees. We model this process by defining the conditional probability distribution of observed arrival directions of UHECRs from a source at as a two-dimensional Gaussian on the sphere,
| (1) |
We assume a fiducial smearing angle of unless otherwise stated, but also calculate results using and for comparison purposes.
Over the 3.6 years that the 27 UHECRs were detected, the effective area of the PAO increased steadily, but the evolution was sufficiently gradual that the exposure per unit solid angle, (which has units of area time) is a function of declination only. The angular dependence of the PAO exposure can be approximated by assuming that the instantaneous exposure is constant within of the zenith and zero otherwise. (The detailed angular dependence is dominated by the cross-sectional area of the SD array, and there are smaller corrections due to the various PAO data cuts, but these secondary effects are ignored here.) Integrating the instantaneous exposure over time to account for the Earth’s rotation (cf. Fodor & Katz 2001) yields the declination-dependent exposure shown in the left panel of Fig. 1. The total exposure, , for the PAO observations considered here is (Abraham et al., 2007a).
2.2 Local AGNs
We follow Abraham et al. (2007b) in considering only AGNs in the 12th edition of the Veron-Cetty & Veron (2006) catalogue as possible sources for the PAO UHECRs. The distance to each source, , is calculated from the quoted absolute and apparent magnitudes in the VCV catalogue, and AGNs without absolute magnitudes are omitted. The full VCV catalogue contains AGNs, but only have and are hence plausible UHECR progenitors inside the GZK horizon of about .
The VCV catalogue is heterogeneous, having been compiled from a variety of AGN and quasar surveys and, as such, it is not ideal for statistical studies. It is, however, expected to be close to complete for the local AGNs of interest here, except close to the Galactic plane. Moreover, as emphasised in Section 1, the VCV sample was chosen specifically to facillitate comparison with the results of Abraham et al. (2007b).
3 Statistical method
Do the observed arrival directions of the 27 PAO UHECRs provide evidence that at least some of them were emitted by known nearby AGNs? We answer this question by using a two-component parametric model characterised by the rate at which UHECRs are emitted by each AGN, , and the rate at which an isotropic background of UHECRs arrive at Earth, 11 1 The two rates have different units: is the average number of UHECRs emitted per unit time by an AGN, and is given in units of ; is the average number of background UHECRs arriving at Earth per unit time, per unit area, per unit solid angle and is given in units of .. If none of the UHECRs come from the candidate AGNs then the data should be consistent with ; conversely, if all the UHECRs come from the AGNs in the catalogue, then the data should be consistent with .
The full constraints on and implied by the PAO data are summarised in their joint posterior probability distribution, given by
where is the prior distribution that encodes any external constraints on the rates, is the likelihood of obtaining the measured data given particular values for and , and the integral in the denominator is the evidence. As we are not making any comparisons to other models, the only role the evidence plays here is to ensure the posterior is correctly normalised; hence it can be ignored when investigating the shape of the posterior. We adopt a uniform prior over and , which plausibly encodes our ignorance of these parameters and also includes the a priori possible value of zero for both rates (unlike the Jefferys prior, uniform in the logarithm of the rates). Hence the following posterior plots also show the likelihood – and, therefore, the constraining power of the PAO data – directly. Applying these simplifications, Eq. (3) reduces to
| (2) |
where is the Heaviside step function.
A self-consistent statistical treatment requires the use of intrinsic source and background rates, although these parameters are not particularly intuitive themselves in the absence of a physical model for the production of UHECRs. From those rates, however, we can calculate the expected number of source and background events in any sample, as well as the fraction of UHECRs that have come from AGNs, . The constraints on the expected UHECR numbers are simply proportional to those on the relevant rates; is given by the ratio of the expected number of AGN UHECRs to the expected total number. It is crucial that we begin by parameterising our problem with the fundamental physical quantities, the rates and , rather than the (as done in Abreu et al. 2010); the latter is defined by the physical rates along with the energy range and observing footprint of a particular dataset, and hence the posterior distribution of is derived from the posterior distribution of the rates, given in Eq.( 2). Moreover, in small samples in which the total arrival rate of UHECRs has a significant Poisson uncertainty, the only way to consistently account for the (independent) fluctuations in the source and background UHECRs is to parameterise their rates explicitly.
3.1 The likelihood
The likelihood is the probability of obtaining the observed data under the assumption of a particular model. Here, the data take the form of the measured arrival directions, , of the UHECRs (along with the value of itself). It is also possible to use the measured arrival energies of the UHECRs, a possibility which is investigated in Mortlock et al. (2011) but is not explored here. To evaluate the likelihood, we employ a ‘counts in cells’ approach, dividing the sky into pixels distributed uniformly in right ascension and declination. The data are hence recast as the set of UHECR counts in each pixel, . In the limit of infinitely small pixels this is mathematically equivalent to the likelihood written directly in terms of the arrival directions (Mortlock et al., 2011), but is more straightforward to analyse and simulate.
The full likelihood of the data is a product of the independent Poisson likelihoods in each pixel, and is hence given by
| (3) |
where and are the expected number of background and source UHECRs in pixel , respectively. In the limit of small pixels, the denominator in Eq. (3) can be ignored as if there is never more than one UHECR in a pixel.
The expected number of background UHECRs in pixel is
| (4) |
where the integral is over the ’th pixel and is the PAO exposure per unit solid angle (see Section 2.1). The expected number of UHECRs from known sources in pixel is
| (5) |
where the sum is over the AGN sources, is the smearing probability (Eq. 1), and is the rate (i.e. number per area and time) of UHECRs from a source at distance arriving at Earth above the cut-off energy, . This rate is therefore proportional to the source rate, , but further depends on both the shape of the AGN CR injection spectrum and also the distance-dependence of the GZK energy losses, and so requires an explicit UHECR model (see Eq. 9).
The positional dependence of and are both shown in Fig. 1. The right panel is a combination of both the PAO exposure and the local distribution of AGNs, although comparing the left and the right panel it is clear that the latter dominates. In particular, by far the strongest source is Centaurus A (with and ), which has previously been suggested as the dominant source of UHECRs (e.g. Abraham et al. 2007b).
It is possible within the Bayesian approach to assess whether any single UHECR came from a particular source, and the full formalism for doing so is presented in Mortlock et al. (2011). However, a useful estimate of the probability that a UHECR, with measured arrival direction in pixel , has come from one of the sources under consideration is
| (6) |
given values for the two rates. As the rates inferred from a sample of even just 27 UHECRs are not sensitive to any one event, it is reasonable to evaluate using the best-fit values of and to assess the likely origin of each UHECR in turn, and this is done for the PAO data in Section 4.
3.2 UHECR model
We adopt a simple model for UHECR generation in which all AGNs emit UHECRs at the same overall rate and with a power-law energy flux of . This implies a differential emission rate of the form . The spectrum is normalised such that the total emission rate of UHECRs with energy greater than is simply
| (7) |
where is the minimum UHECR energy and is the rate at which each source emits UHECRs (as above). The UHECR luminosity of each AGN is hence . We take to be the same for all AGNs, although it is plausible that the UHECR emission rate scales with an AGN’s hard X-ray luminosity (e.g. Protheroe & Szabo 1992). We also fix the logarithmic slope at (Abraham et al., 2010). Deviations from these fiducial models will be explored further in Mortlock et al. (2011).
The dominant energy loss mechanism of UHECRs is the interaction with the CMB photons through the GZK effect. Although clearly a stochastic process, its most important feature is the exponential decrease in a UHECR’s energy with distance. This can be captured by adopting a continuous loss approximation (cf. Achterberg et al. 1999) in which a UHECR’s arrival energy is given by
| (8) |
where is the distance to the source, is the average fractional energy loss per GZK interaction, and is the GZK mean free path (e.g. Rachen & Biermann 1993). It is also assumed that there are no further energy losses once a CR reaches , although this is unimportant for UHECRs with (such as those in the PAO sample analysed here).
3.3 Simulations
It is useful to test the constraining power of a small number of UHECRs by generating mock PAO samples with known progenitor properties. We created simulations of the two extreme cases: an AGN-only sample in which all the UHECRs were sourced from the nearby VCV AGNs and propagated using the simple GZK model described in Section 3.2; and an all-background sample in which the arrival directions are random over the whole sky. In both cases the incident UHECRs were subject to the PAO’s measurement errors and declination-dependent exposure. Both samples were constrained to have exactly 27 events so as to provide parameter constraints that can be compared directly with those from the real PAO sample22 2 It would be inconsistent to draw from a Poisson distribution with mean of 27, as the observed number of UHECRs is already the result of a Poisson draw from the (unknown) mean number expected. One of the more convenient aspects of Bayesian parameter estimation is that it is possible to obtain error estimates without the need for an ensemble of realisations..
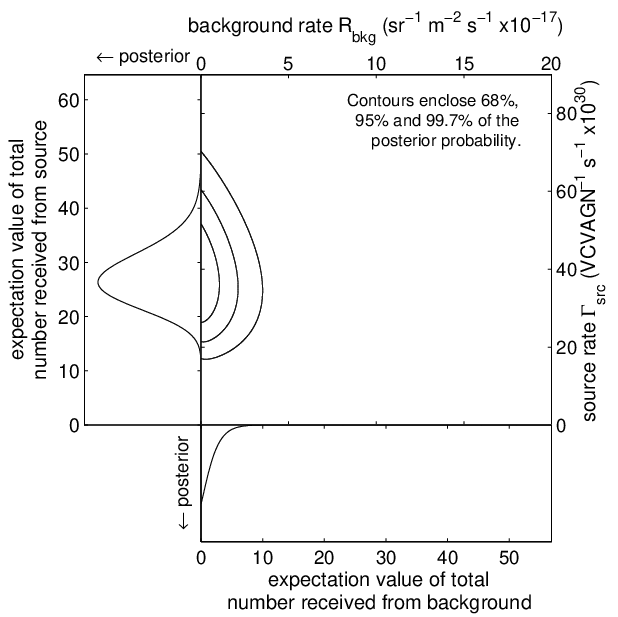
The results of the AGN-only simulation are shown in Fig. 2. As expected, the constraints on match the naive Poisson expectation; more interesting is the rejection of the possibility that more than a few of the PAO UHECRs are not from the VCV AGNs. The constraints on the AGN fraction (see Fig. 6) from such a data-set would be , where the quoted value is the maximum of the posterior, and all limits given in this paper enclose the most probable 68 % of the posterior. This strong result implies that, if AGNs source all UHECRs, even a sample of 27 events would be sufficient to confirm this hypothesis if a complete catalogue of the progenitors was available.

The results of the background-only simulation are shown in Fig. 3. Again, the constraints on match the Poisson expectation. The resultant constraints on the AGN fraction would be (see Fig. 6). However it is also important to note that some pixels (very far away from any AGN) have negligible contribution from the VCV AGNs, and because some of the UHECRs in this sample fell in those pixels, there is a strong upper bound on that is significantly lower than unity.
The fact that the posteriors from the AGN-only and the background-only simulations are almost completely disjoint implies that even a sample of just 27 UHECRs might be sufficient to provide a definitive answer as to their origin. Given the observed distribution of the PAO UHECRs, the parameter constraints from the real data should lie between the two extremes shown in Figs. 2 and 3.
4 Results


The posterior probability distribution in and given the PAO UHECR sample is shown in Fig. 4. The constraints in this figure represent our main result and it is useful to discuss some of its features in more detail. As expected, the posterior is intermediate between the extreme cases shown in Figs. 2 and 3. We find the marginalised rates to be (equivalent to UHECR source luminosity of ) and . We also calculate the posterior distribution of the fraction of the PAO UHECRs that come from VCV AGNs, shown in Fig. 6. The most probable value is , and the constraints can be summarised by the interval (where these limits enclose the most likely of the posterior probability).
As most extragalactic catalogues are incomplete close to the Galactic plane we also repeated the above analysis on a reduced data-set from which the region with Galactic latitudes of had been removed (see Fig. 5). The PAO exposure in the retained regions is and the number of UHECRs included was reduced from 27 to 22. The lower numbers resulted in slightly broader constraints on , as can be seen from Fig. 6. From this cut data, we find , and .
The analysis was also repeated using larger mean smearing angles of and . The limits on the AGN fraction in these models are () and (). In both cases the most probable value of is higher than in the fiducial model, although a broader range of values is compatible with the data as well. It is natural that a higher AGN fraction be compatible with the data given larger values of , as a greater fraction of the sky is within of at least one source, and this effect has been seen by e.g. Kim & Kim (2011) and Abraham et al. (2010). In particular, Kim & Kim (2011) report the fraction of observed UHECRs that originate from AGNs to be for a smearing angle of . However the best-fit value of increases less strongly with in the Bayesian formalism we present than found by using other methods; the inherent self-consistency of the Bayesian approach ensures the correct balance is struck between the compatibility of this more forgiving model and the lack of predictivity.
There is strong evidence of a UHECR signal from the known VCV AGNs, which manifests in the result that is 200 times more probable than , but not all the PAO UHECRs can be explained this way. These results could also be cast in terms of model comparison if only the background-only (i.e. ) or the AGN-only (i.e. ) possibilities were considered. The former case, which is the null hypothesis rejected by Abraham et al. (2007b), is actually reasonably consistent with the data, whereas the hypothesis that all the PAO UHECRs come from VCV AGNs is completely ruled out because there are several events with no plausible AGN progenitor in the VCV catalogue. The probability that each of the 27 UHECRs came from one of the VCV AGNs was calculated explicitly according to Eq. (6) by adopting the best-fit values for and given above; these probabilities are given in Table 1. For , only 9 events have , all of which were identified as being within of an AGN with by Abraham et al. (2007b). However the other 11 events which Abraham et al. (2007b) identified as AGN correlated have very low values of , in most cases because the angular correlation is with an AGN that is close to their maximum redshift and so has a significantly reduced UHECR flux at Earth. Moreover, 14 of the UHECRs have , with no plausible AGN progenitor, at least within the VCV catalogue. As also shown in Table 1, the results are similar, but less conclusive, for larger smearing angles. The AGN hypothesis cannot be ruled out for the low events, however: these UHECRs could have come from AGNs that are not in the VCV catalogue (and some could have come from VCV AGNs if deflected by more than a few degrees).
| PAO | |||||
|---|---|---|---|---|---|
| corr. | |||||
| no | 0.000 | 0.000 | 0.000 | ||
| yes | 0.559 | 0.761 | 0.681 | ||
| yes | 0.000 | 0.134 | 0.387 | ||
| yes | 0.099 | 0.067 | 0.033 | ||
| yes | 0.078 | 0.171 | 0.424 | ||
| yes | 0.380 | 0.528 | 0.493 | ||
| yes | 0.000 | 0.000 | 0.000 | ||
| yes | 0.870 | 0.836 | 0.711 | ||
| yes | 0.000 | 0.004 | 0.008 | ||
| yes | 0.000 | 0.000 | 0.000 | ||
| no | 0.000 | 0.000 | 0.001 | ||
| yes | 0.000 | 0.003 | 0.010 | ||
| yes | 0.099 | 0.067 | 0.033 | ||
| no | 0.167 | 0.533 | 0.577 | ||
| yes | 0.000 | 0.000 | 0.002 | ||
| yes | 0.000 | 0.006 | 0.011 | ||
| yes | 0.952 | 0.873 | 0.735 | ||
| no | 0.005 | 0.123 | 0.294 | ||
| yes | 0.000 | 0.000 | 0.000 | ||
| yes | 0.964 | 0.881 | 0.742 | ||
| yes | 0.000 | 0.000 | 0.002 | ||
| yes | 0.001 | 0.006 | 0.020 | ||
| no | 0.002 | 0.208 | 0.454 | ||
| yes | 0.000 | 0.001 | 0.003 | ||
| yes | 0.000 | 0.005 | 0.088 | ||
| no | 0.000 | 0.049 | 0.321 | ||
| no | 0.001 | 0.002 | 0.002 |

5 Conclusions
We have performed a Bayesian analysis to test whether the first 27 UHECRs with detected by the PAO (i.e. those observed before 2007 September) have come from the known local AGNs in the VCV catalogue. The first main conclusion from this analysis is that at least some do – or at least come from progenitors within a few degrees of the VCV AGNs. The fraction of UHECRs that come from the VCV AGNs is constrained to be . Conversely, our second important result is that many of the PAO UHECRs have not come from AGNs in the VCV catalogue, either because of incompleteness (most obviously close to the Galactic plane) or because there is another source of UHECRs, possibly in our own Galaxy.
Our results differ somewhat from those presented by Abraham et al. (2007b) due to our more explicit modelling of background and source events as well as the different statistical methods used. The starting point of their analysis is the null hypothesis that the UHECRs have not come from local AGNs; they find that this is rejected ‘at the 99% level’ given the number of the UHECRs that are within of a VCV AGN. This result was as expected, which illustrates the potentially circular reasoning when the obvious simple null hypothesis does not match prior knowledge (i.e. the expectation that some of the UHECRs did, in fact, come from the AGNs), although the strength of the correlation made it clear that there was at least some connection between the two populations. But it is impossible to go beyond this limited statement due to the use of arbitrary cuts in the correlation analysis (both in angular radius and AGN redshift), the equal weighting of the nearest known AGN, Centaurus A, with the hundreds of AGNs at distances of about , and the equal value placed on any angular match out to about , which dilutes whatever correlation signal is present (and also increases the chance that a non-AGN sourced UHECR is assigned a spurious match). The simulations of AGN-only and background-only UHECR samples shown here demonstrate that even a sample of just 27 events is sufficient to decisively distinguish between these two extreme possibilities, but also that the apparent strong correlation inferred by Abraham et al. (2007b) is in part due to the analysis method. By introducing a model of both the AGN-sourced UHECRs and a uniform background, the Bayesian analysis can be thought of as giving the optimal weight to any potential UHECR-AGN pairing, given our prior knowledge of the physics of UHECR propagation and the measurement process.
During the final preparation of this paper, the Pierre Auger Collaboration presented an extended analysis of an enlarged set of 69 UHECRs (Abreu et al. 2010), also comparing the UHECR arrival directions with other extragalactic catalogues. Aside from the correlation-based methods they had used previously, they also included a likelihood-based formalism that has some similarities to our method. The results of the two approaches are broadly similar (whilst differing from the earlier correlation-based analyses), primarily because they both include a physical model of UHECR propagation. They hence go closer to the ideal of including all the available information (i.e. not just the data but knowledge of the CR physics) and so produce more robust results.
In addition to applying the methods described here to this enlarged dataset, there are several extensions to our analysis that will allow more rigorous conclusions regarding the origins of these particles. Most importantly, we can account for the energy of individual CRs in our likelihood, rather than just demanding they are above the cut. This, in turn, will make it more important to use a more realistic, stochastic calculation of the GZK effect, and also the energy-dependent CR deflection due to magnetic fields. It will similarly be more important to investigate the possibility that the AGN UHECR emission rate scales with AGN luminosity; a corollary is that it may be possible to discriminate between different AGN emission models.
In future work, we will investigate whether UHECR data could be used yet more efficiently by including lower-energy events. This would obviously increase the numbers, although there is the potentially severe penalty of diluting the angular signal by including UHECRs that have either been deflected by more than about or have come from the many AGNs at distances of greater than about . To the degree that the CR propagation and deflection models are accurate, these trade-offs can be evaluated objectively, following the underlying principle of extracting as much information as possible from the UHECR measurements (Mortlock et al., 2011).
Another way to potentially make better use of UHECRdata would be to use a more homogeneous AGN sample than the VCV catalogue. An obvious example is the catalogue of AGNs from the Swift Burst Alert Telescope (BAT) survey (Tueller et al., 2008), which has nearly uniform selection criteria outside the Galactic plane. Both George et al. (2008) and the latest PAO analysis from Abreu et al. (2010) compare UHECR data to this catalogue. In particular, George et al. (2008) approach the analysis in a fashion similar to that of Abraham et al. (2007b) and found correlation at the ‘98% level’. Mortlock et al. (2011) will apply the fully Bayesian methods described in this paper to the BAT AGNs, as well as extending the approach in order to provide a more rigorous analysis. By combining optimal statistical methods with the ever-increasing UHECR data-sets it should soon be possible to definitively determine the origins of UHECRs.
Acknowledgments
This research would not have been possible without the help of several members of the Pierre Auger Collaboration, particularly Johannes Knapp, Angela Olinto, Benjamin Rouillé d’Orfeuil and Subir Sarkar. Abraham Achterberg’s help was also invaluable, in particular by providing an unpublished manuscript. Roberto Trotta provided valuable input during the early stages of this project. This paper was improved thanks to a number of thoughtful comments by the anonymous referee.
References
- Abbasi et al. (2008) Abbasi R. U., et al., 2008, Astroparticle Physics, 30, 175
- Abraham et al. (2004) Abraham J., et al., 2004, Nuclear Instruments and Methods in Physics Research A, 523, 50
- Abraham et al. (2007a) Abraham J., et al., 2007a, Astroparticle Physics, 27, 244
- Abraham et al. (2007b) Abraham J., et al., 2007b, Science, 318, 938
- Abraham et al. (2008) Abraham J., et al., 2008, Astroparticle Physics, 29, 188
- Abraham et al. (2010) Abraham J., et al., 2010, Physics Letters B, 685, 239
- Abreu et al. (2010) Abreu P., et al., 2010, Astroparticle Physics, in press (arXiv:1009.1855)
- Achterberg et al. (1999) Achterberg A., Gallant Y. A., Norman C. A., Melrose D. B., 1999, MNRAS, submitted (arXiv:astro-ph/9907060)
- Beatty & Westerhoff (2009) Beatty J. J., Westerhoff S., 2009, Annual Review of Nuclear and Particle Science, 59, 319
- Diehl (2009) Diehl R. L., 2009, Eur. Phys. J. D, 55, 509
- Dolag et al. (2005) Dolag K., Grasso D., Springel V., Tkachev I., 2005, JCAP, 1, 9
- Fodor & Katz (2001) Fodor Z., Katz S. D., 2001, PRD, 63, 023002
- George et al. (2008) George M., et al., 2008, MNRAS, 388, L59
- Ghisellini et al. (2008) Ghisellini G., Ghirlanda G., Tavecchio F., Fraternali F., Pareschi G., 2008, MNRAS, 390, L88
- Greisen (1966) Greisen K., 1966, Physical Review Letters, 16, 748
- Kim & Kim (2011) Kim H. B., Kim J., 2011, JCAP, 3, 6
- Medina Tanco et al. (1998) Medina Tanco G. A., de Gouveia dal Pino E. M., Horvath J. E., 1998, ApJ, 492, 200
- Mortlock et al. (2011) Mortlock D. J., Watson L. J., Jaffe A. H., 2011, MNRAS, in preparation
- Nemmen et al. (2010) Nemmen R. S., Bonatto C., Storchi-Bergmann T., 2010, ApJ, 722, 281
- Protheroe & Szabo (1992) Protheroe R. J., Szabo A. P., 1992, Physical Review Letters, 69, 2885
- Rachen & Biermann (1993) Rachen J. P., Biermann P. L., 1993, A&A, 272, 161
- Sigl et al. (2004) Sigl G., Miniati F., Enßlin T. A., 2004, PRD, 70, 043007
- Stoker (2009) Stoker P. H., 2009, Advances in Space Research, 44, 1081
- Tueller et al. (2008) Tueller J., Mushotzky R. F., Barthelmy S., Cannizzo J. K., Gehrels N., Markwardt C. B., Skinner G. K., Winter L. M., 2008, ApJ, 681, 113
- Veron-Cetty & Veron (2006) Veron-Cetty M. P., Veron P., 2006, Astronomy and Astrophysics, 455, 773
- Zatsepin & Kuz’min (1966) Zatsepin G. T., Kuz’min V. A., 1966, Soviet Journal of Experimental and Theoretical Physics Letters, 4, 78