Protoplanetary disc evolution and dispersal: the implications of X-ray photoevaportion
Abstract
We explore the role of X-ray photoevaporation in the evolution and dispersal of viscously evolving T-Tauri discs. We show that the X-ray photoevaporation wind rates scale linearly with X-ray luminosity, such that the observed range of X-ray luminosities for solar-type T-Tauri stars (1028-1031 erg s-1) gives rise to vigorous disc winds with rates of order 10-10-10-7 M⊙ yr-1. These mass-loss rates are comparable to typically observed T-Tauri accretion rates, immediately demonstrating the relevance of X-ray photoevaporation to disc evolution. We use the wind solutions from radiation-hydrodynamic models, coupled to a viscous evolution model to construct a population synthesis model so that we may study the physical properties of evolving discs and so-called ‘transition discs’. Current observations of disc lifetimes and accretion rates can be matched by our model assuming a viscosity parameter .
Our models confirm that X-rays play a dominant role in the evolution and dispersal of protoplanetary discs giving rise to the observed diverse population of inner hole ‘transition’ sources which include those with massive outer discs, those with gas in their inner holes and those with detectable accretion signatures. To help understand the nature of observed transition discs we present a diagnostic diagram based on accretion rates versus inner hole sizes that demonstrate that, contrary to recent claims, many of the observed accreting and non accreting transition discs can easily be explained by X-ray photoevaporation. However, we draw attention to a smaller but still significant, population of strongly accreting (10-8 M⊙ yr-1) transition discs with large inner holes ( 20 AU) that lie outside the predicted X-ray photoevaporation region, suggesting a different origin for their inner holes.
Finally, we confirm the conjecture of Drake et al. (2009), that accretion is suppressed by the X-rays through ‘photoevaporation starved accretion’ and predict this effect can give rise to a negative correlation between X-ray luminosity and accretion rate, as reported in the Orion data. We also demonstrate that our model can replicate the observed difference in X-ray properties between accreting and non-accreting T-Tauri stars.
Keywords:
accretion, accretion discs - circumstellar matter - planetary systems: protoplanetary discs - stars: pre-main-sequence - X-rays: stars.1 Introduction
Protoplanetary discs are a natural outcome of low mass star formation, providing a reservoir of material from which the star itself continues to accrete and from which planets may later form. The accretion history of a newly formed star, the evolution of its disc and the formation of a planetary system are all intimately linked and affected by irradiation from the central star. A lot of attention has recently been paid to the final dispersal of protoplanetary discs as this sets the time-scale over which planets may form. Observationally, the study of the dust content of these discs through the analysis of their continuum spectral energy distributions (SEDs), in the infra-red (IR), has enormously advanced over the past few decades. These observations have indicated discs evolve in a way that suggest ‘standard’ viscous evolution (Hartmann et al. 1998) for the first few Myrs (e.g. Haisch et al. 2001b), but then rapidly evolve from a disc-bearing (primordial) to disc-less status (e.g. Luhman et al. 2010; Muzerolle et al. 2010). This rapid clearing of the inner disc indicated from IR observations has been supplemented with complementary observations in the sub-millimetre that show most non-accreting stars (WTTs) are devoid of emission out to AU (Duvert et al. 2000). This suggests the removal of material material close to the star ( AU) is correlated with the removal of material at larger radius, ( AU); and is hence, associated with the entire destruction of the protoplanetary disc.
Furthermore, there have been several observations of discs thought to be caught in the act of clearing (e.g Calvet et al. 2002; Najita et al. 2007); these ‘transition’ discs show a deficit in emission at near-IR (NIR) wavelengths compared to a primordial optically thick disc (one that is optically thick all the way to the dust destruction radius), while returning to the emission levels expected from an optically thick disc at longer wavelengths. Currently, there is no clear consensus as to what constitutes a transition disc and both accreting (e.g. Hughes et al. 2009; Espaillat et al. 2010) and non-accreting (e.g. Cieza et al. 2010; Merín et al. 2010) objects have been discovered.
The frequency of these inner-hole sources is approximately 10 to 20% of the total disc population for young solar-type stars in nearby star forming regions (e.g Strom et al. 1989; Skrutskie et al. 1990; Luhman et al. 2010). If one assumes that these inner hole objects are indeed ‘transition’ discs (i.e. discs that are caught in the act of dispersal) and that the gas and dust evolution go hand-in-hand, then a 10% frequency of transition discs suggest a dispersal mechanism that operates over a tenth of the optically thick disc lifetime (Kenyon & Hartmann 1995). Moreover the colours of such discs imply that they clear from the inside out (Ercolano, Clarke & Hall, 2010).
The observations described above have encouraged theorists to propose dispersal mechanism that operate over two separate time-scales: a first time-scale of a few million years which allows discs to remain optically thick at IR wavelengths, followed by a brief dispersal phase that leaves the discs optically thin with colours consistent with those of bare photospheres or debris discs. The proposed mechanisms include planet formation itself (e.g. Armitage & Hansen 1999), grain growth (Dullemond & Dominik 2005), photophoresis (Krauss et al 2007), MRI-driven winds (Suzuki & Inutsuka 2009), and photoevaporation due to extreme ultraviolet radiation -EUV- (Clarke et al 2001; Alexander et al 2006a,b; Richling & Yorke 2000), X-ray radiation (Alexander et al. 2004; Ercolano et al 2008b, 2009; Gorti & Hollenbach 2009, Owen et al. 2010) and far ultraviolet radiation -FUV- (Gorti & Hollenbach 2009; Gorti et al. 2009). However there is still no consensus over which mechanism (or which combination) may dominate.
The recent developments of X-ray photoevaporation (XPE) models for T-Tauri discs have yielded encouraging results, suggesting that this may be the dominant player in disc dispersal. In particular, we have shown that X-ray photoevaporation rates exceed the EUV photoevaporation rates by two orders of magnitude (Ercolano et al 2009) and can easily reproduce the two time-scale behaviour suggested by the observations (Owen et al 2010). This model does not suffer from the uncertainties in the heating rates that plague the FUV model, due to the unknown abundance of PAHs in discs and the very uncertain photoelectric yields (see discussion in Ercolano & Owen 2010). Furthermore, Ercolano & Clarke (2010) discussed the role of metallicity in disc dispersal, and found that photoevaporation predicts shorter disc lifetimes at lower metallicity, in contrast to planet formation which would predict a very strong negative correlation. Yasui et al (2009) have presented observation that favour a positive correlation between disc lifetimes and metallicity and hence which favour XPE; however, it is too early to draw any definitive conclusions about the role metallicity plays in disc dispersal. Finally, the slightly blue-shifted forbidden line spectrum of discs seen almost face on (e.g. Hartigan et al 1995; Pascucci et al 2009) is well reproduced by the XPE model for all of the low ionisation and atomic diagnostics considered (Ercolano & Owen, 2010), an improvement over the EUV photoevaporation model which cannot reproduce the OI 6300Å line intensities (e.g. Font et al 2004).
More recent observations have focused on understanding the nature of some known transition discs (TDs) by investigating their gas content and accretion properties. Evidence for accretion and gas inside the dust inner hole has sometimes been used to argue against photoevaporation being the agent of inner-hole clearing (e.g. Espaillat et al 2010). This is however a misconception, perhaps based on earlier EUV-based photoevaporation models (Alexander et al. 2006b). In this work we show that the XPE model of Owen et al (2010) clearly predicts a transition phase where there is a detectable quantity of accreting gas inside the dust inner hole and is indeed consistent with the accretion versus inner hole size properties of most observed TDs.
In this paper we use radiation-hydrodynamics simulations to develop a X-ray photoevaporation model which is then used to construct a synthetic disc population to compare with available observed disc statistics. We discuss the X-ray luminosities of TTs in Section 2, while Section 3 provides a description of the X-ray photoevaporation model. In Section 4 we discuss a viscously evolving photoevaporating disc model and the construction of our disc population. In Section 5 we present the results from our population synthesis model while our final conclusions are given in Section 6.
2 X-ray Luminosity Function
The X-ray luminosity (), is a crucial input for the X-ray photoevaporation model, where we take the X-ray luminosity to span the range keV. As discussed in Section 3, the choice of fully describes the mass-loss rate due to photoevaporation in a given system.
The input X-ray spectrum is identical to the spectrum used in previous work (Ercolano et al. 2008b; Ercolano et al. 2009; Owen et al. 2010; Ercolano & Owen 2010). It is a synthetic spectrum generated by the plasma code of Kashyap & Drake (2000) and fits to Chandra spectra of T Tauri stars (e.g. Maggio et al. 2007). It includes an extreme ultraviolet component - EUV - (13.6-100 eV), soft X-ray component (0.1-1 keV) and a hard X-ray component ( keV). Ercolano et al. (2009) studied the effect of attenuating this X-ray spectrum with neutral columns. They found that at columns of order cm-2 the soft X-ray component was screened out and the photoevaporation rates dropped significantly. However, for columns cm-2 the photoevaporation rates remained unaffected. Furthermore, Ercolano & Owen (2010) showed that the X-ray wind itself is optically thick to EUV photons: thus when considering photoevaporation it is only the strength of the soft X-rays that is relevant. We assume that the soft X-rays are able to reach the disc surface as is consistent with the explanation of the OI 6300Å line emission presented in Ercolano & Owen (2010). Therefore, we adopt the unattenuated spectrum shown in Owen et al. (2010) and expect our results to generalise to cases of moderate screening. We will discuss the implications of this assumption further in Section 5.
It has been known for some time that there is a large scatter in the X-ray luminosity of T-Tauri stars for a given stellar mass (and bolometric luminosity). Therefore, we have used the data for the Taurus cluster (Güdel et al. 2007) and the Orion Nebular cluster (Preibisch et al. 2005) to build cumulative X-ray luminosity functions 11 1 Where the X-ray luminosity is taken to be in the range 0.3-10keV for the Taurus sample and 0.5-8keV for the Orion sample, consistent with our definition which includes both the soft and hard component. for the Orion sample functions (XLFs) for all pre-main sequence stars (including both CTTs and WTTs) in the 0.5 to 1 M⊙ range. The data for these two regions shows good agreement at low luminosity, but they differ at high luminosities, in the sense that the Orion data contains a higher fraction of sources with high . The difference is most probably not intrinsic to the X-ray properties of these two regions, but due to the different treatment of strong flares in the two samples. Strong flares were excluded in the Taurus data, in contrast to the Orion sample where luminosities were averaged over the whole observational period. Strong flares are relatively rare and Albacete Colombo et al. (2007) found that non-flaring sources have a median KeV, compared to flaring sources with KeV. Therefore, due to their higher X-ray temperature flares tend to emit most of their radiation in the hard X-ray region (as shown by observations of objects in a ‘flare’ state compared to in a ‘quiescent’ state, e.g. Imanishi et al. 2001), where the thermal impact is low, as discussed above. For this reason, the Taurus sample is the most appropriate for use in the photoevaporation model, since it should better approximate the quiescent and therefore softer X-ray luminosity, which as discussed above is the relevant input for calculations of the photoevaporation rate. Therefore, we adopt the Taurus XLF for the remainder of this work.
We assume that the X-ray luminosity function remains invariant throughout the stars’ pre-main sequence evolution. While it is known that the median of the stellar X-ray luminosity function does in fact decrease with age due to stellar spin down (e.g. Hemplemann et al. 1995; Güdel et al. 1997; Güdel 2004), the evolution of the X-ray luminosity during the disc dispersal phase is much smaller (see Figure 41, Güdel 2004). Certainly, any evolution of the X-ray luminosity for ages up to several tens of Myrs is smaller than the observed spread in X-ray luminosities at Myr. Furthermore, there is observational evidence that the X-ray luminosities of CTTs and WTTs are significantly different, with WTTs in general being more luminous than CTTs (e.g. Neuhauser et al 1995; Stelzer & Neuhauser 2001; Flaccomio et al. 2003; Preibisch et al. 2005). This has lead to a discussion of X-ray emission being ‘disturbed’ by accretion, in terms of either X-ray absorption in accretion columns (Gregory et al. 2007) or confinement of the X-ray producing corona in accreting systems (Preibisch et al. 2005). Recently, Drake et al. (2009) suggested that X-rays may modulate accretion through photoevaporation (something they called ‘photoevaporation starved accretion’). Such a scenario may be able to account for the difference in the observed X-ray luminosities of CTTs and WTTs since more luminous stars will lose their disc’s first.
In order to assess the effect of ‘photoevaporation starved accretion’ in explaining the X-ray observations we adopt here the null stance; the X-ray luminosity of an individual young stellar object (YSO) remains constant in time as our models evolve from CTTs to WTTs (i.e. we assume that the X-ray luminosity function is fixed).
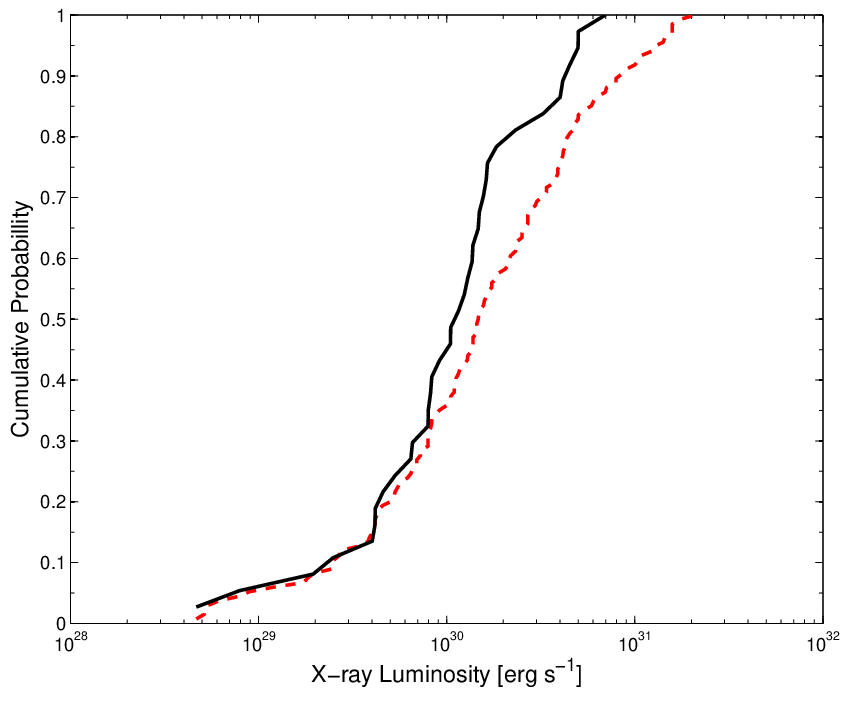
3 X-ray Photoevaporation
While the first self-consistent numerical simulations performed by Owen et al. (2010) were a significant step forward in understanding X-ray photoevaporation, the models were calculated for only one value of the X-ray luminosity (erg s-1). A variety of underlying disc models were considered, which showed that X-ray photoevaporation is fairly insensitive to the details of the X-ray ‘dark’ region, due to the fact that the sonic surface is located at least several flow scale heights from the X-ray ‘dark’/‘bright’ transition. However, the large observed spread in X-ray luminosities means that the dependence of photoevaporation on the X-ray luminosity needs to be considered.
Before we discuss the results of a detailed numerical investigation of parameter space, we can use simple fluid mechanics to predict the variation of photoevaporation rates with X-ray luminosity. Namely, any axi-symmetric inviscid steady state flow must satisfy the following conditions: conservation of mass; conservation of specific angular momentum; hydrostatic equilibrium perpendicular to the streamlines; and the conservation of a Bernoulli type potential22 2 While the conservation of the Bernoulli potential does not formally exist for non-barotropic flows, it is easy to verify that for the X-ray winds studied here (i.e. unconfined and thermally driven), one can find a suitable, well defined (single valued) function along each streamline that allows us to construct an energy integral equivalent to the Bernoulli potential for a baratropic flow with the identical . By uniqueness, this Bernoulli-type energy integral must be a conserved quantity along the streamline in the X-ray heated flow. along each streamline. As discussed in Ercolano & Owen (2010) the velocity and temperature in a thermally driven wind is intimately linked the value of the effective potential, and unlikely to be greatly affected by changes in the X-ray luminosity. Furthermore, as shown in Owen et al. (2010) the gas temperature can be roughly described in terms of the ionization parameter () alone. Thus if we consider any X-ray heated wind (primordial or a disc with an inner hole) and vary the X-ray luminosity, spatially fixing the temperature and velocity requires that the ionization parameter remains constant. This means that the density will scale globally in the flow as . It is then a trivial matter to show that the new wind solution we have constructed, with a different X-ray luminosity will still satisfy the required conditions described previously. Hence, we can use the conservation of mass to show that the X-ray photoevaporation model predicts:
| (1) |
for all X-ray flows including both primordial discs and disc with inner holes. Also, since the only change is to the global density, the normalised mass-loss profiles should also remain approximately independent of the X-ray luminosity. Furthermore, Owen et al. (2010) also showed that there was very little variation in mass-loss rate with inner hole radius.
3.1 Radiation-Hydrodynamic Models
We have performed radiation-hydrodynamic models to study the form of the mass-loss, under the assumption that it is driven by X-ray photoevaporation (XPE). We consider XPE from discs around solar-type stars for both primordial (optically thick discs extending into the dust destruction radius) and discs with inner-holes (in both gas and dust). We run primordial disc models at six equal logarithmic intervals between . We further calculate four inner hole models at three different X-ray luminosities (in addition to the eight models already computed by Owen et al. 2010 at ), at radii of AU. We start from an initial density structure of a protoplanetary disc surrounding a 0.7M⊙ star with =4000 K and =2.5, taken from the set of D’Alessio et al. (2004). We adopt the following elemental abundances, given as number densities with respect to hydrogen: He/H, C/H, N/H, O/H, Ne/H, Mg/H, Si/H, S/H. These are solar abundances (Asplund, Grevesse & Sauval, 2005) depleted according to Savage & Sembach (1996). We use the zeus2D code (Stone & Norman 1992) to calculate the hydrodynamical evolution of the disc, where the gas temperature due to X-ray irradiation is parametrised as a function of ionisation parameter using the 3D radiative transfer code mocassin (Ercolano et al 2003, 2005, 2008). The temperature of gas that is not heated by the X-rays is fixed to the dust temperature and the transition point between the X-ray bright and the X-ray dark region occurs at a column of 1022 cm-2. Such an approximation obviously results in a temperature and density discontinuity at this point; however, since this transition occurs well below the sonic surface (where the mass-loss rate is effectively set) it does not affect the resulting mass-loss rate. The distribution evolves to a steady state, with a bound X-ray dark disc and a thermally driven, X-ray bright, transonic photoevaporative wind. The numerical methods employed here and briefly described above are similar to those of Owen et al. (2010) and we refer the reader to that article for a more detailed description of the model setup.
3.1.1 Wind Rates & Streamline Topology
The numerical models described above were used to calibrate the analytical relations derived at the beginning of Section 3, which we can use to build a synthetic disc population. The main results are summarised as follows:
- 1.
As expected, for a star of a given mass the total mass loss rate scales almost linearly with the X-ray luminosity. This result applies to both primordial and inner hole sources. Specifically,
(2) where is a constant taking the value unity for primordial discs and 0.75 for discs with inner holes. Figure 2 shows the mass loss rates calculated by our grid of radiation-hydrodynamics models for primordial discs. Equation 2 is also a good fit for inner-hole sources, irrespective of hole size, for the cases studied here (inner hole radii between 5 and 70 AU).

Figure 2: Total mass-loss rates as a function of X-ray luminosity. Black squares represent the individual hydrodynamic models, the solid line represents the fit used in this work (Equation 2), the dashed line represents the linear analytical prediction. Figure 3 shows the results for inner hole sources, where the left and right panels show the mass-loss rate as a function of hole radius and X-ray luminosity respectively.
- 2.
The cumulative mass-loss rates (i.e. the radial profiles of the surface mass-loss rates) for different X-ray luminosities are fairly self-similar for primordial discs, and also for inner hole sources when one considers the profile as a function of , where Rin is the inner hole radius33 3 Throughout this work we use to refer to cylindrical co-ordinates and to refer to spherical polar co-ordinates.. Figure 4 (left panel) shows the normalised cumulative surface mass-loss rates as a function of radius for different X-ray luminosities for our primordial disc models. It is clear from the figure that higher X-ray luminosities produce a broader mass-loss profile; however, this has negligible effect on the global disc evolution and we adopt a mean profile, shown by the solid black line in the figure. Figure 4 (right panel) shows the normalised cumulative surface mass loss rates as a function of R-Rin for the inner hole models. The mean profile adopted for the inner hole models is shown again as the solid black line.


From the results presented in this section it is immediately apparent that the mass-loss properties for a star of a given mass are completely controlled by the X-ray luminosity. We can therefore construct a population synthesis model that includes only viscosity and XPE (with appropriate initial conditions, see Section 4.1).
4 Photoevaporating Viscous Discs
The evolution of the surface density of a photoevaporating and viscously evolving disc can be described in one dimension using the formalism of Lynden-Bell & Pringle (1974):
| (3) |
where (R) describes the viscosity term and represents the mass-loss due to photoevaporation calculated in the previous section. Before moving on to discuss our choice of initial conditions and viscosity law, it is worthwhile discussing the qualitative evolution of a photoevaporating viscously evolving disc. Equation 3 is perhaps easiest to understand in its integral form (i.e 3), which tells us:
| (4) |
where is the disc mass and is the accretion rate onto the star due to viscous transport. Equation 4 tells us immediately that there are two phases of disc evolution: when the disc evolution is dominated by the viscous transport of angular momentum and hence associated accretion rather than the removal of gas through photoevaporation. During this stage the disc will behave in a similar manner to a standard viscously evolving disc, without photoevaportion especially when . However, when it is now photoevaporation that dominates the evolution of the disc, opening a gap in the disc and then finally removing the remaining disc material until the disc is dispersed. The accretion rate of a disc evolves on the disc’s viscous time at the outer radius, which is of order the disc’s lifetime (Lynden-Bell & Pringle, 1974; Pringle, 1981; Ruden, 1993). The transition from a viscously evolving disc to a clearing disc occurs when a gap opens in the inner disc and the material inside the gap drains onto the central star. Since, the time-scale for the inner disc to drain is the viscous time at the point the gap opens (which is typically much less than the global viscous time of the disc), the transition from a viscously accreting disc (i.e. one that would observationally be classified as an optically thick accreting primordial disc) to one that is being dispersed, occurs on a time-scale much shorter than the disc’s current lifetime (Clarke et al. 2001; Ruden 2004).
Hence, the evolution of a viscously evolving photoevaporating disc can naturally explain the observations of discs which appear to evolve under the effect of viscous transport alone, but are then rapidly dispersed. A key test for a model of viscously evolving photoevaporating discs is to check whether it can self consistently explain the observational statistics for both the evolution of primordial discs and those thought to be in the act of clearing (i.e. ‘transition’ discs) and the time-scales associated with their evolution. As such, any model of disc evolution depends on the choice of viscosity law and the initial conditions associated with disc evolution.
4.1 Viscosity Law and Initial Conditions
We now turn our attention to the choice of initial conditions and viscosity laws that are required to solve Equation 3. We adopt the form , where , which we always evaluate at 1AU. Such a choice is appealing both observationally and theoretically, since it predicts a surface density scaling as which is supported by observations (e.g. Hartmann et al 1998; Andrews et al. 2010) and is consistent with a constant disc which is mildly flaring i.e. . Furthermore, we adopt the zero-time similarity solution of Lynden-Bell & Pringle (1974) for which the initial surface density distribution takes the form:
| (5) |
where M and R1 are the initial disc mass and a scale radius describing the exponential taper of the disc’s outer region . These initial conditions, together with the viscosity parameter and the X-ray luminosity fully determine the evolution of the disc through Equation 3.
At this point it is useful to construct a ‘null model’ of viscous evolution without photoevaporation that when combined with the observed X-ray luminosity function can explain the observed decline in disc fractions with age. In effect we are asking whether there is a universal set of disc viscous parameters which can explain the variation in disc lifetime from cluster to cluster purely in terms of the observed spread in X-ray luminosity. As discussed above the basic principle of all photoevaporation models is that discs should evolve viscously, hardly noticing the effects of photoevaporation, until the mass accretion rates in the discs have fallen to a value that is comparable to the photoevaporation rate44 4 Owen et al (2010) showed that XPE can create a gap in a disc only when the accretion rates onto the star are approximately an order of magnitude lower than the photoevaporation rates., at which point the remaining disc material is rapidly cleared.
Viscous evolution alone with predicts that accretion rates evolve as:
| (6) |
where is the viscous timescale at . This evolution should therefore be observed in discs before XPE sets in. We can equate the fraction of disc-bearing pre-main sequence stars at a given time (), with the fraction of stars in the X-ray luminosity function that have luminosities less than a cut-off X-ray luminosity . In order for objects with X-ray luminosities equal to to be about to lose their discs, the viscous accretion rate must be equal to at this point. We have performed this simple exercise using the disc fractions for nearby clusters compiled by Mamajek (2009), the Taurus X-ray luminosity function and the XPE theory developed above. The result is shown in Figure 5, where each point represents the current accretion rate cut-off in a cluster implied by XPE. We scale our results on disc fractions assuming an initial close binary fraction of 14% by considering that the 0.3Myr old cluster NGC 2024 (Haisch et al. 2001a), which shows a disc fraction of 86%, is too young for any disc to have been destroyed by photoevaporation or planet formation, but only through binary interactions. The solid line in the plot represents a suitable fit of Equation 6 to the data, from this fit we can extract an initial accretion rate of M⊙ yr-1and a viscous time of yr. From these two values we can calculate an initial disc mass of M⊙, which is similar to the canonical value (10% of the stellar mass) at which viscous angular momentum transport takes over from self-gravity.

Along with giving us appropriate initial conditions for our disc population model, the above also provides a stringent test of the hypothesis that X-rays are key to disc evolution and dispersal. If the X-rays were not the dominant dispersal mechanism, there is no a priori reason to expect a ‘null’ model constructed only using knowledge of the X-ray luminosity function and observed disc fractions to reproduce a plausible evolution of the accretion rates seen in CTTs, both in terms of the time exponent (in Equation 6) and its initial value. In fact, increasing or decreasing the spread about the median of the Taurus X-ray luminosity function by a factor of 5 or greater makes a fit of Equation 6 to the ‘null’ model impossible. Although this agreement could be fortuitous, it is reassuring that the X-ray luminosity function, disc lifetimes and accretion histories are consistent with our XPE hypothesis.
Furthermore, in order to uniquely specify the viscous evolution we must pick suitable values of and which in turn specifies . While any combination of and that give the required viscous time will reproduce the same ‘null’ viscous model (i.e. non-photoevaporating), a disc evolution model that includes photoevaporation mildly breaks this degeneracy. By performing a fit (by eye) of a viscously evolving photoevaporating disc population to the disc fractions used to derive the ‘null’ model we obtain values of and AU although due to the large scatter in the disc fractions and only mild breaking of the , degeneracy, we estimate errors on these values of a factor of 2-3. In Figure 6 we show the obtained fit to the disc fractions compiled by Mamajek (2009) for our viscously evolving photoevaporating disc model with a single set of initial conditions: M⊙, and AU.

Finally, Figure 7 shows the predicted evolution of accretion rate with time for individual disc models (each line shows the evolution of accretion rate with time for one disc model, for a given value of the X-ray photoevaporation rate). This clearly shows that a spread in accretion rates at late times Myr does not necessary require a spread in initial conditions as some authors have suggested is necessary outside the XPE framework (e.g. Armitage et al. 2003; Alexander & Armitage, 2009). Observationally there is however, a spread in accretion rates seen at early times 1Myr (e.g. Hartmann et al. 1998). This variability cannot be fit with a single set of initial conditions since photoevaporation has had no time to act on the disc. The failure to match the spread in accretion rates at early times Myr may not be surprising, since at early times the angular momentum transport mechanism may be dominated by self-gravity and accretion may be episodic (e.g. Lodato & Rice, 2005). In reality the zero time point in our models corresponds to the point at which the transition from a self-gravitating to a viscous disc occurs, as indicated by the determination of . This may explain, why our initial accretion rate is significantly lower than some of the accretion rates measured for the youngest objects (Hartmann et al. 1998).
Furthermore, better agreement for the early time data could easily be obtained by assuming a range of initial surface density profiles. Indeed our choice of a self-similar surface density distribution at zero time has no physical basis other than convenience (in fact it would be extremely surprising for discs to be born with the surface density distribution of the zero time similarity solution of Equation 3 given viscous angular momentum transport is not a key process during the disc formation stage). We emphasise, that any initial surface density distribution with the same initial viscous parameters , and will tend to the same evolution after a few viscous times as shown in Lynden-Bell & Pringle (1974). For this reason, we do not attempt to explain disc evolution at early times here, since we are mainly interested in the question of disc dispersal, for which only the viscous evolution phase at Myr is relevant.

5 Results and Discussion
We have used the methods and initial conditions derived in the previous section to construct a population synthesis model for the evolution of discs dominated by viscosity and XPE. We have calculated 500 disc models based on a random sampling of the Taurus X-ray luminosity function. Our disc evolution models are computed by solving Equation 3 numerically using the method set out in Owen et al. (2010), following the evolution of the disc until the disc is cleared to 100AU. At radii larger than 100AU the photoevaporation rates are extremely uncertain and we cannot be confident in results that continue the evolution beyond this radius. However, for the sake of completeness we will discuss the possible qualitative evolution of these remnant discs in Section 5.3. We now turn our attention to some specific predictions from these models and, where possible, compare them with observations.
5.1 Photoevaporation starved accretion
As discussed in Section 2, Drake et al. (2009) suggested that coronal X-rays suppress the accretion flow onto young solar-type stars through the driving of a photoevaporating wind. This photoevaporation starved accretion phase can explain the tentative negative correlation between mass accretion rate and stellar X-ray luminosity reported by Drake et al (2009). Moreover the reduction in disc lifetime in strong X-ray sources can explain the observation that the X-ray luminosities of accreting T Tauri stars are systematically lower than those of non-accretors.
The XPE models of Owen et al (2010) clearly show that there is indeed a phase in the disc evolution (before the opening of the gap) where the effects of this ‘starving’ are apparent in the radial dependence of the accretion rate. In Figure 8 we compare the accretion rate and surface density profiles of the median disc model undergoing XPE, 0.5Myr before the gap opens, against those of a disc which is only subject to viscous evolution. Inside AU the accretion rate drops before it reaches the star compared to the standard case where the accretion rate tends to a constant throughout the entire disc. This can be compared to the EUV photoevaporation model: in this case the mass-loss profile is narrowly peaked between AU (for solar type stars) and the total mass-loss rate is considerably less (M⊙ yr-1). This results in a shorter and much less pronounced period of ‘starving’ i.e. the disc is only affected inside a few AU. In contrast, the photoevaporation starved accretion lasts for 20-30% of the disc lifetime in the X-ray model, with significant consequences for global disc evolution: i.e. a flattening of the surface density profile and a significant drop in the accretion rate through the disc.

In Figure 9 we show the evolution of the surface density for the median disc model (i.e. the disc with the median X-ray luminosity of erg s-1 which corresponds to a photoevaporation rate of M⊙ yr-1) undergoing the stages of gap-opening and final clearing. This shows the drop in surface density through the disc between AU before the gap opens (as shown in Figure 8). Moreover the broad photoevaporation profile also causes the steady erosion of the disc during the draining of the inner hole, so that the hole (though opening at AU) roughly doubles in size during inner hole draining. Once the inner disc has completely drained there is a rapid clearing of the disc out to AU, because this region was previously depleted during the photoevaporation starved accretion phase. The fast clearing phase slows down once the inner hole reaches radii less affected by photoevaporation starved accretion. This results in a a total clearing time of roughly % of the disc lifetime, which is consistent with transition disc statistics. This can be compared to the EUV models of Alexander et al. (2006b), which resulted in a transition phase approximately 3% of the disc’s lifetime, and those of Clarke et al. (2001) which clear the outer disc on time-scales of the order of the disc lifetime.

The negative - correlation reported by Drake et al (2009) is a simple consequence of the fact that discs with higher X-ray luminosities produce more vigorous winds causing the disc’s accretion rates to be lower than those for discs with a less vigorous wind. Thus a negative - correlation is expected for clusters with a relatively narrow age range. This effect is however counteracted by the fact that discs with lower X-ray luminosities take longer to evolve, spending more time at lower accretion rates compared to high luminosity objects. Therefore, if the X-ray luminosity was compared to accretion rates for an entire disc population’s lifetime, in clusters with very large age spreads a positive correlation might be expected.
In Figure 10 we show plots of - for our synthetic ‘cluster’ members selected to give clusters with various narrow age ranges (upper panels and lower left panel) along with the a plot of the total disc population (bottom right panel). As expected, the XPE model predicts a positive - correlation for clusters with large age spread and a negative correlation for clusters with a narrow age spread. As a comparison, the age spread in Orion is roughly 2-3Myr (Haisch et al. 2001b), which explains the observation of a negative correlation by Drake et al. (2009).
The observation of systematically higher X-ray luminosities of non-accreting TTs (WTTs) compared to accreting TTs (CTTs) can also be explained by our models in terms of photoevaporation starved accretion. Figure 11 shows the time evolution of the median X-ray luminosity of the CTTs (solid line) and WTTs (dashed line) populations for our model compared to the data compiled by Güdel et al. (2007) for the Taurus cluster (black circles and red squares). We note the good agreement between the model predictions and observations. The dotted line represents the critical X-ray luminosity as a function of time which in our model separates CTTs and WTTs and corresponds to the X-ray luminosity of objects which have just opened a gap and have begun the clearing phase. The number of anomalous objects (i.e. CTTs above the line and WTTs below the line) is small at ages 1 Myr. Given uncertainties in age determinations (particularly at a Myr) the agreement between the observations and predictions is very encouraging.


5.2 The nature of transition discs: accreting and non-accreting
The recent observations of a class of transition (inner hole) discs with residual gas inside the inner dust radius and with signature of accretion has prompted some authors to question the viability of photoevaporation as the formation mechanism for the inner hole in some sources (e.g. Cieza et al 2010). Previous EUV-driven photoevaporation models (e.g. Alexander & Armitage 2009) indeed predicted that at the time of gap opening the surface density of the gas in the inner disc and the accretion rates due to the inner disc draining onto the star should be undetectable. This is however not the case for XPE, mainly due to the fact that the wind rates can be two orders of magnitude higher than the EUV-driven rates, meaning that at the time of gap opening the mass of the draining inner disc and the accretion rate onto the star of the inner disc material remain detectable for a non-negligible amount of time. For the disc population generated in this work, Figure 12, shows that the accreting inner holes and non-accreting inner-holes ( M⊙ yr-1) are in general equally likely out to a radius of AU. Clearly as the transition disc is further photoevaporated and its inner radius moves out the accretion signatures onto the star become less evident and non-accreting inner holes dominate at radii larger than 20 AU. The total integrated ratio out to 10AU (the radius probed by 24m emission around solar-type stars) is found to be accreting and non-accreting for the entire population. We caution that this is not equivalent to the observed fraction of accreting to non-accreting objects in a individual cluster, where the cluster age should also be accounted for. In young clusters the transition disc population is dominated by high X-ray luminosity objects which give rise to a considerably longer accreting inner hole phase. In contrast this ratio is much lower in old clusters where the transition disc population is dominated by low X-ray luminosity objects that have very short accreting inner-hole phases.

It is perhaps worth noting at this point that the detection of a ‘transition’ disc observationally is made through observation of the dust continuum spectral energy distribution (SED). Alexander & Armitage (2007) examined the behaviour of dust in a photoevaporating disc, finding that, under the action of dust drag, the time-scale for dust grains to drain onto the star is of order 103yrs, after the gap opens, approximately two order of magnitudes faster than the gas draining time-scales. This means that an observer would certainly see a significant drop in opacity in the inner disc immediately after a gap has opened, while the gas will still linger in the inner dust disc for the duration of its viscous draining time-scale of yrs.
We have used our population synthesis model to investigate the accretion rate versus inner hole size evolution for transition discs created by XPE under the assumption of immediate dust clearing at the time of gap opening. Figure 13 shows the probability distribution of the disc models in the - plane. The symbols represent a sample of observations of solar-type objects classified as ‘transition’ discs by Espaillat et al. (2007a,b,2008,2010) - Red Circles, Hughes et al. (2009,2010) - Red Squares, Kim et al. (2009) - Red Diamonds, Calvet et al. (2005) - Black Diamonds, Merín et al. (2010) - Black Squares and Cieza et al. (2010) - Black Triangles (Although Cieza et al. 2010 do not fit for the inner-hole radius they list as transitional sources those discs that have a deficit of emission in the Spitzer IRAC bands; therefore we conservatively estimate an inner hole radius of AU for all their sources).
It is immediately clear from the figure that there is a population of large inner hole, strongly accreting transition discs that cannot have been created by XPE. Gap opening by a giant planet or grain growth is perhaps the most plausible explanation for these objects. However, there is a significant number of discs with inner holes that are consistent with an XPE origin. Furthermore we note the lack of observations of non-accreting ‘transition’ discs with holes at radii greater than 20AU, where our model predicts a significant populations (although several non-accreting discs with large holes have been detected in different mass ranges e.g. Merín et al. 2010, where the observations probe different radial scales). The observations are still rather sparse and it is currently not possible to say whether the observed population of transition discs is a true representation or an artifact of observational selection effects.

One obvious consequence of an X-ray photoevaporation mechanism is that the properties of transition discs should be correlated with the X-ray luminosity, something no other model of photoevaporation or ‘transition’ disc origin would predict. In Figure 14, we show two such correlations namely the inner hole radius (left panel) and accretion rate (right panel) against X-ray luminosity, considering only accreting ‘transition’ discs (i.e. those with an accretion rate M⊙ yr-1). The plots have been generated by randomly sampling (in time) the accreting transition phase of each disc model several times, and should therefore provide a reasonable estimate of both the general form of the correlation plus the associated scatter. Clearly, since discs with higher X-ray luminosities open gaps earlier and at higher accretion rates a strong positive correlation between and would be expected and is reproduced by the models as shown.
Furthermore, we also recover a positive correlation between inner hole radius and X-ray luminosity for accreting transition discs as shown in the figure. We can understand this by remembering that while the inner disc is still draining the inner hole radius is also being eroded outwards as shown in Figure 9. Since, for more X-ray luminous objects the region being eroded is more depleted due to photoevaporation starved accretion and the magnitude of the mass-loss is higher, the inner-hole radius is able to be eroded to larger radius during the accreting phase. This explains the positive slope of the right hand extent of the symbols in the left panel of Figure 14.

5.2.1 Consequences of a different X-ray luminosity function
The X-ray luminosity function is a crucial input into the XPE model. In this work we have used the Taurus X-ray luminosity function as this best represents the quiescent X-ray flux the disc sees throughout its lifetime. However, here we discuss the consequences of a different X-ray spectrum that may be incident on the disc. If the incident spectrum the disc sees is systematically harder than the one used (through attenuation of the X-ray spectrum by large neutral columns close to the star) or softer than the spectrum used, the qualitative behaviour of the disc population would remain the same, since one can vary the initial condition to fit. Therefore, it is important to assess the qualitative changes relating to some of the predictions relating to transition discs. As discussed in Section 2 it is only the soft X-rays (0.1-1keV) that have any thermal impact, then the result of a changing spectrum can just be considered to be a change in the soft X-ray luminosity incident on the disc. Therefore, overall mass-loss rates can simply be scaled to this new harder/softer spectrum.
In Section 4.1 we argued that any X-ray luminosity function with a similar spread can have a ‘null’ model constructed to fit the observations of disc fraction. Thus, a harder or more attenuated spectrum would result in lower-mass loss rates, which would require a lower initial accretion rate, compared to a softer spectrum, which would require a higher initial accretion rate to explain the observed disc fractions. Provided this effect is systematic across all values of (i.e. in doesn’t change the spread of X-ray luminosities) then the consequences for the predicted ‘transition’ disc population can be considered. For the harder/more attenuated spectrum a lower initial accretion rate is required implying a lower initial disc mass, and therefore a smaller population of accreting transition discs, with lower accretion rates and smaller inner holes. The converse is true for a softer spectrum which requires a higher initial accretion rate and hence larger initial disc mass, giving rise to a larger population of accreting transition discs, with higher accretion rates and larger holes.
5.3 Final clearing of the disc
Our mass loss rates are only accurate out to 100 AU, since at this point other clearing mechanisms (e.g. FUV photoevaporation) may become dominant. For this reason, we have stopped our viscous evolution models once the inner hole reaches a size of 100 AU. If we were to extrapolate our models to clearing beyond 100AU using Equation 2, we would find that in about 10% of cases (sources irradiated by a low X-ray flux) the final clearing time-scales would exceed 10Myr, resulting in a population of long-lived discs with large inner holes. These discs may not survive long if FUV photoevaporation is efficient at large radii as suggested by Gorti & Hollenbach (2009). However, given the uncertainties in the FUV rates, we also consider the case where these objects survive for a long enough time for their dust continuum emission to be observed. The spectral energy distribution (SED) of these cold massive discs should be similar to that of young debris discs, where a debris disc model is normally considered to be a single temperature belt of optically thin dust (thought to be constantly replenished by collisions between planetesimals) at a given radius from the star (Wyatt 2008). This suggests that some of the sources that are currently classified as debris discs may in fact be ‘XPE relics’.
We have used the radiative transfer code of Whitney et al (2003a,b) to calculate the SED of a typical XPE relic using the standard input disc structure and dust properties of the code. The properties of these XPE relics were taken from the end point of the lowest X-ray luminosity (and hence the longest lived) model with an inner radius of 100 AU, outer e-folding radius of 310AU and a mass of M⊙in gas (and a dust to gas mass ratio of 0.01). While such a disc is likely to be settled in the dust, we computed three models: flat dust distribution, fully mixed dust distribution and a disc where . Figure 15 shows a plot of the fractional excess of the disc compared with the stellar photosphere at 24m and m, where we compare our models with observations of objects classified as young debris discs around solar-type stars (Wyatt 2008). It is clear from this figure that XPE relics with a degree of dust settling share the same space in the excess-excess plot as sources currently classified as young debris discs. The fully-mixed discs show a m excess which is probably too large to be classified as a debris disc, although it is extremely unlikely that any disc could survive for Myr without undergoing dust settling. We also note that the predicted 850m emission from the evolved XPE relics falls below the current detection limits at 50 pc (Andrews & Williams 2005), and thus these relics would not contradict previous sub-mm observations of WTTs which show that most are devoid of emission out to 500 AU (Duvert et al 2000). Only ALMA will be able to separate these large massive discs from canonical debris discs, and hence confirm or dismiss the existence of this proposed class of objects, placing constraints on the role of FUV photoevaporation at large radius.
6 Conclusions
We have used radiation-hydrodynamic calculations of X-ray photoevaporated discs coupled to a viscous evolution model to construct a population synthesis model, with which we have studied the physical properties of primordial and transition discs. The initial conditions and viscosity law are constrained using recent observations of disc fractions in nearby clusters (Mamajek 2009). We require a viscosity coefficient of approximately to match the observational constraints.

Our main conclusions can be briefly summarised as follows:
- 1.
X-rays play a major role in the evolution and dispersal of discs around solar-type stars, driving vigorous photoevaporative winds whose rates scale linearly with the X-ray luminosity, which are in the range of observed accretion rates for T-Tauri stars.
- 2.
We have constructed a ‘null’ accretion disc model using only knowledge of the observed disc fractions and X-ray luminosity functions under the assumption that discs are dispersed through X-ray photoevaporation. This ‘null’ model shows very good agreement with observed accretion rates in YSOs as well as their evolution with time, providing further independent confirmation of the viability of X-ray photoevaporation as a dominant dispersal mechanism.
- 3.
X-rays suppress accretion by preventing accreting material from reaching the star, since this material is removed through photoevaporation. This ‘photoevaporation starved accretion’ (Drake et al 2009) produces a negative correlation between X-ray luminosity and accretion rate for clusters with a relatively narrow age spread, in agreement with the observational correlation reported by Drake et al. (2009) in the Orion data.
- 4.
Our models successfully reproduce the observation that WTTs are systematically brighter in X-rays than CTTs. Whereas this has previously been interpreted as modification of X-ray emission or detectability by the presence of discs, our models support Drake et al. (2009) in reversing the causal link - i.e. that disc lifetimes are regulated by XPE and hence discless stars are on average those with higher .
- 5.
A large fraction (%) of observed transition discs can be easily explained by X-ray photoevaporation. There is however a population of strongly accreting transition discs with large inner holes AU that lies outside the region predicted by our models, suggesting that alternative mechanisms are responsible for their inner hole (e.g. binary interaction, grain-growth and/or planet formation).
- 6.
A fraction of currently observed objects classified as young debris discs (on the basis of their excesses at 24m and m) may in fact be the relics of X-ray photoevapored discs, which are predicted to be long-lived (10 Myr) for low X-ray luminosity sources. Future mass determination with ALMA are necessary to shed light onto the nature of these objects.
ACKNOWLEDGMENTS
We are grateful to the anonymous referee who helped improve the clarity of this work. The authors would like to thank Thomas Preibisch and Manuel Güdel for providing their data on X-ray luminosities and helpful discussions regarding X-ray luminosity functions. We also thank Jeremy Drake for insightful discussions on photoevaporation starved accretion, X-ray observations and the X-ray luminosity function. We would also like to thank Mark Wyatt and Mark Booth for helpful discussions regarding debris disc observations and to Mark Wyatt for providing the sample of debris disc observations used in this work. JEO acknowledges support of a STFC PhD studentship and is indebted to the University of Exeter Astrophysics Department for hospitality during the completion of this work. BE is supported by a Science and Technology Facility Council Advanced Fellowship.
References
- Albacete Colombo et al. (2007) Albacete Colombo, J. F., Flaccomio, E., Micela, G., Sciortino, S., & Damiani, F. 2007, A&A, 464, 211
- Alexander, Clarke, & Pringle (2004) Alexander R. D., Clarke C. J., Pringle J. E., 2004, MNRAS, 354, 71
- Alexander, Clarke, & Pringle (2006) Alexander R. D., Clarke C. J., Pringle J. E., 2006, MNRAS, 369, 216
- Alexander, Clarke, & Pringle (2006) Alexander R. D., Clarke C. J., Pringle J. E., 2006, MNRAS, 369, 229
- Alexander & Armitage (2007) Alexander, R. D., & Armitage, P. J. 2007, MNRAS, 375, 500
- Alexander & Armitage (2009) Alexander, R. D., & Armitage, P. J. 2009, ApJ, 704, 989
- Andrews & Williams (2005) Andrews, S. M., & Williams, J. P. 2005, ApJ, 631, 1134
- Andrews et al. (2010) Andrews, S. M., Wilner, D. J., Hughes, A. M., Qi, C., & Dullemond, C. P. 2010, arXiv:1007.5070
- Armitage & Hansen (1999) Armitage P. J., Hansen B. M. S., 1999, Natur, 402, 633
- Armitage, Clarke, & Palla (2003) Armitage P. J., Clarke C. J., Palla F., 2003, MNRAS, 342, 1139
- Asplund, Grevesse, & Sauval (2005) Asplund M., Grevesse N., Sauval A. J., 2005, ASPC, 336, 25
- Calvet et al. (2002) Calvet N., D’Alessio P., Hartmann L., Wilner D., Walsh A., Sitko M., 2002, ApJ, 568, 1008
- Calvet et al. (2005) Calvet, N., et al. 2005, ApJL, 630, L185
- Clarke, Gendrin, & Sotomayor (2001) Clarke C. J., Gendrin A., Sotomayor M., 2001, MNRAS, 328, 485
- Cieza et al. (2010) Cieza L. A., et al., 2010, ApJ, 712, 925
- Dullemond & Dominik (2005) Dullemond C. P., Dominik C., 2005, A&A, 434, 971
- Drake et al. (2009) Drake J. J., Ercolano B., Flaccomio E., Micela G., 2009, ApJ, 699, L35
- Duvert et al. (2000) Duvert G., Guilloteau S., Ménard F., Simon M., Dutrey A., 2000, A&A, 355, 165
- Ercolano et al. (2003) Ercolano B., Barlow M. J., Storey P. J., Liu X.-W., 2003, MNRAS, 340, 1136
- Ercolano, Barlow, & Storey (2005) Ercolano B., Barlow M. J., Storey P. J., 2005, MNRAS, 362, 1038
- Ercolano et al. (2008) Ercolano B., Young P. R., Drake J. J., Raymond J. C., 2008, ApJS, 175, 534
- Ercolano et al. (2008) Ercolano B., Drake J. J., Raymond J. C., Clarke C. C., 2008, ApJ, 688, 398
- Ercolano, Clarke, & Drake (2009) Ercolano B., Clarke C. J., Drake J. J., 2009, ApJ, 699, 1639
- Ercolano & Clarke (2010) Ercolano B., Clarke C. J., 2010, MNRAS, 402, 2735
- Ercolano & Owen (2010) Ercolano B., Owen J. E., 2010, MNRAS, 406, 1553
- Ercolano, Clarke, & Hall (2010) Ercolano B., Clarke C. J., Hall A. C., 2010, arXiv, arXiv:1008.0866
- Espaillat et al. (2007) Espaillat, C., et al. 2007, ApJL, 664, L111
- Espaillat et al. (2007) Espaillat, C., Calvet, N., D’Alessio, P., Hernández, J., Qi, C., Hartmann, L., Furlan, E., & Watson, D. M. 2007, ApJL, 670, L135
- Espaillat et al. (2008) Espaillat, C., et al. 2008, ApJL, 689, L145
- Espaillat et al. (2010) Espaillat C., et al., 2010, ApJ, 717, 441
- Flaccomio, Micela, & Sciortino (2003) Flaccomio E., Micela G., Sciortino S., 2003, A&A, 402, 277
- Font et al. (2004) Font A. S., McCarthy I. G., Johnstone D., Ballantyne D. R., 2004, ApJ, 607, 890
- Gregory, Wood, & Jardine (2007) Gregory S. G., Wood K., Jardine M., 2007, MNRAS, 379, L35
- Gorti & Hollenbach (2009) Gorti U., Hollenbach D., 2009, ApJ, 690, 1539
- Gorti, Dullemond, & Hollenbach (2009) Gorti U., Dullemond C. P., Hollenbach D., 2009, ApJ, 705, 1237
- Güdel, Guinan, & Skinner (1997) Güdel M., Guinan E. F., Skinner S. L., 1997, ApJ, 483, 947
- Güdel (2004) Güdel M., 2004, A&ARv, 12, 71
- Güdel et al. (2007) Güdel M., et al., 2007, A&A, 468, 353
- Haisch et al. (2001) Haisch, K. E., Jr., Lada, E. A., Piña, R. K., Telesco, C. M., & Lada, C. J. 2001, AJ, 121, 1512
- Haisch, Lada, & Lada (2001) Haisch K. E., Jr., Lada E. A., Lada C. J., 2001, ApJ, 553, L153
- Hartigan, Edwards, & Ghandour (1995) Hartigan P., Edwards S., Ghandour L., 1995, ApJ, 452, 736
- Hartmann et al. (1998) Hartmann L., Calvet N., Gullbring E., D’Alessio P., 1998, ApJ, 495, 385
- Hempelmann et al. (1995) Hempelmann A., Schmitt J. H. M. M., Schultz M., Ruediger G., Stepien K., 1995, A&A, 294, 515
- Hughes et al. (2009) Hughes A. M., et al., 2009, ApJ, 698, 131
- Kim et al. (2009) Kim, K. H., et al. 2009, ApJ, 700, 1017
- Imanishi, Koyama, & Tsuboi (2001) Imanishi K., Koyama K., Tsuboi Y., 2001, ApJ, 557, 747
- Kashyap & Drake (2000) Kashyap V., Drake J. J., 2000, BASI, 28, 475
- Krauss et al. (2007) Krauss O., Wurm G., Mousis O., Petit J.-M., Horner J., Alibert Y., 2007, A&A, 462, 977
- Kenyon & Hartmann (1995) Kenyon S. J., Hartmann L., 1995, ApJS, 101, 117
- Lynden-Bell & Pringle (1974) Lynden-Bell, D., & Pringle, J. E. 1974, MNRAS, 168, 603
- Lodato & Rice (2005) Lodato, G., & Rice, W. K. M. 2005, MNRAS, 358, 1489
- Luhman et al. (2010) Luhman K. L., Allen P. R., Espaillat C., Hartmann L., Calvet N., 2010, ApJS, 186, 111
- Maggio et al. (2007) Maggio A., Flaccomio E., Favata F., Micela G., Sciortino S., Feigelson E. D., Getman K. V., 2007, ApJ, 660, 1462
- Mamajek (2009) Mamajek, E. E. 2009, American Institute of Physics Conference Series, 1158, 3
- Merín et al. (2010) Merín B., et al., 2010, ApJ, 718, 1200
- Muzerolle et al. (2010) Muzerolle J., Allen L. E., Megeath S. T., Hernández J., Gutermuth R. A., 2010, ApJ, 708, 1107
- Najita, Strom, & Muzerolle (2007) Najita J. R., Strom S. E., Muzerolle J., 2007, MNRAS, 378, 369
- Owen et al. (2010) Owen J. E., Ercolano B., Clarke C. J., Alexander R. D., 2010, MNRAS, 401, 1415
- Neuhaeuser et al. (1995) Neuhaeuser R., Sterzik M. F., Schmitt J. H. M. M., Wichmann R., Krautter J., 1995, A&A, 297, 391
- Pascucci & Sterzik (2009) Pascucci I., Sterzik M., 2009, ApJ, 702, 724
- Preibisch et al. (2005) Preibisch T., et al., 2005, ApJS, 160, 401
- Pringle (1981) Pringle, J. E. 1981, ARA&A, 19, 137
- Richling & Yorke (2000) Richling S., Yorke H. W., 2000, ApJ, 539, 258
- Ruden (1993) Ruden, S. P. 1993, Planets Around Pulsars, 36, 197
- Ruden (2004) Ruden, S. P. 2004, ApJ, 605, 880
- Savage & Sembach (1996) Savage B. D., Sembach K. R., 1996, ApJ, 470, 893
- Skrutskie et al. (1990) Skrutskie M. F., Dutkevitch D., Strom S. E., Edwards S., Strom K. M., Shure M. A., 1990, AJ, 99, 1187
- Stelzer & Neuhäuser (2001) Stelzer B., Neuhäuser R., 2001, A&A, 377, 538
- Stone & Norman (1992) Stone J. M., Norman M. L., 1992, ApJS, 80, 753
- Strom et al. (1989) Strom K. M., Strom S. E., Edwards S., Cabrit S., Skrutskie M. F., 1989, AJ, 97, 1451
- Suzuki & Inutsuka (2009) Suzuki T. K., Inutsuka S.-i., 2009, ApJ, 691, L49
- Whitney et al. (2003) Whitney, B. A., Wood, K., Bjorkman, J. E., & Wolff, M. J. 2003, ApJ, 591, 1049
- Whitney et al. (2003) Whitney, B. A., Wood, K., Bjorkman, J. E., & Cohen, M. 2003, ApJ, 598, 1079
- Wyatt (2008) Wyatt, M. C. 2008, ARA&A, 46, 339
- Yasui et al. (2009) Yasui C., Kobayashi N., Tokunaga A. T., Saito M., Tokoku C., 2009, ApJ, 705, 54