Two pressure-induced structural phase transitions in TiOCl
Abstract
We studied the crystal structure of TiOCl up to pressures of =25 GPa at room temperature by x-ray powder diffraction measurements. Two pressure-induced structural phase transitions are observed: At 15 GPa emerges an 22 superstructure with -axis unique monoclinic symmetry (space group P21/). At 22 GPa all lattice parameters of the monoclinic phase show a pronounced anomaly. A fraction of the sample persists in the ambient orthorhombic phase (space group ) over the whole pressure range.
pacs
62.50.-p,61.50.KsI Introduction
Recently, high-pressure studies on the low-dimensional Mott-Hubbard insulators TiOCl and TiOBr have demonstrated the high sensitivity of their electronic and structural properties regarding the application of pressure. The first high-pressure experiments on TiOCl and TiOBr single crystals at room temperature revealed strong changes in the optical response in the infrared frequency range, with the suppression of the transmittance and increasing optical conductivity at high pressures.[2, 3, 4] Based on these results the possibility of a pressure-induced insulator-to-metal transition was suggested. However, subsequent electrical transport measurements on powder samples did not confirm a metallization of TiOCl at high pressure and found only an anomaly in the pressure-induced decrease of the charge gap at 15 GPa [5]. A controversy regarding the high-pressure electronic properties of TiOCl also exists from the theoretical point of view: Ab initio calculations were carried out based on density functional theory within the LDA+U approximation [6] and using Car-Parrinello molecular dynamics [7]. While the former claims an insulating phase up to at least 30 GPa, the latter predicts the metallic character of the high-pressure phases.
According to both experiment and theory, TiOCl exhibits structural phase transitions under pressure at room temperature. Signatures of a structural phase transition in TiOCl and TiOBr under pressure were first observed in x-ray powder diffraction studies.[3, 8] This structural phase transition coincides with an anomaly in the pressure-dependent electrical and optical properties at 15 GPa.[3, 8, 5] Blanco-Canosa et al. [6] confirmed the occurrence of a structural phase transition, but the corresponding critical pressure was considerably lower (10 GPa). The high-pressure phase was specified as -axis unique monoclinic phase with a strong dimerization of the 1D spin chain along .[6] It was furthermore claimed [6] that the dimerization is of pure electronic origin, i.e., resembles that of a conventional Peierls insulator, and that the magnetic interaction plays only a minor role at high pressure. It is noticed here that the reported symmetry[6] is not a subgroup of the ambient symmetry. The high-pressure phase thus is not a simple superstructure of the structure at ambient conditions, but it requires major rearrangements affecting the connectivity between atoms. These might be provided by the observed monoclinic angle of ∘ as compared to 90∘ in the orthorhombic phase. The reported atomic positions at : would require a mirror plane perpendicular to the -axis and thus are incompatible with the reported monoclinic -axis.[6] Besides, several aspects of the high-pressure phases still need to be clarified, e.g., the values of the critical pressures and possible superstructures being induced at higher pressures.
Here we present x-ray diffraction data on TiOCl for an extended pressure range up to 25 GPa. Our goal is to clarify the inconsistencies regarding the experimental findings for the high-pressure crystal structure of TiOCl. Besides a transition from the orthorhombic to the monoclinic crystal structure with an 2 superstructure, we find a pressure-induced isostructural phase transition for the monoclinic phase with anomalies in the lattice parameters.
II Experiment
Single crystals of TiOCl were synthesized by gas transport from TiCl3 and TiO2.[11] TiOCl crystallizes in the space group at ambient conditions and consists of distorted TiO4Cl2 octahedra. Pressure-dependent x-ray powder diffraction measurements at room temperature were carried out with monochromatic radiation (= 0.4128 Å) at beamline ID09A of the European Synchrotron Radiation Facility (ESRF) at Grenoble. Crystals were gently ground and placed into a diamond anvil cell (DAC). The material of the gasket was stainless steel, and its initial thickness and hole diameter was 40 and 150 , respectively. The applied pressures were determined with the ruby fluorescence method.[13] Helium served as hydrostatic pressure-transmitting medium. Diffraction patterns were recorded with an image plate detector and then integrated with FIT2D[14] to yield intensity vs 2 diagrams. The DAC was rotated by 3∘ during the exposure to improve the powder averaging. We carried out LeBail fits of the diffraction data using the Jana2006 software,[15] in order to determine the lattice parameters as a function of pressure. Rietveld refinements of the diffraction data could not be carried out due to the preferred orientation of the crystallites inside the DAC, as described earlier.[8]



III Results and discussion
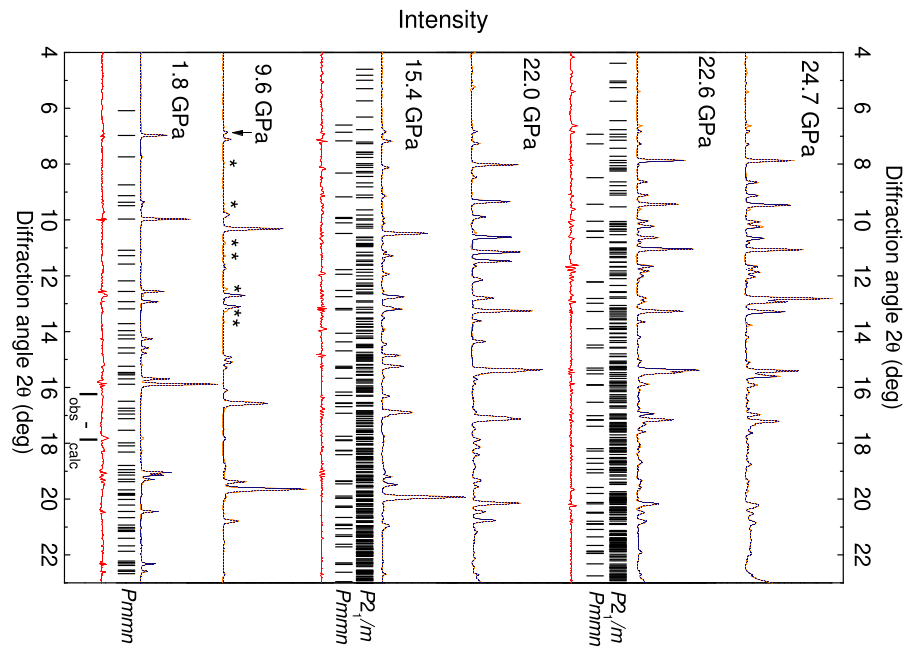
Fig. 1 shows the diffraction diagrams of TiOCl for all measured pressures. Fundamental changes in the diffraction diagrams are observed at 15.4 and 22.6 GPa, which define the critical pressures pc1 and pc2 for the two structural phase transitions. The x-ray powder diffraction diagrams of TiOCl for selected pressures up to 25 GPa are presented in Fig. 2. Up to the critical pressure 15 GPa the diffraction diagrams can be described by LeBail fits applying symmetry and lattice parameters of the ambient-pressure, orthorhombic crystal structure (space group ) and assuming contributions from the ruby chips added for the pressure determination. The lattice parameters and unit cell volume of the orthorhombic crystal structure obtained by the LeBail fits are shown in Fig. 3 and are in agreement with those reported in Refs. [8, 9]. We find a slightly nonlinear decrease of the lattice parameters with increasing pressure.
Above 15 GPa the diffraction diagrams can no longer be described by a single phase, but a good fit of the data can be achieved by assuming the coexistence of two phases – namely an orthorhombic phase (space group ) and a monoclinic phase (space group 21/, -axis unique) with double - and -axes. The lattice parameters and the angle of the monoclinic unit cell hardly change up to 22 GPa (see Figs. 3 and 4). The coexistence of two phases extends over a broad pressure range and signals the sluggish character of the phase transition. A large pressure range of phase coexistence, of 10 GPa or larger, has been observed for several first-order structural phase transitions [17, 18, 19] and suggests that the two phases are almost energetically degenerate.[20]
It should be noted that already above 7 GPa several weak reflections occur (marked with asterisks in Fig. 2, which cannot be related to the orthorhombic phase[21] but to the monoclinic phase, which fully develops at pc1 as described above. The appearance of diffraction peaks related to the monoclinic phase at pressures lower than pc1 might be due to non-hydrostatic conditions in the DAC, leading to locally higher pressures than indicated by the ruby fluorescence.
The appearance of additional reflections above pc1 due to a monoclinic phase in addition to those of the orthorhombic phase is also observed in the diffraction diagrams of Ref. 6. There, the additional reflections were attributed to a monoclinic phase with a doubling of the unit cell along the -axis. Furthermore, it was claimed[6] that the monoclinic phase above 10 GPa at room temperature resembles the monoclinic spin-Peierls phase occurring below the critical temperature at ambient pressure. This led to the conclusion that increases with increasing pressure, and it was proposed that reaches room temperature for pressures above 10 GPa.[6] In contrast to the results of Blanco-Canosa et al.[6] we find a doubling of the unit cell along both - and -axes in the monoclinic cell. This discrepancy could be explained by the fact that the results of Ref. 6 were restricted to the pressure range 15.2 GPa, where the monoclinic phase is not yet fully developed (which is the case only above pc1=15.4 GPa according to our data). Furthermore, it is important to stress the differences between the crystal structures of the ambient-pressure spin-Peierls phase at low temperatures and the high-pressure dimerized phase at room-temperature: While the former shows an -axis unique monoclinic symmetry with a monoclinic angle ∘,[22, 23, 24] the latter has a -axis unique monoclinic symmetry with monoclinic angle ∘.[6]
It is interesting to note that an approximated doubling of the monoclinic unit cell along the -axis was recently observed in a high-pressure x-ray diffraction study on TiOCl at =6 K:[10] Starting from the ambient-pressure, low-temperature monoclinic spin-Peierls phase, Prodi et al. found a pressure-induced suppression of the dimerization along the -axis in the vicinity of a first-order structural phase transition at around 13 GPa [10]. The high-pressure phase shows an incommensurate superstructure of the type (2-) and might be interpreted in terms of a conventional Peierls state.

At 22 GPa again significant changes in the x-ray diffraction diagram are observed (see Figs. 1 and 2), indicating the occurrence of a second structural phase transition: All lattice parameters of the monoclinic phase show pronounced anomalies at , as seen in Figs. 3 and 4. Above several weak reflections appear at diffraction angles below 10∘, which can neither be related to the orthorhombic and monoclinic phase, nor explained in terms of reflections from the ruby chips, the diamond anvils or the gasket. In view of the complicated phase diagram of TiOCl under pressure, with a coexistence of multiple phases, we explain these weak reflections in terms of a third phase appearing above . In order to specify the structural details of this third phase, x-ray diffraction data at higher pressures are needed.
In the following we speculate on the possible mechanism driving the structural phase transitions in TiOCl under pressure. We propose that their occurrence is closely linked to the tuning of the anisotropy or dimensionality of the system under pressure. For an illustration of the dimensionality, we plot and compare in Fig. 5 the lattice parameter ratios for the various phases. Here we assume that the average Ti-Ti distance scales with the lattice parameters. For the orthorhombic phase () the ratio / is shown for the whole pressure range studied. For the high-pressure phases we take into account the superstructures and thus plot the ratio / for the monoclinic phase (21/) in the pressure range .
For the orthorhombic phase the ratio / monotonically decreases with increasing pressure for the whole pressure range studied, with the tendency to saturation at high pressures. This indicates a pressure-induced enhancement of the one-dimensional character of the system consistent with an earlier report [6]. The enhanced one-dimensional character under pressure is due to the larger compressibility of the lattice along the -direction.[6] At a monoclinic phase with doubled unit cell along and is energetically degenerate with the orthorhombic phase. For this monoclinic phase we find a ratio / close to one, i.e., the system is close to two-dimensional, up to . This is due to the significant shrinkage of the unit cell along the -direction and its enlargement along the -direction, compared to the orthorhombic phase (Fig. 3). Accordingly, the interchain interaction is expected to play a major role in determining the electronic and magnetic properties of TiOCl in the monoclinic high-pressure phase. The importance of the interchain interaction in TiOCl at ambient pressure is commonly accepted.[26, 25, 27] Our data suggest an enhanced interchain interaction, comparable to the intrachain interaction, for . Above the ratio / drops to 0.9, i.e., similar to the ratio / of the orthorhombic phase at ambient conditions. Thus the material becomes more one-dimensional above .
The occurrence of two pressure-induced phase transitions in TiOCl was predicted by Zhang et al. [7]: At a structural phase transition with a change from an orthorhombic () to a monoclinic crystal structure (21/) accompanied by a doubling of the unit cell along is expected. The concomitant insulator-to-metal transition is proposed to be due to a broadening of the electronic bands and a redistribution of electronic occupation among the three bands.[7] A second first-order structural phase transition from the dimerized monoclinic 21/ phase to a uniform (undimerized) metallic phase with orthorhombic symmetry is predicted at the critical pressure =1.26.[7] Because of the structural changes and the orbital repopulation a dimensional crossover of TiOCl from quasi-one-dimensional to quasi-two-dimensional was proposed to occur above .[7] A tendency of the system at high pressures towards two-dimensionality is consistent with our experimental results. However, it occurs already above and is limited to the pressure range according to our data. Discrepancies also exist regarding the doubling of the unit cell along the axis, and, furthermore, we do not find a pure undimerized, orthorhombic phase at high pressures, as theory[7] predicts.
Interestingly, the pressure-induced structural instabilities seem to strongly depend on temperature: While at low temperature the dimerization along the -axis becomes energetically unfavorable above 13 GPa and a switching from the spin-Peierls phase to a phase with an incommensurate charge density wave along the -axis occurs,[10] at room temperature the dimerization along for persists at least up to 25 GPa according to our findings. Possible incommensurabilities of the superstructures at room temperature remain to be clarified.
IV Conclusions
Pressure-dependent x-ray powder diffraction data show the occurrence of two structural phase transitions in TiOCl at room temperature. Above 15 GPa a monoclinic phase (space group 21/, -axis unique) with a dimerization along the - and -direction emerges. At 22 GPa all lattice parameters of the monoclinic phase show pronounced anomalies. A fraction of the sample persists in the ambient orthorhombic phase (space group ) over the whole pressure range studied.
Acknowledgements
We acknowledge the ESRF Grenoble for the provision of beamtime. Financial support by the DFG, including the Emmy Noether-program, SFB 484, DFG-CL124/6-1, and Sm55/15, is acknowledged.
References
- [1] [∗] Email: christine.kuntscher@physik.uni-augsburg.de
- [2] C. A. Kuntscher, S. Frank, A. Pashkin, M. Hoinkis, M. Klemm, M. Sing, S. Horn, and R. Claessen, Phys. Rev. B 74, 184402 (2006).
- [3] C. A. Kuntscher, S. Frank, A. Pashkin, H. Hoffmann, A. Schönleber, S. van Smaalen, M. Hanfland, S. Glawion, M. Klemm, M. Sing, S. Horn, and R. Claessen, Phys. Rev. B 76, 241101(R) (2007).
- [4] C. A. Kuntscher, M. Klemm, S. Horn, M. Sing, and R. Claessen, Eur. Phys. J. Special Topics 180, 29 (2010).
- [5] M. K. Forthaus, T. Taetz, A. Möller, and M. M. Abd-Elmeguid, Phys. Rev. B 77, 165121 (2008).
- [6] S. Blanco-Canosa, F. Rivadulla, A. Pineira, V. Pardo, D. Baldomir, D. I. Khomskii, M. M. Abd-Elmeguid, M. A. Lopez-Qintela, and J. Rivas, Phys. Rev. Lett. 102, 056406 (2009).
- [7] Y.-Z. Zhang, H. O. Jeschke, and R. Valenti, Phys. Rev. Lett. 101, 136406 (2008).
- [8] C. A. Kuntscher, A. Pashkin, H. Hoffmann, S. Frank, M. Klemm, S. Horn, A. Schönleber, S. van Smaalen, M. Hanfland, S. Glawion, M. Sing, and R. Claessen, Phys. Rev. B 78, 035106 (2008).
- [9] C. A. Kuntscher, J. Ebad-Allah, A. Pashkin, S. Frank, M. Klemm, S. Horn, A. Schönleber, S. van Smaalen, M. Hanfland, S. Glawion, M. Sing, and R. Claessen, High Pressure Res. 29, 509 (2009).
- [10] A. Prodi, J. S. Helton, Y. Feng, and Y. S. Lee, arXiv: 0908.0518 (2009).
- [11] H. Schäfer, F. Wartenpfuhl, and E. Weise, Z. Anorg. Allg. Chem. 295, 268 (1958).
- [12] H. G. von Schnering, M. Collin, and M. Hassheider, Z. Anorg. Allg. Chem. 387, 137 (1972).
- [13] H. K. Mao, J. Xu, and P. M. Bell, J. Geophys. Res. 91, 4673 (1986).
- [14] A. Hammersley, computer program FIT2D (ESRF, Grenoble, 1998).
- [15] V. Petricek, M. Dusek, and L. Palatinus. Jana2006. A crystallographic computing system. Institute of Physics, Praha, Czech Republic (2006).
- [16] T. Sasaki, M. Mizumaki, K. Kato, Y. Watabe, Y. Mishihata, M. Takata, and J. Akimitsu, J. Phys. Soc. Jpn. 74, 2185 (2005).
- [17] G. Kh. Rozenberg, M. P. Pasternak, P. Gorodetsky, W. M. Xu, L. S. Dubrovinsky, T. Le Bihan, R. D. Taylor, Phys. Rev. B 79, 214105 (2009).
- [18] I. Loa, K. Syassen, X. Wang, F. Lichtenberg, M. Hanfland, and C. A. Kuntscher, Phys. Rev. B 69, 224105 (2004).
- [19] W. M. Xu, O. Naaman, G. Kh. Rozenberg, M. P. Pasternak, and R. D. Taylor, Phys. Rev. B 64, 094411 (2001).
- [20] Please note that the volume fractions of the phases cannot be extracted based on the LeBail fits.
- [21] The appearance of reflections above a certain pressure can be related to the loss of the preferred orientation of the crystallites in the DAC, as for example observed in the 12.7 GPa diffraction diagram, where a new reflection related to the orthorhombic phase is observed between 2=14∘ and 15∘.
- [22] M. Shaz, S. van Smaalen, L. Palatinus, M. Hoinkis, M. Klemm, S. Horn, and R. Claessen, Phys. Rev. B 71, 100405(R) (2005).
- [23] A. Schönleber, S. van Smaalen, and L. Palatinus, Phys. Rev. B 73, 214410 (2006).
- [24] A. Schönleber, G. Shcheka, and S. van Smaalen, Phys. Rev. B 77, 094117 (2008).
- [25] D. Fausti, T. T. A. Lummen, C. Angelescu, R. Macovez, J. Luzon, R. Broer, P. Rudolf, P. H. M. van Loosdrecht, N. Tristan, B. Büchner, S. van Smaalen, A. Möller, G. Meyer, and T. Taetz, Phys. Rev. B 75, 245114 (2007).
- [26] R. Rückamp, J. Baier, M. Kriener, M. W. Haverkort, T. Lorenz, G. S. Uhrig, L. Jongen, A. Möller, G. Meyer, and M. Grüninger, Phys. Rev. Lett. 95, 097203 (2005).
- [27] Y.-Z. Zhang, H. O. Jeschke, and R. Valenti, Phys. Rev. B 78, 205104 (2008).