A survey for Ly galaxies at z 3.1
Abstract
We describe the results of a deep survey for Ly emission line galaxies at z 3.1, carried out with the multislit imaging spectroscopy (MSIS) technique, with the FORS2 spectrograph on VLT-UT1. We discuss the criteria used to select the emission line galaxies and present the main physical characteristics of the sample: redshift, observed flux and equivalent width distributions.
1 Introduction
In the last decades our knowledge of the high redshift (z 2) universe has significantly increased. The observational technique that allowed such galaxies to be found, in a significant number, is the dropout technique [9]. It detects Lyman Break galaxies by the flux discontinuity due to their Lyman limit absorption [18, 19]. Since 1998, narrow band surveys reported the detection of Ly emission from objects in the redshift range 2.4 z 6.5 [10, 4, 1, 13, 14, 8, 16]. The Ly emission not only allows galaxies to be detected at very high redshifts, but also gives a valuable star formation diagnostic and facilitates the study of large scale structures at high redshift. With spectroscopic surveys the Ly emission line profiles can be studied [11, 17, 12, 15]. This, in turn, provides the possibility of testing models of the physical parameters of the Lyman emitters and to derive constraints on their stellar populations and their gas and dust content [21].
Here we present the results of a survey at z 3.1 carried out with the multislit imaging spectroscopy technique [6] (MSIS) with FORS2 on UT1.
2 Observational set up
2.1 The Multislit Imaging Spectroscopy Technique
MSIS is a blind search technique that consists of the combined use of a mask of parallel slits, a narrowband filter, and a dispersing element. It obtains the spectra of all emission line objects that happen to lie behind the mask slits. Our main purpose is to detect the [OIII] 5007 line emission for Planetary Nebulae (PNs), in order to study the kinematic properties of the Intracluster light (ICL) in the central regions of nearby ( 100 Mpc) clusters of galaxies [7, 20]. By dispersing the sky noise on many pixels, the technique enables measurements of very faint fluxes. Thus MSIS surveys are also suitable for the detection of the redshifted Å emission line from high-redshift Ly galaxies.
2.2 Observational set up
Data were collected in visitor mode during 2006 March 26-28, using the FORS2 spectrograph on UT1. The observed area covers the central region of the Hydra I cluster, around NGC 3311, at 10h36m42.8s, = -27d31m42s (J2000). The FORS2 field of view (FOV) is wide, corresponding to 10000 kpc2, and it is imaged onto a mosaic of two CCDs, rebinned in the readout. We used two narrow band filters, one centered at Å and a second one at Å, both with a FWHM of Å. In this way we are able to detect Ly emission lines in the redshift range 3.12 z 3.21. Spectra were obtained with the GRIS-600B grism, which has a spectral resolution of 0.75 Å/pixel at 5075 Å. The MSIS mask is made of slits, each of them wide and long. Each slit is projected along the dispersion axis onto 40 rebinned pixels. The effective area imaged by the slits is 7056 arcsec2, that is 4.5% of the whole FORS2 FOV. In order to cover the whole field, the MSIS mask was stepped 15 times on the sky to fill the region between two adjacent slits. For each mask position 3 exposures, of sec, were taken, ensuring a proper cosmic ray subtraction. The seeing during the three observing nights was in the range from to . We can detect emission line objects with a flux completeness limit of 3.4 10-18 erg cm-2s-1, and their positions and radial velocities can be measured at the same time. With this instrumental set up and total exposure time, monochromatic point like emissions appear in the final images as unresolved sources with a width of 6 pixels both in the spatial and in the wavelength direction. Therefore, the FWHM spatial resolution is 1”.1 and the FWMH spectral resolution is km s-1.
3 Data reduction
Data reduction was carried out following the procedure described in [3, 20]. After bias subtraction, the images were co-added and the continuum light from the two Hydra I galaxies was subtracted, with an fmedian filtering using a window of pixels. The 2D stacked spectra of the emission sources were then extracted, rectified, wavelength and flux calibrated. The total number of emission sources detected is 86. On the basis of the flux calibration the limit on the continuum is 710-20 erg cm-2 s-1Å-1. Continuum fluxes were calculated in the 60 Å wavelength range covered by the filter in which the emission line was detected.
In a first classification, all objects with unresolved emission lines and no continuum were classified as PN candidates; the remainder as background galaxy candidates. The PN candidate sample likely contains a fraction of unresolved Ly emitters without continuum which are not included in the present study.
4 Ly candidates and their physical characteristics
In the background galaxy sample 6 objects are classified as [OII] emitters; they are characterized by an emission line with a clearly visible continuum at all wavelengths. The remaining 20 objects are classified as candidate Ly galaxies. They include sources with resolved emission lines, either spatially or in wavelength or both, without continuum, and sources with resolved/unresolved emission lines and continuum only to the red side of the spectrum. This classification is supported by spectroscopic follow up of similar sample of background galaxies in previous PN surveys [5, 2, 11], and by the fact that the deep sample of Ly galaxies of [15] contains few foreground [OII] emitting galaxies, contrary to higher redshift samples [12].
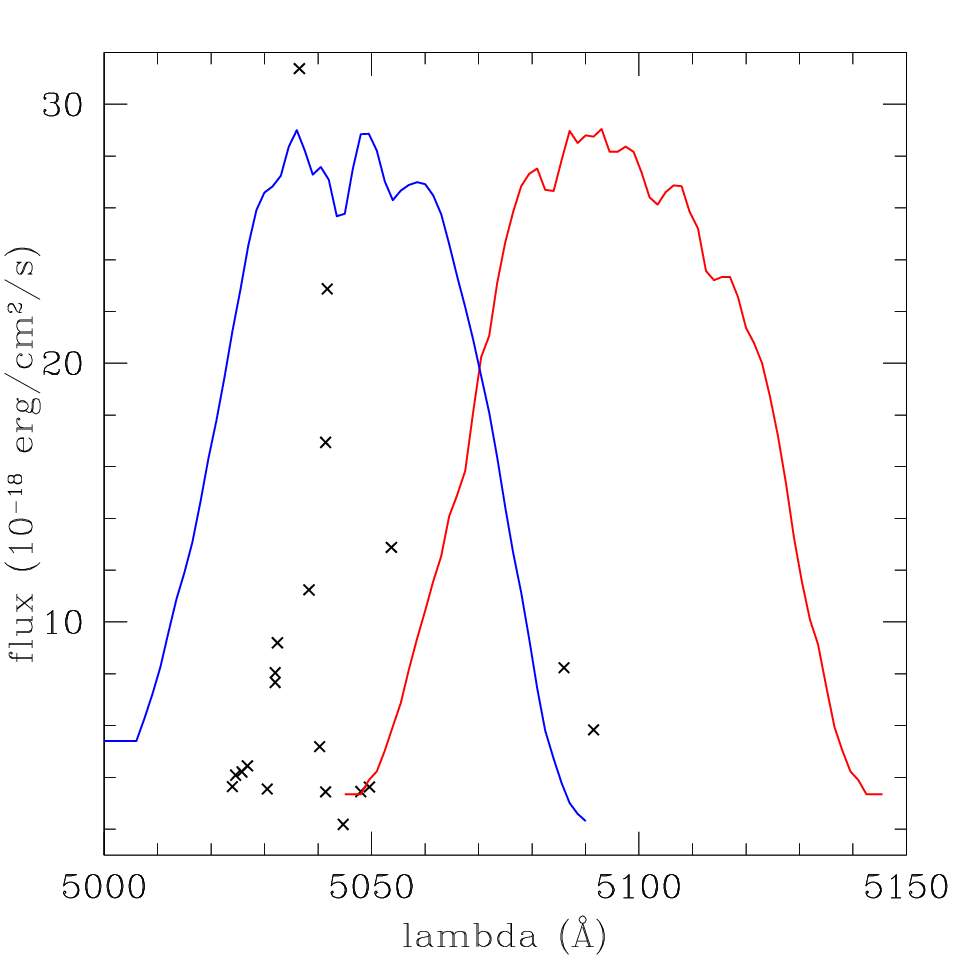
The redshift distribution of the Ly candidates (LACs) is shown in Figure 1. The emission lines of all objects were fitted by simple Gaussian profiles, both in the spatial and in the dispersion direction. For all the LACs, Fig.1 (upper left panel) shows the FWHM of the Gaussian profiles along the spatial direction vs. the FWHM of the Gaussian profiles along the dispersion direction. About 65% of the sample has an emission line which is spatially unresolved; the rest is spatially resolved. About 60% of the sample is unresolved in velocity and the rest is resolved.



Based on this information we adopt a simple morphological classification of the candidates: unresolved objects both spatially and in wavelength (PS), resolved objects in both directions (EXT) and resolved objects only in the spatial or wavelength direction, respectively (EXTs, EXTv). A proper morphological classification is beyond the purpose of the current work. More detailed discussion about morphology and the related physics of LACs can be found in [15, 21].
The fluxes were measured in apertures of km/s centred around the emission lines and corrected for the filter response. Fig.1 shows the fluxes of the LACs as a function of wavelength (upper right panel), and their flux distribution (lower left panel). The latter is peaked at 310-18 erg cm-2s-1 and is truncated at faint fluxes, because our survey is flux limited. The completeness limit of the sample is 3.410-18 erg cm-2s-1, while the detection limit is 210-18 erg cm-2s-1. The most luminous objects have fluxes greater than 2010-18 erg cm-2s-1.
The equivalent width (EW) distribution is also shown in Fig.1 (lower right panel). The continuum fluxes go from the limit on the 1 continuum value of 710-20 erg cm-2s-1 to 710-19 erg cm-2s-1. Most of the objects have an observed EW 200 Å.
A study of the luminosity function and a comparison of the number densities with results from previous surveys at redshift 3.1 will be the subject of a forthcoming paper.
Acknowledgements.
G. Ventimiglia is supported by an ESO studentship.References
- [1] \BYAjiki M. et al. \INAJ1262003091
- [2] \BYArnaboldi M. et al. \INAJ1232002760
- [3] \BYArnaboldi M. et al. \INPASJ592007419
- [4] \BYCiardullo R. et al. \INApJ5662002748
- [5] \BYFreeman K. et al. \INASP Conf. Series1972000389
- [6] \BYGerhard O. et al. \INApJ6212005L93
- [7] \BYGerhard O. et al. \INA&A4682007815
- [8] \BYGronwall C. et al. \INApJ667200779
- [9] \BYGiavalisco M. \INARA&A402002579
- [10] \BYHu E., Cowie L. L. \atqueMcMahon R. G. \INApJ5021998L99
- [11] \BYKudritzki R.P. et al. \INApJ5362000536
- [12] \BYMartin C.L., Sawicki M., Dressler A., McCarthy P. \INApJ6792008942
- [13] \BYOuchi M. et al. \INApJ6202005L1
- [14] \BYOuchi M. et al. \INApJSS1762008301
- [15] \BYRauch M. et al. \INApJ6812008856
- [16] \BYSchaerer D. \INReview7062007arXiv0706.0139S
- [17] \BYShapley A. et al. \INApJ588200365
- [18] \BYSteidel C.C., Giavalisco M., Dickinson M., Adelberger K.L. \INAJ1121996352
- [19] \BYSteidel C.C. et al. \INApJ4621996L17
- [20] \BYVentimiglia G. et al. \INAN32920081057
- [21] \BYVerhamme A., Schaerer D., Atek H. \atqueTapken C. \INA&A491200889