Resolution of puzzles from
the LSND, KARMEN, and MiniBooNE experiments
Abstract
This work has attempted to reconcile puzzling neutrino oscillation results from the LSND, KARMEN and MiniBooNE experiments. We show that the LSND evidence for oscillations, its long-standing disagreement with the results from KARMEN, and the anomalous event excess observed by MiniBooNE in and data could all be explained by the existence of a heavy sterile neutrino (). All these results are found to be consistent with each other, assuming that the is created in neutral-current interactions and decays radiatively into a photon and a light neutrino. Assuming the is produced through mixing with , the combined analysis of the LSND and MiniBooNe excess events suggests that the mass is in the range from 40 to 80 MeV, the mixing strength is , and the lifetime is s. Surprisingly, this LSND-MiniBooNE parameter window is found to be unconstrained by the results from the most sensitive experiments. We set new limits on for the favorable mass region from the precision measurements of the Michel spectrum by the TWIST experiment. The results obtained provide a strong motivation for a sensitive search for the in a near future decay or neutrino experiments, which fit well in the existing and planned experimental programs at CERN or FNAL. The question of whether the heavy neutrino is a Dirac or Majorana particle is briefly discussed.
pacs
14.80.-j, 12.60.-i, 13.20.Cz, 13.35.HbI Introduction
Over the past 10 years the LSND collaboration [1] has observed an event excess with a significance of 3.8 at LANSCE [2, 3]. This excess, originally interpreted as a signal from oscillations was not confirmed by further measurements by a similar experiment KARMEN [4], which was running at the ISIS neutron spallation facility of the RAL [5]. The MiniBooNE experiment at FNAL [6], designed to examine the LSND effect, did not find evidence for oscillations. However, an anomalous excess of low energy electron-like events in charge-current quasielastic () neutrino events over the expected standard neutrino interactions has been observed [7]. This MiniBooNE anomaly has been confirmed by the finding of more excess events [8]. Recently, the MiniBooNE experiment has reported new results from a search for oscillations [9]. An excess of events was observed which have a small probability of being identified as background-only events. The data are found to be consistent with oscillations in the 0.1 eV2 range and with the evidence for antineutrino oscillations from the LSND experiment.
The new observations bring more confusion than clarity to the experimental situation. The inconsistency between the results of the experiments, in particular between the LSND and KARMEN experiments, is also confusing in light of the apparent simplicity of the primary reaction, , used by these experiments for the oscillation signal search, and also in view of the fact that other results, e.g. the inclusive cross section for with an electron in the final state, measured by LSND [10] and KARMEN [11], agree quite well with each other and also with theoretical calculations. To reconcile the LSND, KARMEN, and MiniBooNE results in terms of the, so-called (3+1)- oscillations scheme or (a yet unknown) experimental background seems quite difficult [12]. Therefore, it is obviously important to ask whether neutrino oscillations are the only possible explanation for the observed anomalies.
This work has attempted to reconcile puzzling neutrino oscillation results from the LSND, KARMEN and MiniBooNE experiments. Our discussion is based on the fact that signals produced by electrons or by converted photons in these experiments are indistinguishable. This hint suggests that the excess events observed by LSND and MiniBooNE could originate from converted photons, and not from electrons. As an input, we use a natural extension of the model developed in Ref.[13] for an explanation of the MiniBooNe anomaly observed in data in terms of the radiative decays of a heavy neutrino. We show that the LSND evidence for oscillations, its long-standing disagreement with the results from KARMEN, and the anomalous event excess observed by MiniBooNE in and data could all be explained by the existence of a heavy neutral lepton (). All these observations are found to be consistent with each other, assuming that the ’s are produced in neutral-current interactions () and that they decay radiatively into a photon and a light neutrino . The ’s could be Dirac or Majorana type and could decay dominantly into if, e.g., there is a large enough transition magnetic moment between the and mass states. Discussions of other decay modes suggested for the explanation of the LSND signal can be found in Ref.[14].
We may consider the as a very weakly interacting particle directly produced by the flavor eigenstate in neutrino-nucleus reactions. However, it is known, that the neutrino weak flavor eigenstates () can be different from the mass eigenstates (), but they are related to them, in general, through a unitary transformation. A generalized mixing:
| (1) |
results in neutrino oscillations when the mass differences are small, and in neutrino decays when the mass differences are large. Hence, it would also be natural to assume that the , if it exists, is a component of muon neutrinos which is produced in interactions by muonic mixing, as illustrated in Fig.1. This assumption provides us with a useful framework for further discussions. An immediate consequence is that the can also be produced through interactions in leptonic and semileptonic decays of sufficiently heavy mesons and baryons according to the proper mixing strength, as follows from Eq. (1), and phase space and helicity factors [15, 16] (see also [17]). Note that, although weak interactions of ordinary particles are , one could assume that the heavy neutrinos may dominantly be produced by non-left-handed couplings; see e.g., the discussion in Ref.[15]. Therefore, it would be interesting and important to have a general analysis of the production of heavy neutrinos of Dirac or Majorana type, e.g. in interactions, for arbitrary weak couplings including the leptonic mixing and helicity effects. This is, however, beyond the scope of the present work.

The rest of the paper is organized as follows. In Sec.II we describe the formalism for the radiative neutrino decay, specifying the difference between the Dirac and Majorana decay modes. The results from the LSND and KARMEN experiments are described in Sec.III. Here we show how the suggested model explains those results. In Sec.IV we briefly describe the MiniBooNE experiment and give an explanation of the anomalous excess of events observed in and data. The final results from the combined analysis of the LSND and MiniBooNE data are reported in Sec.V. The discussion and review of the experimental and some cosmological and astrophysical constraints on the mixing strength and neutrino magnetic moment are presented in Sec.VI. We find that, quite surprisingly, the () parameter space favorable for the explanation of the LSND and MiniBooNE results is unconstrained by the results from the most sensitive experiments, e.g. searching for a peak in decays. Moreover, we show that taking into account the dominance of the radiative decay and its short lifetime, makes existing experimental bounds weaker, allowing them to be extended to the higher mass region. In Sec.VII, several proposed experiments to search for the are described. We also show that, several tests can be applied to existing data. Section VIII contains concluding remarks.
II Radiative neutrino decay
Let us consider the decay of a heavy neutrino of mass and energy into a lighter neutrino and a photon:
| (2) |
with the partial lifetime . The energy of the decay photon in the rest frame given by
| (3) |
is in the range , depending on the mass of the , which may be in the range . Furthermore, for simplicity we assume that the particle is almost massless, and the photon energy in the rest frame is . The energy of the decay photon in the laboratory frame depends on the initial energy and on the center-of-mass angle between the photon momentum and the direction of flight:
| (4) |

Hence, the energy distribution of photons in the laboratory system depends on their angular distribution in the rest frame, which is not generally isotropic [18]:
| (5) |
Here, the angle is defined as above and is the asymmetry parameter. It is also possible to define as the angle between the direction of spin, the only direction available in the rest frame, and the photon momentum. However, if we assume that the spin of is (anti)parallel to its momentum, both definitions are equivalent.
The decay of a spin- neutrino into another spin- particle and a photon can be generally described by two helicity amplitudes and corresponding to the final states shown in Fig. 2. For the most general coupling given by [19, 20, 21]
| (6) |
the amplitudes and are proportional, respectively to and . If is conserved, the helicity amplitudes and for the decay of Majorana neutrinos are equal. In this case the decay would be isotropic and independent of the polarization, and hence in Eq.(5). Indeed, suppose the decay is anisotropic in the center-of-mass system and photons are emitted preferably, say opposite to the spin direction. Because of conservation, the -mirror image of this process should also exist, and it would correspond to the decay with photons emitted preferably along the spin direction. But, if the is its own antiparticle, the decay anisotropy must be the same for the and its -mirror image. Hence, the decay must be isotropic. For the Dirac case, the and its -mirror image are not identical and the above arguments do not hold. For Dirac the angular anisotropy is the result of parity nonconservation in the decay (2) and of nonvanishing polarization of the neutrinos. The decay asymmetry parameter given by
| (7) |
is, in general, not constrained, and it may be in the range [19, 20]. In the standard model , so that
| (8) |
is equal to zero only when . For left-handed Dirac neutrinos and , one has , which means that the decay photons are emitted preferably backward [19, 20, 21], shifting the energy spectrum in the laboratory frame towards lower energies. For the right-handed Dirac neutrinos, one has , and the photons are emitted preferably in the forward direction, making the energy spectrum harder. Hence, the energy spectrum and angular distribution of the decay photons are sensitive to the type of . Note that if is conserved, the decay rate and the center-of-mass angular distributions for the Dirac case are the same for the as for the decay modes with respect to the beam direction. Furthermore, we assume that the decay is generally conserving (see also Sec.IV.B).
As mentioned above, the most natural way to allow the radiative decay of heavy neutrino is to introduce a nonzero transition magnetic moment () between the and mass states; see e.g. [22, 23]. Such coupling of neutrinos with photons is a generic consequence of the finite neutrino mass. Observations of the neutrino magnetic moment could allow to distinguish if neutrinos are of Dirac or Majorana type since the Dirac neutrinos can only have flavor conserving transition magnetic moments while the Majorana neutrinos can only have a changing one. In addition, Dirac neutrinos can have diagonal magnetic moments while Majorana neutrinos cannot. The nonzero magnetic moment of the neutrino, although tiny, is predicted even in the standard model. The detailed calculations of the radiative neutrino decay rate in terms of the neutrino masses and mixings of Eq.(1) were performed long ago, see e.g. [19, 20, 21]. The radiative decay mode could even be dominant, if the value is large enough; see [22, 23]. Originally, the idea of a large (Dirac) magnetic moment (, where is the Bohr magneton) of the electron neutrino has been suggested in order to explain the solar neutrino flux variations [24]. Taking into account that in many extensions of the standard model the value of the is typically proportional to the mass, the intention to make the radiative decay of a MeV dominant by introducing a large transition magnetic moment (or through another mechanism) is not particularly exotic from a theoretical viewpoint. Such types of heavy neutrinos are present in many interesting extensions of the standard model, such as GUT, superstring inspired models, left-right symmetric models and others, for a review; see e.g. Ref.[22].
The total decay width can be defined as , where is the decay rate, and is the sum over decay modes whose decay rate is proportional to the square of the mixing . For the with a mass MeV, the dominant contribution to comes from and decays, for which the rate calculations can be found, e.g. in [25, 26, 27]. The decay rate due to a transition moment is given by [28]
| (9) |
The decay rate can be estimated as
| (10) |
and the sum rate . For MeV, and , we found that the radiative decay is dominant, as its branching fraction .
| LSND | KARMEN | |
| beam kinetic energy, MeV | 800 | 800 |
| total number of POT’s | ||
| distance to target, m | 30 | 17 |
| angle between the and beams | 12o | 90o |
| total flux | ||
| from DAR | 1.26 | 8.86 |
| from DAR | 1.08 | 7.6 |
| from DIF | 2.2 | |
| efficiency | 0.17 | 0.19 |
| energy range , MeV | 20 - 60 | 16 - 50 |
| observed events | 87 | 15 |
| background | ||
| event excess, | ||
| event excess, | (90% C.L.) | |
| oscillation probability | (90% C.L.) |
III Interpretation of the LSND and KARMEN results
The LSND and KARMEN experiments used neutrinos produced in the beam stop of a proton accelerator. LSND finished data taking at LANSCE at the end of 1998, while KARMEN finished data taking in 2001. In these experiments, neutrinos were produced by the following decays of pions and muons occurring in the proton target:
- •
decays in flight (DIF) or at rest (DAR),
- •
DAR,
- •
DIF,
- •
DAR.
The main detector properties and the neutrino fluxes in these experiments are summarized in Table 1.
III.1 The LSND signal of oscillations
In 1996 the LSND experiment published evidence for oscillations, based on the observation of an excess of -like events [2]. Measurements performed from 1996-1998 with a different target configuration confirmed the evidence and improved the significance of the observed excess. The LSND detector is described in detail in Ref. [29]. It was located at a distance of 30 m downstream of the main LANSCE beam-stop A6 at a small angle of relative to the primary proton beam. The detector was a cylindrical volume filled with 167 t of a dilute mineral oil (CH2) based liquid scintillator viewed by photomultipliers (PMT) and surrounded by an active 4 veto shield. The low light-yield of the scintillator allowed for the detection of Cherenkov light generated by relativistic muons, electrons, and converted photon tracks. This feature was of great importance for particle identification and reconstruction of its direction. The energy resolution of the detector was about at 50 MeV electron energy.
The search for oscillations was based on the appearance of in the neutrino beam, detected through the reaction resulting in a prompt relativistic , followed by a 2.2 MeV gamma signal from the neutron capture . The candidate events identification and separation from the background were based on the detection of the prompt and directional Cherenkov light, and scintillation light which is delayed and isotropic. The 2.2 MeV signal from the reaction is correlated in time with the positron one. It was identified and separated from accidental low-energy ’s by means of a likelihood parameter , which is defined as the ratio of the likelihood of a low-energy event being correlated or being accidental. The parameter was defined by three values: i) the PMT multiplicity, which is proportional to the energy, ii) the radial distance between the reconstructed positions of the and , and iii) the time difference between the and , which is defined by the capture time of 186 s of neutrons in mineral oil, while accidentals are distributed uniformly in time. A fit to the distribution obtained from the 1993-1998 measurements resulted, after subtraction of background from DAR and DIF neutrino events, and , respectively, in a beam on-off excess of events. The neutrino background was carefully evaluated both from independent measurements and calculations. This excess was attributed to the appearance of from oscillations and corresponds to the oscillation probability .

The KARMEN experiment used a technique similar to the LSND experiment and observed no beam excess [5]. The signatures of the 15 candidate events were found to be in good agreement with those from the () expected background events.
Let us explain the discrepancy between the results of these two experiments in terms of the production and radiative decay of a heavy neutrino, as illustrated in Fig.1. The location of the LSND and KARMEN detectors relative to their proton beam directions is schematically illustrated in Fig. 3. The energy distributions of the ’s from DIF in the LSND (from Ref.[30]) and KARMEN (simulated) detectors are shown in Fig.4. The distributions are normalized to a common maximum value in order to place them on a similar scale. One can see that the spectra are quite different. The LSND distribution is peaked at about 55 MeV; it has an average energy 100 MeV, and a high energy tail up to 300 MeV, while the maximum of the energy spectrum in KARMEN, which is located at 90o with respect to the beam, is MeV and the whole spectrum is well below 50 MeV. For a heavy neutrino with a mass of MeV, the production threshold in the reaction is 58.6 MeV, as shown in Fig.4. Here we assume that the production is accompanied by the emission of a recoil neutron and the isotope 11C in the ground state.
Thus, our interpretation of the excess of events observed by LSND is the following. Positive pions generated in proton collisions produce the flux of ’s from the DIF in the target. The excess events are generated in the LSND detector by these ’s through the reaction
| (11) |
with the emission of a recoil neutron and a heavy neutrino, and not by ’s from muon decays at rest via oscillations, as was originally assumed [3]. The ’s decay promptly into a photon and a light neutrino, with the subsequent Compton scattering or pair conversion of the decay photon in the detector fiducial volume. The former process dominates for photon energies below the critical energy of the LSND liquid of 85 MeV. In the laboratory system, the differential Compton scattering cross section has a sharp peak in the forward direction, and the vast majority of events are in a narrow cone of mrad, for MeV. For the photon conversion into an pair, its opening angle is mrad for MeV, which is too small to be resolved in LSND into two separate Cherenkov rings (here, are the electron mass and the photon energy, respectively).

Therefore, the excess events are originated from photons of the reaction (11) detected in coincidence with the associated 2.2 MeV tag from the neutron capture and misidentified as single electron events. In the KARMEN experiment, ’s from decays in flight cannot produce heavy neutrinos accompanied by the emission of a neutron because their energy is below the production threshold, see Fig. 4. Therefore, KARMEN should observe no excess of -like events. Note that the maximum energy of ’s from muon DAR is about 50 MeV and is also less than the energy threshold of 58.6 MeV for the production of the 40 MeV and a recoil neutron in collisions with the carbon nucleus.
To make quantitative estimates, we performed simplified simulations of the production in the inclusive reaction (11) with the emission of a recoil neutron and followed by the decay , as shown in Fig. 1, in the LSND detector. In these simulations we used the integral DIF energy spectrum, shown in Fig. 4, which was calculated in [30]. There is also a contribution from DIF events, which, however, is small and is neglected at the level of accuracy of our analysis. The energy of most of the ’s is well above the threshold for the production of 40-80 MeV ’s in the LSND detector. Once produced, the ’s decay at an average distance from the primary vertex. Since in the LSND experiment the average kinetic energy is MeV and ’s would decay over the average distance of 5 m from the primary vertex, the sensitivity is restricted to the lifetimes s for the masses MeV. The decay photon absorption occurs at a distance of the order of the Compton scattering length ( cm ) of the LSND liquid from the decay point which is much less than the detector size.


The total cross section of the reaction for 100% mixing is estimated by extrapolating the available cross section for the reaction ( cm2) calculated for the incident neutrino energy of 150 MeV [31, 32] to the neutrino energies in the range 50-250 MeV (see Fig. 4), and by taking into account the corresponding phase space factor. Note that the average energy for the spectrum above the production threshold of the 40 MeV is 110 MeV. The flux-averaged cross section is found to be cm2 for the production of the 40 MeV with the uncertainty taken to be 40% due to accuracy of the extrapolation procedure.
The crucial test of the oscillation hypothesis in the LSND experiment was to check whether there is an excess of events with more than one correlated 2.2 MeV . If the excess of events is indeed due to the reaction , then there should be no excess with more than one correlated because the recoil neutron is too low in energy ( MeV) to knock out additional neutrons. If, on the other hand, the excess involves higher energy neutrons, which can break the 12C nucleus and produce another neutron(s), then one would expect an excess of events with correlated . As the LSND did not observe many of such (latter) events [3], the energy spectrum of the ejected neutrons is an important characteristic of the reaction (11), as it affects the likelihood ratio and the number of correlated ’s. The flux-averaged cross sections and particle emission spectra in the LSND detector are predicted quit well for the charge current reactions from calculations performed in different theoretical frameworks; see e.g. Ref.[33] and references therein. However, much less is known for the induced neutral-current reactions in the detector. Therefore, we performed simulations of the recoil neutron kinetic energy distributions of in the reaction (11) by using the Fermi gas nuclei model, but without taking into account nuclear effects, such as the neutron re-scattering in nuclear matter and the carbon nucleus level structure. The Fermi momentum and the neutron binding energy for the nucleus are taken to be MeV and 18 MeV, respectively.

To evaluate uncertainties of our calculations we have compared our results with others which take into account nuclear effects [31]-[35]. Figure5 shows the distribution of the kinetic energy of neutrons ejected in the reaction and the analogous spectrum from Ref.[31], both calculated for the massless case for the incident neutrino energy of 150 MeV without nucleon binding energy corrections. One can see that our simulations reproduce the more precise results quite reasonably. The comparison of the calculations results in an uncertainty of about 20%-30%. Figure5 also shows the neutron energy distribution calculated for the reaction (11) for the mass of 60 MeV. It is seen that in this case the neutron energy spectrum is shifted towards lower energies.


Having this reasonable agreement in mind, we have performed calculations of the LSND flux-averaged distributions of the kinetic energy of knockout neutrons produced in the reaction (11). The results are shown in Fig.6 for the masses of 40 and 80 MeV. The average energies of the recoil neutrons are, respectively, 14 and 16 MeV. To decrease this energy to the typical energy of neutrons from the reaction ( MeV) takes about neutron collisions in mineral oil. Taking into account that the average collision length is cm results in a displacement of the neutron from the primary vertex of the order cm, which is significantly less than the value of cm for the neutrons from the reaction , defined mainly by the reconstruction accuracy [3]. Thus, one would expect no significant contribution to the likelihood ratio due to this effect. The energy decreasing time ns is also much less than the neutron capture time of 186 s.
As discussed above, the neutrons from the higher energy tail of the distribution shown in Fig. 6 can knock out an additional neutron(s), resulting in the observation in LSND of a number of events with more than one correlated capture ’s. To estimate this number, we use the results of the measurement of the neutron yield from the 70 MeV proton beam collisions with a thick graphite target [36], assuming that this yield is approximatelly the same for the neutron induced reaction of the same energy. The measured number of neutrons per proton is found to be . The neutron energy threshold to produce a secondary neutron in collisions with a nucleus is about 20 MeV. The fraction of neutrons with energy greater than 20 MeV in the distribution shown in Fig.6, is depending on the value of the mass. Taking this into account, we find that the total fraction of events with more than one correlated gamma from the flux-averaged reaction (11) is , which can be neglected.
Note that in our calculations we overestimate the fraction of high energy neutrons. The calculations of the reaction performed in Ref.[34] show that the cross section and recoil neutron energy spectrum are essentially dependent on the details of the level structure for neutron energies below 30 MeV. The consideration of such an effect, including the rescattering of outgoing neutrons, is quite important for the emission spectrum, as it will shift the spectrum to lower neutron energies. Therefore, we may assume, that the fraction of events with correlated is even less than 2%, or 0.6 events. This number should be compared with the background of such events expected in the LSND experiment at the 2 level [3]. Thus, our estimate is compatible with the (approximately zero) number of events with correlated ’s observed by LSND for the full MeV energy region.


A cross-check for the fraction of neutron emitted in the reaction (11) can be obtained from the comparison of results obtained for the inclusive reaction in this work, in Ref.[33], and by the LSND Collaboration [30]. In this reaction the presence of a muon and a neutron is established by detection of the Cherenkov ring and of the ray from the neutron’s capture as described in detail in Ref. [37]. We found that the fraction of events accompanied by the emission of a recoil neutron is 81%. This number has to be compared with the fractions of 79 % predicted from the calculations in [33], and % obtained by LSND [30]. The agreement is quite good.
In Fig.7 the energy distributions of photons from the radiative decay of heavy neutrinos produced in the reaction calculated for several masses from 40 to 80 MeV and for three of the most interesting cases of the decay asymmetry parameter, and , are shown. The calculations are performed with no photon efficiency and no binding energy corrections included. One can see that for the Dirac case with , the simulated events are mainly distributed in the narrow region MeV. The fraction of photons in this region varies from 0.86 to 0.77 for a mass from 40 to 80 MeV, respectively. The remaining events are distributed over the region MeV, where they can be hidden by the low statistics. For the and cases, the fraction of photon events in the region MeV varies from 0.71 to 0.57; and from 0.54 to 0.46, respectively. Further, we will discuss mainly the cases and , because for the case the fraction of events above 60 MeV is too high compared to the LSND observations.
The visible energy distributions expected from a combination of the events plus neutrino background in the LSND detector [3] are shown in Figs. 8,9 for the energy range MeV. The spectra are calculated for 40 and 70 MeV, , and the lifetime s by taking into account the decay photon efficiency and the neutron binding energy corrections. The photon efficiency has been estimated by a simple Monte Carlo calculation as a fraction of photons with energies MeV in the detector fiducial volume times the detection efficiency, which is taken to be essentially constant, , for this energy range. The distribution expected from a combination of neutrino background plus neutrino oscillations at low [3] is also shown for comparison. The clean experimental sample of the oscillation candidate events shown in Fig.’s 8,9 is obtained by enforcing strongly correlated gammas with the cut . In this case the beam on-off excess is events while the estimated neutrino background is only resulting in a total excess of events [3]. The analogous distributions for , the cosine of the angle between the incident neutrino beam and decay photon momenta, for events with MeV are shown in Figs. 10, 11. The distributions are obtained assuming that the energy deposited by the decay photon is misreconstructed as the energy from a single electron track.
Simulations are in reasonable agreement with the experimental distributions. For instance, for the distribution shown in Fig.8 for MeV, the comparison with the LSND data yields a of 3.6 for 3 DF, corresponding to 34% C.L. The best fit results suggest that the mass is in the region MeV and the lifetime is s. However, to avoid the production of ’s in the KARMEN experiment, the low mass limit is set to 40 MeV. The mass upper bound is set to 80 MeV because for higher masses the production of in LSND is suppressed by the phase space factor. The simulations showed that the shape of the distribution is sensitive to the choice of the mass : the higher the mass, the harder the visible energy spectrum.
Before the calculation of the required mixing strength , let us estimate, for a cross-check, the number of events expected for oscillations followed by scattering in the LSND detector. This number could be estimated as
| (12) |
where is the number of free protons in the LSND fiducial volume, is the neutrino flux (see Table 1), is the oscillation probability averaged over the incident neutrino energy, is the cross section averaged over the entire energy range, is the fraction of events in the energy range MeV, and is the average positron reconstruction efficiency [3]. Using the above values, we found that the LSND experiment should detect an excess of events if the oscillation probability is . This value is in a good agreement with the number of events quoted in Ref.[3].
Consider now the case of heavy neutrino. The estimate of the mixing parameter was performed by using the following relations. For a given flux of muon neutrinos, , the expected number of the decays events in the LSND detector is given by
| (13) |
where is the number of excess events observed in the 1993-1998 data sample (with errors combined in quadrature), is the number of carbon nuclear in the LSND fiducial volume, is the cross-section for the reaction with the emission of a recoil neutron for the massless case, is the fraction of events in the energy range MeV, is the fraction of events with the emission of a recoil neutron in reaction (11), is the probability for the decay within the detector fiducial volume, is the probability of the decay photon absorption in the detector, and is the overall efficiency for decay photon detection. In Eq.(13) the number of heavy neutrinos produced is proportional to the product of the cross section, the mixing , and the phase space factor , which takes into account the threshold effect due to the heavy neutrino mass. The value of the total DIF flux ( see Table 1), the number of reconstructed -like [3] and events [30] in the detector were used for cross checks and normalization. The flux averaged cross section is cm2. The probability of the heavy neutrino to decay radiatively in the fiducial volume at a distance from the primary vertex is given by
| (14) |
where the last term is the branching fraction . Assuming that almost all decays occur inside the fiducial volume of the detector, we estimate the to be in the range
| (15) |
This result is mainly defined by the uncertainty on the number of excess events and is valid for the mass region
| (16) |
and the lifetime
| (17) |
III.2 The LSND signal of oscillations
During the first three years of LSND data taking, the target area of the LANSCE accelerator consisted of a 30 cm long water target located 1 m upstream of the beam stop. This configuration enhanced the probability of pion decay in flight, allowing LSND to search for oscillations using with energy above 60 MeV. In this case, one expects to observe an excess of events from the reaction above the expected backgrounds. This reaction has only one signature (a prompt signal), but the higher energy and the longer track of the events allow good electron identification and measuring its direction. In this search LSND has observed 40 events to be compared with events from cosmic ray background and events from machine-related (neutrino-induced) processes [38]. The excess of events corresponds to a oscillation probability of , consistent with the value found from the study of the reaction below 60 MeV.
The number of the events that would be observed by LSND after applying the high energy cut MeV, is about events depending on the mass and mixing obtained from the combined analysis, as shown below in Sec.V. For example, out of 10 events, 5 ( 2) events are from the reaction occurring on protons (neutrons) of the nucleus, which is not expected to produce free neutrons, and 3 events are from the reaction (11) with a recoil neutron production, which is identified by the presence of the 2.2 MeV photon from the capture reaction. Thus, the ratio of the number of excess events with and without photon tag is 3 : 7, which is in agreement within errors with the observed numbers of events in the LSND experiment [38].
IV The MiniBooNe anomalies
The MiniBooNE detector is described in detail in Ref. [39]. It uses an almost pure beam originated from the decays in flight, which are generated by 8 GeV protons from the FNAL booster. The detector consists of a target, which is a 12.2 m diameter sphere filled with 800 t of mineral oil, surrounded by an outer veto region. The Cherenkov light rings generated by muon, electron and converted photon tracks are used for the reconstruction of the events. The resolutions reached on the vertex position, the outgoing particle direction and the visible energy are 20 cm, 4o, and 12%, respectively for electrons [40]. The beam is peaked around MeV, has a mean energy of MeV and a high energy tail up to 3 GeV [41].
Below, we consider the MiniBooNE anomalous event excess observed in and data and the interpretation of these results in terms of the heavy neutrino decay.


IV.1 Excess of events in data
An excess of 128.8 electronlike events has been observed in the data accumulated with protons on target. For the following discussion several distinctive features of the excess events are of importance [8]: a) the excess is observed for single track events, originating either from an electron, or from a photon converted into a pair with a typical opening angle (for MeV), which is too small to be resolved into two separate Cherenkov rings (here, are the electron mass and the pair energy); b) the reconstructed neutrino energy is in the range MeV, while there is no significant excess for the region MeV (the variable is calculated under the assumption that the observed electron track originates from interaction); c) the visible energy is in the narrow region MeV for events with MeV; and d) the angular distribution of the excess events with respect to the incident neutrino direction is wide and consistent with the shape expected from interactions.


To satisfy the criteria a)-d), we propose that the excess events are originated from the decay of the heavy neutrino considered in Sec.III. The ’s are produced by mixing in neutral-current interactions and depositing their energy via the visible decay mode , as shown in Fig.1, with the subsequent conversion of the decay photon into the pair in the MiniBooNE target. To make a quantitative estimate, we performed simplified simulations of the production and decay processes shown in Fig.1. In these simulations we used a energy spectrum parametrized from the reconstructed events [41]. Since in the MiniBooNE experiment the ’s have higher energies and decay over an average distance of 5 m from the production vertex, the sensitivity in the LSND mass range of Eq.(16) is restricted to the lifetimes
| (18) |
to be compared with (17).
In Figs.12-17 the distributions of the kinematic variables and for the events are shown for and 70 MeV and s. These distributions were obtained assuming that the pair from the converted photon is misreconstructed as a single track from the reaction. Simulations are in reasonable agreement with the experimental distributions. For instance, for the distributions shown in Figs.12,13, for the case , the comparison with MiniBooNE data yields a of 7.1 (7.5) for 8 DF corresponding to 53% () C.L. for MeV and s. The simulated excess events, shown in Figs.14,15, are mainly distributed in the narrow region MeV. Their fraction in this region is . The remaining events are distributed over the region MeV, where they can be hidden by the low statistics.


The simulations show that the shape of the and distributions is sensitive to the choice of the mass: the heavier the , the harder the visible energy spectrum. The best fit results suggest that the mass is in the region MeV and the lifetime is in the range s, respectively; see also [13].
The estimate of the mixing parameter was performed by using a relation similar to Eq.(13). The flux was estimated from the expected number of the events times the mixing , taking into account the threshold effect due to the heavy neutrino mass. The total number of reconstructed events in the detector [41] was used for normalization. The probability of the heavy neutrino to decay radiatively in the fiducial volume at a distance from the primary vertex is given by Eq.(14), assuming the branching fraction . Taking into account the ratio 0.43, and the number of events observed [7, 8] and assuming that almost all decays occur inside the fiducial volume of the detector, we estimate the to be in the range
| (19) |
This result is mainly defined by the uncertainty on the number of excess events. Equation(19) is valid for the mass region MeV favored by the LSND data.
IV.2 Excess of events in data


Recently, the MiniBooNE experiment has reported results from a search for oscillations using a data sample corresponding to protons on target [9]. An excess of 43.2 electronlike events is observed which, when constrained by the observed events, has a probability for consistency with the background-only hypothesis of 0.5% in the oscillation-sensitive energy range of MeV. The data are consistent with oscillations in the 0.1 eV range and with the evidence for antineutrino oscillations from the LSND. Note, that the low statistics antineutrino data collected by the MiniBooNe experiment seem to show no low-energy excess [42].
Similar to the neutrino data [8]: a) the excess is observed for single track events, originating either from an electron, or from a photon converted into an pair ; b) the reconstructed neutrino energy is in the wider range MeV, and there is also an excess for the region MeV. The variable is calculated under the assumption that the observed electron track originates from a interaction; c) compare to the data the visible energy is in the wider range MeV for events with MeV; and d) the angular distribution of the excess events with respect to the incident neutrino direction is wide and consistent with the shape expected from interactions. To satisfy the criteria a)-d), we propose again that the excess events are originated from the decay of the heavy neutrino considered in the previous sections. The ’s are produced by mixing in interactions and deposit their energy via the radiative decay mode, as shown in Fig.1, with the subsequent conversion of the decay photon into an pair in the MiniBooNE target.


For simulations we used a energy spectrum parametrized from the reconstructed events [41]. Note that the antineutrino energy distribution has a maximum at MeV and an average energy of about 600 MeV.
In Figs.18-23 the distributions of the kinematic variables and for the events are shown for and 70 MeV and s. These distributions were obtained assuming that the pair from the converted photon is misreconstructed as a single track from the reaction. In this calculation we assume that the angular distribution of photons in the rest frame has the same asymmetry as for the case due to conservation; see Sec.II.
Simulations are in reasonable agreement with the experimental distributions. For instance, for the -distributions shown in Figs.18,19 for the Dirac case with , the comparison with MiniBooNE data yields a of 8.2 (8.3) for 9 DF corresponding to 47% () C.L. for MeV and s. The distributions shown in Figs. 20,21 are also in reasonable agreement with the experiment. For the case , the comparison with data yields a of 9.5 (8.5) for 5 DF corresponding to 10% () C.L. for MeV and s. The events are mainly distributed in the region MeV, where their fraction is . The remaining events are distributed over the region MeV, where the observed number of events is found to be consistent with the expected one.
The analysis of these data within the framework discussed above suggests that a smaller excess of events is observed mainly due to the lower energy and cross section. The estimate of the mixing parameter was performed by using relation similar to Eq.(13), assuming the branching fraction . The flux was estimated from the expected number of events times the mixing , taking into account the phase space factor due to the heavy neutrino mass. The total number of 27,771 reconstructed events in the detector [9] was used for normalization. Taking into account the ratio 0.41 and the total number of events observed, and assuming that almost all decays occur inside the fiducial volume of the detector, we estimate the to be in the range
| (20) |
which is consistent with the mixing from Eq.(15). This result is mainly defined by the uncertainty in the number of excess events. Equation(20) is valid for the mass region MeV, which includes the region favored by the LSND data.


V Results from the LSND and MiniBooNE data and properties of the heavy neutrino
To obtain the combined regions in the parameter space, we have analyzed both, the LSND and MiniBooNe data simultaneously. The and distributions from LSND, and the , , and distributions from MiniBooNE were used for comparison with the corresponding simulated distributions from the decay to constrain the mixing strength and heavy neutrino mass. The shape of the simulated distributions is defined by the mass ( and type) of the , while the mixing strength is defined mainly by the overall normalization of distributions to the number of excess events observed in the experiments. The analysis includes the following constraints: i) the number of excess events can vary within the 2 range, ii) the lifetime has to be less than s, iii) the should be heavier than 40 MeV to avoid its production in the KARMEN experiment; and iv) the number of excess events in the LSND detector in the energy region MeV with a recoil neutron should be 10 events. The latter constrain came from the upper limit on the number of events with recoil neutrons observed by LSND in this energy region [38].
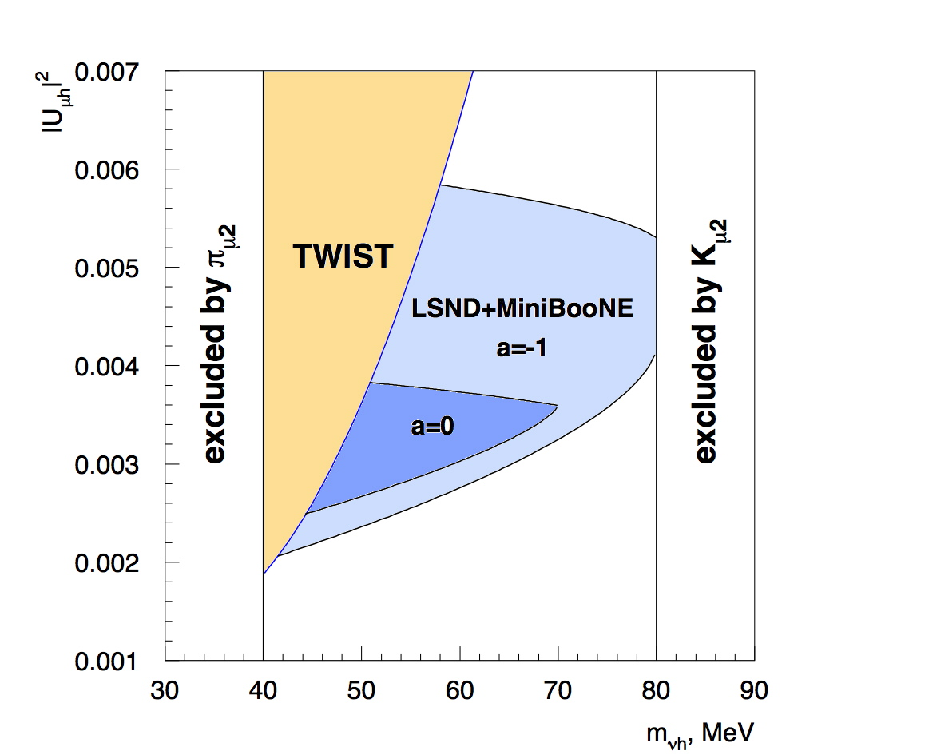
The summary results are shown in Fig.24 together with the constrains from the experiments and the limit obtained from the recent results of the TWIST experiment on precision measurements of the Michel spectrum in muon decay, see Sec.VI. The fit results suggest that the mass is in the region MeV for the Dirac with an asymmetry parameter , and in the region MeV for the case . The contribution from the MiniBooNE data is smallest for the whole mass range. As expected, for both cases the main contributions to are from the MiniBooNE data. For higher masses, preferred by the MiniBooNE data, the region of allowed moves towards smaller values , while it is cut by the LSND constrain iv).
The LSND results strongly restrict the allowed mass region and exclude solutions with MeV, which are favored by the MiniBooNE data. The analysis gives a 14% probability for compatibility between the LSND and MiniBooNE data and the interpretation, demonstrating a reasonable level of agreement.
As already mentioned in Sec. II, the angular and energy distributions of decay photons are sensitive to the type of the heavy neutrino. The analysis shows that better fit results can be obtained provided that the ’s produced in the LSND and MiniBooNe experiments by the muon neutrino decay radiatively as a left-handed Dirac neutrino with the asymmetry parameter , while the ’s produced by the muon antineutrinos decay as a right-handed Dirac neutrino with the asymmetry parameter . The positive sign of the asymmetry coefficient is preferred by the analysis of MiniBooNE data, while the negative sign provides a better fit to the distributions from LSND and MiniBooNE data. If the ’s with such exotic properties exist, that would mean that the decay is not conserving [43, 44].
VI Limits on and
One might reasonably ask if the mixing strength as large as the one shown in Fig.24 is consistent with the results of previous searches for the MeV ’s [45]. Below we discuss the most stringent limits which came from the meson [46] - [49] and muon decays [50]-[53], neutrino scattering experiments [54], searches at the CERN LEP [55, 56], and also from cosmology, astrophysics and atmospheric neutrino experiments [57]-[61]. Finally, the limits on the transition magnetic moment are also discussed.
VI.1 Limits from decays
It is well known that heavy neutrino in the mass range 400 MeV can be effectively probed through the two body decays of charged kaons [15]. The meson, which normally decays into a and a , might instead decay into a and a . The experimental signature of the presence of the decay is a peak in the muon energy distribution below the normal one from the ordinary decay at the energy
| (21) |
The most stringent current experimental limits on for the mass region below 400 MeV, are summarized in Fig. 25 [45]; for a recent review see [26, 27]. One can see, that the limit for the mass region around 100 MeV, derived from a search for the at KEK [49], is . Surprisingly, the neighboring () region of parameters (15),(16) favorable for the explanation of the LSND and MiniBooNE results remains unconstrained. The reason for that is because the in the mass range of MeV is outside of the kinematical limits for decays and is not accessible in decay experiments due to experimental resolutions and a high background level. For example, to resolve the muon peak of 234 MeV/c from the 40 MeV and the main peak of 236 MeV/c, a muon momentum resolution better than 1% is required. Another reason is related to the and decays which produce a continuous background to the muon momentum distribution below the main peak and essentially constrains the sensitivity of the search for the mass range MeV again due to the requirement of a very high experimental resolution. Let us consider this in detail. In the most sensitive experiment performed at KEK [49], degraded ’s were stopped and decayed in the scintillator target. Charged particles from decays were momentum analyzed by a magnetic spectrometer. To achieve high sensitivity to small signals, the main background decay modes, and , were vetoed by using an almost hermetic (92% of 4) low-energy threshold ( MeV) NaI calorimeter, surrounding the kaon decay target. The veto efficiency for the decay mode was quite high, better than 99%, thanks to the emission of two photons. The decay was difficult to suppress, and about 30% of photons from this decay mode were undetected. The reasons for this are the following: i) the low-energy photons are preferably emitted along the decay muon momentum direction, so they escape undetected; ii) the photo-nuclear absorption cross section is high for photon energies 50 MeV; and iii) there is an absorption of decay photons due to the presence of a dead material in the vicinity of the target. These effects results in a high background level which significantly decreases the sensitivity for the masses below 80 MeV, as one can see from Fig. 25.

Let us now show that taking into account the dominance of the decay and the relatively short lifetime makes existing experimental bounds even weaker. Indeed, in these searches it was typically assumed that the is a relatively long-lived particle, i.e. , where cm is the typical size of the target region. However, if the decay is dominant and the heavy neutrino is a short-lived particle, the would decay presumably in the vicinity of the target. In this case, the decay photon would be vetoed by the calorimeter, and the event would be rejected. An estimate shows that for a lifetime, as short as s more than 95% of heavy neutrinos would decay in the target region or inside the calorimeter of the experiment [49], producing a photon with an energy well above the veto energy threshold. Because of this self-veto effect, the limit for the mass around 80 MeV, could be worsened by more than an order of magnitude, and thus, would be in the region close to values from (15). Thus, it would be important to perform an ”open mind” search for heavy neutrino in a wider mass range, including the region around 80 MeV.
VI.2 Muon decay constraints
If a heavy neutrino with mixing into in the range of Eq.(15) exists, it would notably change the shape of the Michel spectrum of the ordinary muon decay, which is well predicted in the standard model. This gives the possibility of using the results of precision measurements of the Michel spectrum in the ordinary muon decay in order to probe the possible existence of a heavy neutrino [16]. The relatively free of theoretical uncertainties limit on mixing for masses in the range from 30 to 70 MeV was originally set in [13, 49] by using results of the parameter measurement by Derenzo [53]. Following Shrock [16], we use the idea that an admixture of a heavy neutrino to the Michel spectrum could significantly alter the parameter, resulting in an effective parameter that is different from the canonical value . Hence, one can extract limits on the mixing from comparison of the measured ( ) and effective values by requiring , where is the error of the measurements. Figure 26 shows the dependency of the effective parameter as a function of for the region of interest from 40 to 80 MeV, for several values of obtained by the fit of the Michel spectrum. The two sigma bands from the measurement of the parameter by Derenzo [53], , and from the recently reported precision measurements by the TWIST Collaboration [50], , or with all errors combined in quadrature, are also shown. The theoretical expressions for the mixing of heavy Dirac neutrinos in muon decay can be found in [16], and, with radiative corrections included, in [51]. Our new limit shown in Fig. 24 is derived for the masses in the range from 40 to 80 MeV by using the results of the TWIST experiment. For very large masses the limit is less restrictive because the contribution is highly suppressed. Comparison of the bounds obtained in [16, 52] and in the present work by using the results of the measurements of the parameter by Derenzo [53] shows good agreement.

VI.3 Bounds from neutrino scattering experiments
Next we consider the neutrino experiments that searched for decays. The direct searches for the radiative decay were performed for the mass region MeV [45]. Others experiments searched for heavy neutrino decaying into charged particles in the final state, such as e.g. . None of these experiments has reported a bound on the mixing strength , or on the combination , for the radiative heavy neutrino decay. The experimental signature for the decaying into charged particles is quite clean. The selection of two tracks originating from a common vertex with nonzero invariant mass makes these searches almost background-free. In contrast, to search for an excess of a single converted photons from the radiative neutrino decay is more difficult. At high energies the background level from the decays and bremsstrahlung photons is high. The uniqueness of the LSND and MiniBooNE experiments is that they run at low energies when the production of the ’s is still possible and the background level is relatively small due to the high fraction of events used for the production of ’s.
The best limit for the mass region MeV was derived from a search for decays in the PS191 beam dump experiment at CERN [54]. It was assumed that this decay mode is dominant and that the is a relatively long-lived particle, i.e , where m is the distance between the target and the detector. Other decay modes with charged particles in the final state, such e.g. as are forbidden by the energy conservation. The PS191 detector consist of a 12 m long decay volume, eight chambers located inside the volume to detect charged tracks and followed by a calorimeter. The decay volume was essentially an empty region filled with helium to reduced the number of ordinary neutrino interactions down to events, with a total amount of dead material around 3.6 g/cm2. The events searched for in the experiment were requested to consist of two tracks originating from a common vertex in the ”vacuum” part of the decay volume and giving rise to at least one shower in the calorimeter.
Consider now our case, e.g. with , MeV and the lifetime s. Because of the larger mixing the flux from the decays in flight would increase by a factor . However, several new suppression factors have to be taken into account. First, the flux would decrease by a factor due to the more rapid decay of the ’s. Second, the experimental signature for the decay would be an pair from the conversion of the decay photon in the decay region. However, the opening angle of the pair is rad, which is too small to be resolved in the detector, and thus the event would be misidentified as a single track event. Such event would be rejected. The rejection factor is estimated to be . Third, the average probability of the photon conversion with the vertex located in the low density decay region ( not in a chamber) is as small as . Finally, the total number of signal events in PS191 would decrease by a factor of more than compared to the number of events expected for a long-lived ’s produced and decaying through the mixing . Note, that for the above values of , and , the branching fraction of the direct decay into the final state is found to be [26], which is also small enough to produce a detectable excess of events in the PS191 experiment. In this estimate the average momentum is GeV, the decay region length is m and the typical photon energy is 2 GeV [54].
VI.4 LEP constraints
Next we consider bounds from LEP experiments [45]. For the mass region around 50 MeV, the model-independent limit from the searches for the decay is , (see e.g. [55]) which is compatible with Eq.(15). Direct searches for radiative decays of an excited neutrino produced in decays have also been performed [45]. The best limit from ALEPH is [56]
| (22) |
As the experimental signatures for the and decays are the same, we will use this bound for comparison. The number of expected events in ALEPH is proportional to , with m and GeV. Taking into account and using (22), we find
| (23) |
For the mass range (16) using Eq.(15) results in
| (24) |
which is consistent with (17).
VI.5 Bounds from cosmology, astrophysics, and the Super-K experiment
Although a detailed analysis of the cosmological and astrophysical constrains on the properties of heavy sterile neutrinos is beyond the scope of this work, let us briefly discuss some of them. The most stringent bounds for the ’s in the MeV mass range were obtained from the primordial nucleosynthesis and SN1987A considerations [57, 58, 59, 60]. These limits are typically valid under assumption that the is a relatively long-lived particle with the dominant decay mode into an active neutrino () and an pair. In this case, for the required mass range 40 - 80 MeV and mixing , the lifetime estimated from Eq.(10) is s, which is about 7 orders of magnitude longer compared to the one required by (18).
Another independent constrain on can be set based on the nonobservation of atmospheric sterile neutrino decays by the Super-K experiment [60]. In this work it is assumed that heavy neutrinos could be copiously produced in the Earth’s atmosphere and could decay inside the Super-K detector, generating an excess event rate [60]. The requirement for this rate to not exceed the rate of events observed by the experiment results in upper limits on mixing strength for the mass region MeV (see Fig. 6 in Ref.[60]). In these calculations it is assumed that the typical Lorentz factor of heavy neutrinos is . Taking into account (18) results in a decay length of the order of m. Assuming an average distance between the production region and the Super-K detector of km gives a very high flux suppression factor of . Thus, one can see that the stringent bounds from cosmology, astrophysics, and the Super-K experiment are evaded due to the short lifetime of the in accordance with (18); for more detailed discussions of the bounds on heavy neutrinos from cosmology and astrophysics, see e.g. [57, 61].
VI.6 Limits on
For the light neutrino mass using Eq.(9) the lifetime due to a transition moment is given by
| (25) |
The requirement (18) for the decays to occur mostly inside the MiniBooNE fiducial volume results in
| (26) |
For MeV and the radiative decay is dominant, . Direct searches for heavy neutrino decays were performed by many experiments [45]. However, none of these experiments has reported a bound on the mixing strength or on the product , for the radiative decays of heavy neutrino in the mass region 40-80 MeV. The mixing would result in a contribution to the effective magnetic moment, , due to the nonzero magnetic moment. This contribution is below the best direct LSND experimental limit derived from the muon neutrino-electron scattering [62]. However, in this particular case the LSND limit is not directly applicable to the magnetic moment as the limit was obtained for the DAR , which, as discussed in Sec. II, cannot produce in the LSND experiment in scattering, due to its heavy mass.
Consider now again bounds from LEP experiments [45]. For the mass region around 50 MeV, the model-independent limit from the searches for the decay is , (see e.g. [55]) which is compatible with Eq.(15). Consider the constraint (22) from direct searches for radiative decays of an excited neutrino produced in decays [56]. The number of expected events in ALEPH is proportional to , with m and GeV. Taking into account and using Eq.(9), we find
| (27) |
Using Eq.(15) results in , which is consistent with Eq.(26).
The limit on the between the and the has been obtained in Ref.[63], based on the idea of the Primakoff conversion of the muon neutrino into a heavy neutrino in the external Coulomb field of a nucleus , with the subsequent decay. By using the results from the NOMAD experiment [64], a model-independent bound was set for the masses around 50 MeV (see Table 1 and Fig.2 in Ref.[63]), which is also consistent with Eq.(26). Values of larger than for the MeV could be obtained e.g. in the framework of the Zee model [22].
VII Proposed searches for heavy neutrino
In this section we propose experimental searches for heavy neutrinos in the decay and muon neutrino interactions. The sensitivity of the proposed experiments is expected to cover the region of the LSND-MiniBooNE parameter space shown in Fig.24. A discussion of the possible search for heavy neutrino in muon decays will be reported elsewhere.
VII.1 Search for the in decays
As discussed in Sec. VI, the existence of heavy neutrinos with masses 400 MeV can be effectively probed by searching for a peak from the in two body decays of charged kaons [15]. Depending on the experimental method, one could also search for a peak in the missing mass distribution corresponding to the mass of the heavy neutrino. The number of events in the peak is defined by the mixing and by the phase space and helicity factors which depend on the mass [15]. For the mass interval MeV the chirality-flip is mostly due to the sterile neutrino mass which results in
| (28) |
Using Eq. (15), we find that the branching fraction of is in the experimentally accessible range:
| (29) |
for heavy neutrino masses in the range 40 - 80 MeV. There are two advantages to searching for the in the decay peak experiments. First, an observation of a peak in the muon and/or the missing mass spectra in decays gives unambiguous evidence for the existence of heavy neutrinos. Second, the expected number of signal events occurring in a detector, and hence the sensitivity of the search, is , as it follows from (28). In neutrino scattering experiments the decay signal rate is either proportional to , or, if the dominant decay is , proportional to and thus, is more suppressed. Here, the first term appears through the heavy neutrino production in a target, and the second term, or , through the heavy neutrino decay in the detector. Note that in our particular case the sensitivity of the LSND and MiniBooNE experiments is because the is a short-lived particle due to the large value of , which decays in the detector target volume with the probability .
As discussed in Sec.VI, the major physics background to the experiments searching for the peak in decays at rest is the radiative kaon decay which has a branching fraction of about 1.5 % for photon energy above 10 MeV [45]. This background results in an admixture of a continuous spectrum to the muon momentum distribution below the main peak and essentially constrains the sensitivity of the search for the mass range MeV. To improve the sensitivity, this background decay mode has to be suppressed by increasing the detection efficiency of the decay photons. Experimentally, improvement of the photon efficiency for the searches with the decays at rest is difficult due to the limitation factors discussed in Sec.VI.
Here, we propose the use of decays in flight to improve the sensitivity against this background source. A substantial increase in the detection efficiency of radiative photons could be obtained by using the decays in flight at high energies. In this case, the vast majority of decay photons would be within the geometrical acceptance of the detector because they are distributed within a narrow cone with the maximal photon angle of the order mrad for a kaon energy of GeV, as schematically illustrated in Fig. 27A. Thus, the detection efficiency of high energy decay photons from the decay in an electromagnetic calorimeter is expected to be almost 100%. If the is a relatively long-lived particle, with a lifetime s, then it would rarely decay in the experiment, as the average decay length of m is much bigger than the typical length of a decay volume 100 m. The detection of a muon and a photon in the final state would unambiguously signal the detection of the radiative decay, as shown in Fig. 27A, or another background decay mode. This would reduce the background significantly and allow the measurement of the muon energy distribution with a higher sensitivity.

If the is a short-lived particle, with a lifetime [see Eq.(24)] and a corresponding decay length of about 30 m, then the detection of a muon and a photon in the final state would mean either the detection of a background process or the detection of the signal from the decay , as shown in Fig. 27B. In this case, one could still suppress the background by rejection of the observed events at the cost of the signal efficiency loss. To avoid this reduction, one could try to identify signal events by using the fact that the observed photon is originated from a secondary vertex, which is displaced from the primary one by a large distance, provided that precise measurements of the photon directionality can be done.
A good example of an experiment where the proposed search could be performed is the NA-62 at CERN [65]. The experiment is running at a kaon energy of 74 GeV. The detector is well equipped to identify and measure the momenta/energy and directions of the charged particles. The photons are precisely measured with a LXe electromagnetic calorimeter. To evade the KEK limit for the region MeV the lifetime is required to be in a slightly more restricted range s. For example, for s the most of the ’s would decay in the decay volume [65], thus producing a veto signal in the LXe calorimeter. Other experiments capable of searching for the decay with their existing data are the E787 and its upgrade, the E949, at BNL [66], or ISTAR+ at IHEP [67]. The former is equipped with an almost veto electromagnetic calorimeter, allowing good rejection of photons from background and decays.
VII.2 Search for the decay in neutrino interactions
As discussed above, in order to search for an excess of single converted photons from the radiative neutrino decay in high energy neutrino interactions the background, mainly from the decays of ’s and bremsstrahlung photons produced either in the primary vertex or in the secondary particles interactions has to be eliminated. To suppress the background and to detect a clean and convincing sample of converted decay photons one can perform a neutrino ”beam dump” experiment the main idea of which is illustrated in Fig. 28. A neutrino detector is subdivided into two parts. The first part is an active absorber part, and the second one is the decay region for the detection of converted photons from the decay . The secondary particles from interactions in the detector are absorbed in its first part. Heavy neutrinos produced through the muonic mixing penetrate the dump and decay into a photon and a light neutrino in the second downstream part of the detector, with a subsequent photon conversion. The experimental signature of the decay is the appearance of a single pair originating from a secondary vertex displaced from the primary one at a distance significantly larger than the detector nuclear interaction length, . The main background sources for this setup are expected from the secondary neutrons and/or ’s penetrating the dump and producing ’s either in hadronic secondary interactions or in decays in flight in the target. The decays of these ’s could be misidentified as a single decay photon event. The suppression of these backgrounds can be achived by increasing the absorption in the first part of the detector simply by increasing its length or by selecting events with larger . Obviously, the precise identification of the electromagnetic nature of the signal event is of great importance for this search. Interestingly, if the event excess is indeed originated from the converted photons, the proposed search could also distinguish whether the excess events are produced by photons from the decays or by ones emitted from the primary vertex due to anomaly-mediated neutrino-photon coupling, as discussed in [68].

The (almost) ideal detector to search for the decay is a detector similar to the NOMAD one [69]. The NOMAD is equipped with a forward calorimeter (FCAL), where the secondaries from high energy neutrino interactions in FCAL could be dumped. In addition, it has the excellent capability of identifying and reconstructing converted photons due to the low mass target located in a magnetic field. An example of the reconstruction of two conversion pairs from the decay can be found in Ref.[70]. One disadvantage of the detector is the short length of the tracking part. The overall detection efficiency of the production, decay in flight with the subsequent conversion of the decay photons into an pair and the reconstruction of the conversion pairs is expected to be low. The advantage of NOMAD is its great capability to measure the pair directionality with a precision of [71]. This will allow an effective suppression of converted photons originating from the primary vertex; see the discussion in Ref.[71] on reconstruction.
Another experiment capable of searching for the decay is the ICARUS T600, which is currently taking data at the CERN-Gran Sasso neutrino beam [72]. The detector is composed of two identical adjacent T300 half-modules filled with liquid argon (LAr). A detailed description of the apparatus can be found in [72]. Each T300 half-module has the following internal dimensions: (length) m3. LAr has a radiation length of cm and a nuclear interaction length of cm, and therefore provide good electromagnetic and hadronic secondary absorption and detection capabilities for the proposed search, assuming that the length of the decay region is m .
The number of events in ICARUS can be estimated as follows
| (30) |
where is the number of the detected neutral-current events, and are the probabilities for the decay in the detector fiducial volume and decay photon conversion, and the overall detection efficiency of the pair, respectively. In this estimate the average momentum is GeV, , and the length of the decay region is m. Finally, we find that the number of expected signal events in ICARUS is
| (31) |
For the allowed mixing (see Fig. 24), this results in events. If no candidates are seen above the expected background level, ICARUS could set a limit on the mixing strength of the order , which is competitive for the mass range 40-80 MeV with the bounds obtained from the TWIST experiment, possibly allowing us to rule out the LSND-MiniBooNE parameter region. Note that the search for an excess of the decay events can also be performed in the recently proposed ICARUS-like experiment at CERN PS [73], or at FNAL with neutrino detectors such as MicroBooNE [74], HiResM [75], and BooNE (a MiniBooNE near detector) [76].
VIII Summary
In summary, we reexamined neutrino oscillation results from the accelerator experiments LSND, KARMEN and MiniBooNE. We showed that the LSND evidence for oscillations, its long-standing disagreement with the results from KARMEN, and the anomalous event excess observed by MiniBooNE in and data, can all be explained by the production and decay of a heavy neutral lepton. The shape of the excess events in several kinematic variables in the LSND and MiniBooNE and data is found to be consistent with the distributions obtained within this interpretation, assuming that the ’s are created by mixing in neutral-current interactions and decay radiatively into . Therefore, our main prediction is that the excess of events observed in the LSND and MiniBooNE experiments originates from the Compton scattering or conversion of the decay photons in these detectors. In this context, the confirmation of the photon origin of the excess events by measurements with a detector able to distinguish electrons and photons becomes a crucial test for this scenario.
A combined analysis of the energy and angular distributions of the excess events observed in the LSND and MiniBooNE experiments suggests that the mass is in the range from 40 to 80 MeV, the mixing strength is and the lifetime s. Surprisingly, this LSND-MiniBooNE favorable parameters window is found to be unconstrained by the results from the most sensitive , neutrino scattering, and LEP experiments. Because of the short lifetime, the constraints coming from cosmological and astrophysical considerations, as well as the bounds from the atmospheric neutrino measurements, are also evaded. We set new limits on the mixing for heavy neutrino masses in the range 40 to 80 MeV by using results on precision measurements of the Michel spectrum by the TWIST experiment. We also discuss the most natural model for the decay through the transition magnetic moment between the and the light neutrino and show that the obtained values and do not violate bounds from previous experiments.
The results obtained provide a strong motivation for a sensitive search for the in a near future decay or neutrino experiments. We propose such experiments with the expected sensitivity to cover the region of the LSND-MiniBooNE parameter space and notice they fit well in the existing and planned experimental programs at CERN or FNAL. The radiative heavy neutrino decay could be present in various extensions of the standard model and, thus, could enhance the reported motivations to search for this process. We note that an analysis of the excess of events due to the decay may also be possible with existing neutrino data; e.g. new results could be obtained from NOMAD [69].
The reported analysis gives the estimated values of the parameters , , and and may be improved by more accurate and detailed simulations of the LSND and MiniBooNE detectors. It would also be interesting and important to have general analysis of the production of heavy neutrinos of Dirac or Majorana type, e.g. in interactions, for arbitrary weak couplings, including the leptonic mixing and helicity effects.
Acknowledgements.
I would like to thank L. Camilleri, D.S. Gorbunov, N.V. Krasnikov, S.A. Kulagin, L. Di Lella, V.A. Matveev, V.A. Rubakov, and A. Rubbia for discussions. I am grateful to W.C. Louis for comments and clarifications, and to D. Sillou for discussions and help in manuscript preparation.References
- [1] Liquid Scintillator Neutrino Detector at the Los Alamos Neutron Science Center.
- [2] C. Athanassopoulos et al., Phys. Rev. Lett. 77, 3082 (1996); C. Athanassopoulos et al., Phys. Rev. C 54, 2685 (1996); C. Athanassopoulos et al.,Phys. Rev. Lett. 81, 1774 (1998).
- [3] A. Aguilar et al., Phys. Rev. D 64, 112007(2001).
- [4] KArlsruhe-Rutherford Medium Energy Neutrino experiments at the Rutherford-Appleton Laboratory.
- [5] B. Armbruster et al., Phys. Rev. D 65, 112001 (2002), and references therein.
- [6] Booster Neutrino Experiment at Fermilab
- [7] A.A. Aguilar-Arevalo et al.,Phys. Rev. Lett. 98, 231801 (2007).
- [8] A.A. Aguilar-Arevalo et al.,Phys. Rev. Lett. 102, 101802 (2009) ; arXive:0812.2243.
- [9] A.A. Aguilar-Arevalo et al., arXiv:1007.1150 [hep-ex] .
- [10] C. Athanassopoulos et al., Phys. Rev. C 55, 2078 (1997).
- [11] G. Drexlin et al., Phys. Lett. B 267, 321 (1991).
- [12] See, for example, T. Schwetz, Pramana 72, 119 (2009).
- [13] S.N. Gninenko, Phys. Rev. Lett. 103, 241802 (2009); arXiv:0902.3802 [hep-ph].
- [14] E. Ma, G. Rajasekaran and I.Stancu, Phys. Rev. D 61, 071302 (2000); E. Ma and G. Rajasekaran, Phys. Rev. D 64, 117303 (2001); S. Palomares-Ruiz, S.Pascoli and Th. Schwetz, JHEP 0509, 048 (2005).
- [15] R.E. Shrock, Phys. Rev. D 24, 1232 (1981).
- [16] R.E. Shrock, Phys. Rev. D 24, 1275 (1981).
- [17] S.N. Gninenko and D.S. Gorbunov, Phys. Rev. D 81, 075013 (2010); arXiv:0907.4666 [hep-ph].
- [18] P. Vogel, Phys. Rev. D 30, 1505 (1984).
- [19] B. Lie and F. Wilczek, Phys. Rev. D 25, 766 (1982);
- [20] P.B. Pal and L. Wolfensten, Phys. Rev. D 25, 766 (1982);
- [21] R.E. Shrock, Nucl. Phys. B 206, 359 (1982).
- [22] R.N. Mohapatra and P.B. Pal, ”Massive Neutrinos in Physics and Astrophysics”, World Scientific, Singapore, 1991.
- [23] F. Boehm and P. Vogel, ”Physics of Massive Neutrinos”, Cambridge University Press, Cambridge, England, 1992.
- [24] M.B. Voloshin et al., Sov. Phys. JETP 64, 446 (1986).
- [25] L.M. Johnson, D.W. McKay and T. Bolton, Phys. Rev. D 56, 2970 (1997);
- [26] D. Gorbunov and M. Shaposhnikov, JHEP 0710, 015 (2007).
- [27] A. Atre et al., JHEP 0905, 030 (2009); arXive:0901.3589.
- [28] M.A.B. Beg and W.J. Marciano, Phys. Rev. D 17, 1395 (1978).
- [29] C. Athanassopoulos et al., Nucl. Instr. Meth. A 388, 149 (1997).
- [30] L.B. Auerbach et al., Phys. Rev. C 66, 015501 (2002).
- [31] C.J. Horowitz, H. Kim, D.P. Murdock, and S. Pollock, Phys. Rev. C 48, 3078 (1993).
- [32] M.C. Martinez et al., Phys. Rev. C 73, 024607 (2006).
- [33] E. Kolbe, K. Langanke, F.-K. Thiehmann, and P. Vogel, Phys. Rev. C 52, 3437 (1995).
- [34] G. Garvey, E. Kolbe, K. Langanke, and S. Krewald , Phys. Rev. C 48, 1919 (1993).
- [35] B.I.S. van der Ventel and J. Piekarewicz, Phys. Rev. C 69, 035501 (2004).
- [36] T. Itoga et al., ”Neutron Production from Thin Target of Carbon and Iron by 70 MeV Protons”, .
- [37] A. Aguilar et al., Phys. Rev. D 64, 112007 (2001).
- [38] C. Athanassopoulos et al., Phys. Rev. C.58, 2489 (1998).
- [39] A.A. Aguilar-Arevalo et al., Nucl. Instr. Meth. Phys. Res. A 599, 28 (2009).
- [40] R.B. Patterson et al., Nucl. Instr. Meth. Phys. Res., A 608 (2009).
- [41] A.A. Aguilar-Arevalo et al., arXive:0806.1449.
- [42] A.A. Aguilar-Arevalo et al.,Phys. Rev. Lett. 103, 111801 (2009); arXive:0904.1958.
- [43] B. Kayser, Phys. Rev. D 26, 1662 (1982).
- [44] J.F Nieves, Phys. Rev. D 26, 3152 (1982).
- [45] C. Amsler et al., Review of Particle Physics, Phys. Lett. B 667, 1 (2008).
- [46] Y. Asano et al., Phys. Lett. B 104, 84 (1981).
- [47] C. Y. Pang et al., Phys. Rev. D 8, 1989 (1973).
- [48] R. Abela et al., Phys. Lett. B 105, 263 (1981).
- [49] R.S. Hayano et al., Phys. Rev. Lett. 49, 1305 (1982).
- [50] R. Bayes et al., arXive:1010.4998.
- [51] P. Kalyniak and J.N. Ng, Phys. Rev. D 25, 1305 (1982).
- [52] M.S. Dixit et al., Phys. Rev. D 27, 2216 (1983).
- [53] S.E. Derenzo, Phys. Rev. 181, 1854 (1969).
- [54] G. Bernardi et al., Phys. Lett. 166B, 479 (1986).
- [55] P. Abreu et al., Z. Phys. C 74, 57 (1997).
- [56] D. Buskulic et al., Phys. Rep. 216, 253 (1992).
- [57] A.D. Dolgov, Phys. Rept. 370, 333 (2002).
- [58] A.D. Dolgov, S.H. Hansen, G. Raffelt, and D.V. Semikoz, Nucl. Phys. B 580, 331 (2000).
- [59] A.D. Dolgov, S.H. Hansen, G. Raffelt, and D.V. Semikoz, Nucl. Phys. B 590, 562 (2000).
- [60] A. Kusenko, S. Pascoli, and D. Semikoz, JHEP 0511, 028 (2005).
- [61] See, for example, D.S. Gorbunov and V.A. Rubakov, ”Introduction to the Theory of the Early Universe”, Vol. 1,2, World Scientific, Singapore, 2010.
- [62] L.B. Auerbach et al., Phys. Rev. D 63, 112001 (2001).
- [63] S.N. Gninenko and N.V. Krasnikov, Phys. Lett. B 450, 165 (1999).
- [64] J. Altegoer et al., Phys. Lett. B 428, 197 (1998).
- [65] V. Fanti et al., Nucl. Instrum. Meth. A 574, 433 (2007).
- [66] See for example, S.Adler et al., Phys. Rev. D 77, 052003 (2008).
- [67] V.A. Duk et al., arXiv:1005.3517 [hep-ex].
- [68] J. A. Harvey, Ch. T. Hill, and R. J. Hill, Phys. Rev. Lett. 99, 261601(2007); J. A. Harvey, Ch. T. Hill, and R. J. Hill, Phys. Rev. D77, 085017(2008).
- [69] J. Altegoer et al., Nucl. Instrum. Meth. A404, 96 (1998).
- [70] C.T. Kullenberg et al., Phys. Lett. B 682, 177 (2009).
- [71] P. Astier et al., Phys. Lett. B 506, 27 (2001); e-Print: hep-ex/0101041.
- [72] S. Amerio et al., Nucl. Instrum. Meth. A 523, 275 (2004).
- [73] E. Calligarich et al., Jour. Phys.: Conf. Serie 203, 012110 (2010).
- [74] See , for example, M. Soderberg, AIP Conf. Proc. 1189, 83 (2009).
- [75] S.R. Mishra, R. Petti, and C. Rosenfeld, arXiv:0812.4527 [hep-ex].
- [76] I Stancu et al., arXiv:0910.2698 [hep-ex].