A realistic technique for selection of angular momenta from hot nuclei: A case study with 4He + 115In 119Sb∗ at ELab = 35 MeV
Abstract
A rather new approach employing Monte Carlo GEANT simulation for converting the experimentally measured fold distribution to angular momentum distribution has been described. The technique has been successfully utilized to measure the angular momentum of the compound nucleus formed in the reaction 4He + 115In 119Sb∗ at ELab = 35 MeV. A 50 element gamma multiplicity filter, fabricated in-house, was used to measure experimentally the required fold distribution. The present method has been compared with the other ones exiting in the literature and relative merits have been discussed.
Keywords:
Multiplicity filter, BaF2 scintillator, GEANT3 simulationPACS
24.10.Lx; 29.30.Kv; 29.40.Mc, , , , ,
1 Introduction
The emission of -rays from the decay of giant dipole resonance (GDR) in hot and fast rotating nuclei provides a unique tool to study the various kinds of structure (triaxial, prolate, oblate, spherical) that the nuclear system can assume at high temperature (T) and angular momentum J [1, 2, 3]. In heavy-ion fusion reaction, the compound nucleus is formed at well defined excitation energy, but with a wide range of angular momenta. The hot compound nucleus loses most of the excitation energy via particle and gamma emissions above the yrast line. The remainder of the excitation energy and angular momentum is generally removed by the low energy yrast gamma emission [1]. The GDR parameters depend on both excitation energy and angular momentum and to understand the individual contribution of T and J, it is important to separate the two effects. However, decoupling these two effects is a very difficult experimental task, the procedure adopted being the measurement of the high energy photon spectrum in coincidence with the low energy gamma multiplicity. A precise measurement of this -multiplicity is very important since the number of -rays emitted is directly related to the angular momentum populated in the system. As per the usual techniques, the multiplicity gamma rays are measured with an array of many detectors placed closed to the target having high efficiency and granularity. The fold (number of multiplicity detectors fired) distribution is recorded on an event-by-event basis in coincidence with the high energy gamma rays. Finally, the angular momentum distribution is extracted from this fold distribution in offline analysis. However, there is no straightforward procedure for mapping the fold distribution to angular momentum distribution and quite a few methods have been adopted in literature for converting the folds to J distributions [4, 5, 6, 7].
In this paper, we present a rather new technique based on Monte Carlo GEANT3 [8] simulation for converting the fold distribution to angular momentum distribution. The approach has been tested for the reaction 4He + 115In 119Sb∗ at ELab = 35 MeV, where the experimental fold distribution was measured with our recently fabricated gamma multiplicity filter. The above method has also been compared with other approaches adopted earlier.
2 The multiplicity spectrometer
Recently, a 50-element gamma-multiplicity filter made of BaF2 has been designed and developed at the Variable Energy Cyclotron Centre, Kolkata. The square shaped crystals have a cross-section of 3.53.5 cm2 and 5 cm in length. Standard procedures were followed for the fabrication of the detector from bare barium fluoride crystals [9]. Crystals were cleaned properly and then wrapped with several layers of white teflon tape, aluminium foil and black electrical tape. Fast, UV sensitive photomultiplier tubes (29mm dia, Phillips XP2978) were coupled with the crystals using a highly viscous UV transmitting optical grease (Basylone, 300000 cstokes). Aluminium collars of unique shape were used around the coupling area to provide additional support. Finally, for mechanical stability, the whole assembly (crystal + PMT) was wrapped with heat shrinkable PVC tube.


After fabrication, the individual detector elements were tested using standard gamma ray sources. Typical experimental energy spectra for an individual detector is shown in Fig. 1. The observed energy resolution is 7.2 at 1.17 MeV. The time resolution between two BaF2 detectors was measured with the 60Co source. The source was placed in between two identical detectors, which were kept 180∘ apart. The energies and their relative times were measured simultaneously in event by event mode. The resulting energy gated (1.0-1.4 MeV) time spectrum is shown in Fig. 2. The value obtained for time resolution is 450 ps.
3 In - beam experiment
The in-beam performance of the multiplicity filter was tested using alpha beam from the K-130 AVF cyclotron at VECC. A 1 mg/cm2 target of 115In was bombarded with 35 MeV alpha beam producing 119Sb at 36 MeV excitation energy (Lcr=16). For the estimation of the angular momentum populated by the compound nucleus, the 50-element filter was split into two blocks of 25 detectors each and was placed on the top and the bottom of the scattering chamber at a distance of 5 cm from the target center (covering 56 of 4) in castle geometry. The detectors of the multiplicity filter were gain matched and equal threshold was applied to all. Along with the filter, a part of the LAMBDA spectrometer [9] (49 large BaF2 detectors arranged in 77) was also used to measure the high energy gamma rays ( 4 MeV) in coincidence with low energy discrete gamma rays. The high energy photon spectrometer was centered at 90∘ to the beam direction and at a distance of 50 cm from the target. The schematic view of the experimental setup is shown in Fig. 3. The detectors of the multiplicity filter in castle geometry were staggered in order to have equal solid angle for each detector in the array.

A level-1 trigger (A) was generated from the multiplicity filter array when any detector of the top block and any detector from the bottom block fired in coincidence above a threshold of 250 keV. Another trigger (B) was generated when the signal in any of the detector elements of the LAMBDA spectrometer crossed a high threshold ( 4 MeV). A coincidence of these two triggers generated the master trigger ensuring the selection of the high energy photon events from the compound nucleus and rejection of background. The sum of the multiplicity filter (number of detectors fired in the event) was fed into a QDC (V792) gated by the master trigger to generate, on event-by-event basis, the experimental fold(F) distribution with condition (F 2). The crosstalk probability of the multiplicity set-up was also measured using 22Na (511, 1274 keV), 137Cs (662 keV) and 60Co (1.17, 1.33 MeV) sources at different discriminator thresholds of the filter. The measured crosstalk probabilities are shown in Fig. 4(symbols). It is observed that the scattering probability is more at higher energies and it decreases with increasing the threshold of the multiplicity detectors.

4 Existing procedures for determining the angular momentum
In general, the multiplicity distribution method is widely used to convert the experimentally measured fold distribution into angular momentum distribution [4, 5]. In this method, the low energy gamma multiplicity (M) is derived from the measured fold (F) distribution where the M to F response function of the multiplicity array is measured experimentally. The experimental procedure consists of placing a source at the target center emitting 2 gamma rays in cascade (e.g 60Co) and recording the gamma rays in the multiplicity filter. An external detector is used as a trigger, and the events are collected by selecting the photo-peak of 1.33 MeV gamma rays in it from the 60Co source, ensuring that exactly one gamma ray (1.17 MeV) is incident to the filter. With this condition, the events consisting of the analog signal proportional to the fold are stored in the list mode. Hence, the collected fold spectrum is the response of the filter to the -ray multiplicity M=1 (at specific energy 1.17 MeV). The response to the multiplicity M=k is generated, in offline analysis, by randomly selecting k events from the previously stored data in list mode and summing up the amplitudes of the associated individual fold signals. The M distribution is assumed to have a gaussian or a triangular form and the corresponding F-distribution is calculated by folding it with the above response function. The parameters of the M-distribution are varied until the best fit to the measured F-distribution is obtained. After getting the full M-distribution, the constraint M-distributions are calculated for the different F-windows.


In order to test the reliability of the method, the experimentally measured fold was converted to the multiplicity M using the above formalism. To remove the contribution of non-fusion events, the final experimental fold spectrum was generated, offline, by gating with high energy gamma rays ( 10 MeV) [10]. Following the multiplicity distribution method, the response function of the multiplicity filter was created for 1.17 MeV using 60Co. Similarly, the response function for 511 keV was created using 22Na source. The multiplicity distribution was assumed triangular as follows:-
| (1) |
where, Mmax is the maximum of this distribution and m is the diffuseness. The multiplicity distribution was folded with the response function to generate the corresponding fold distribution. The parameters Mmax and m were varied in order to match the experimental fold distribution. The comparison between the experimental fold distribution and those obtained using the multiplicity distribution method is shown in Fig. 5. Interestingly, the Mmax and m values extracted using the two-response functions (for two different energies, 511 keV and 1.17 MeV) are quite different. For 511 keV the values of Mmax and m are 7.5 and 1.4 respectively, whereas for 1.17 MeV, the corresponding values are 5.8 and 1.3. The difference between the two triangular distributions is clearly seen in Fig 6. This difference is due to the fact that the scattering probability and efficiency of the filter for the two energies is different (Fig 4). Consequently, the constraint M-distributions for different F-windows will be different for the two response functions. Moreover, the energy of the multiplicity gamma rays are not constant and depend on the initial and final J of a given transition. Therefore, generating the response function of the multiplicity filter at single energy will give incorrect values of average J for corresponding F windows as both, efficiency and scattering probability, depends on the gamma energy. Ideally, the energy distribution of the emitted multiplicity gamma rays should be measured experimentally and the response function should be created according to the measured energy distribution. However, calibrating the filter with different energy is experimentally very difficult as the sources emitting two gamma rays in cascade are not available always. Moreover, selecting k events from different response functions according to the energy distribution of the multiplicity will also be a very complicated job. As a result, for generating a realistic response function of the multiplicity filter to incorporate the energy dependence of efficiency and scattering probability, the only possible procedure is a Monte Carlo simulation.
Another approach, the recursion method [5], has also been adopted in literature to convert the fold to multiplicity distribution. In this method, the probability P(F,M) of triggering F out of N detectors by a cascade of M -rays can be calculated by using a simple recursive algorithm. The input parameters of the recursion are the total efficiency and scattering probability. This method gives practically identical results as obtained from the multiplicity distribution method [5]. The above formalism also suffers from the same problem since the efficiency and the scattering probability depends on the energy.

5 The present approach for determining the angular momentum
In this section, we describe an approach based on Monte Carlo GEANT3 [8] simulation for conversion of the experimental fold distribution to the angular momentum distribution. In this simulation, the realistic experimental conditions (including the detector threshold and trigger condition) are taken into account. The consistency of our simulation was checked by generating the fold distribution for the energies of 1.17 MeV and 511 keV considering the same parameters for incident gamma multiplicity as used earlier for multiplicity distribution method. Two blocks of 25 detectors arranged in 5 5 arrays were kept on the top and bottom of the scattering chamber, similar to the experiment, at a distance of 5 cm from the target position. The different input multiplicities of the low energy - rays were obtained by creating a random number according to the multiplicity distribution P(M). Low energy gamma rays, for each randomly generated multiplicity, were thrown isotropically from the target centre and the corresponding fold was recorded for that event. Two hundred thousand such events were triggered to record the final simulated fold distribution considering single energy of the incident gamma rays (511 keV and 1.17 MeV). The fold distribution obtained using GEANT simulation and those obtained from the multiplicity distribution method match quite well with each other (dotted line in Fig 5). Earlier, the simulated scattering probability was also found to be in good agreement with the experimental observation (Fig 4).

In order to have the correct energy distribution for simulation, the energies of the gamma multiplicity were measured experimentally. The distribution is shown in Fig. 7 (filled circles). The angular momentum distribution for this reaction was obtained from the statistical model code CASCADE [11]. The conversion of the angular momentum distribution to multiplicity distribution is achieved using the relation J = 2M + C, where C is the free parameter which takes into account the angular momentum loss due to particle evaporation and emission of statistical -rays. The final simulated fold distribution was generated using the multiplicity distribution along with its measured energy distribution. The incident energy distribution was parameterized by a Landau function (continous line in Fig. 7) given as
| (2) |
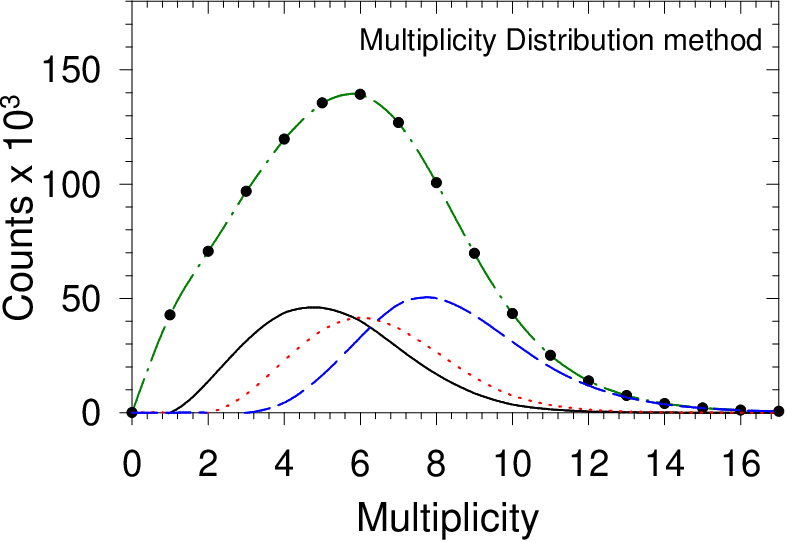
where p=c(Eγ-b), n=5350, b=320 keV and c=0.0085. The parameters Mmax and m of the multiplicity distribution was obtained from the J-distribution by varying the free parameter C until the best fit to the measured F-distribution was achieved. The value of C was obtained as 0.5 and the parameters of the M-distribution were extracted as Mmax = 8.0 and m = 1.9 for best fit. The extracted value of C seems to be reasonable as the angular momentum loss due to particle emission will be negligible (since medium mass nuclei is populated at low excitation energy). Also, the experimental fold distribution was generated by gating with high energy gamma rays ( 10 MeV), which further reduces the average angular momentum loss. The simulated fold distribution generated using the above triangular distribution is shown by solid line in Fig. 8. Next, the constraint multiplicity distributions for different folds were generated. The incident multiplicity distribution (dot-dashed line along with symbol) and the multiplicity distributions for different fold windows are shown in Fig. 9. The continuous line, the dotted and the dashed lines indicate the multiplicity distributions gating on the events with folds 2, folds 3 and folds 4 respectively. The above results have been compared with the multiplicity distribution method for 511 keV and 1.17 MeV response function. The incident multiplicity and the multiplicity for different folds (511 keV response function) are shown in Fig 10. The average angular momentum values for different fold windows are summarized in table 1.
As could be discerned, the results obtained from the present method with respect to multiplicity distribution method (using 511 keV response function) differs by 15. This is also expected because the average energy of the multiplicity -rays is less than the single energy (511 keV) used in the multiplicity distribution method. Thus, it seems to be important that the energy dependence of the efficiency and the cross talk probabilities of the filter should be taken into consideration while converting the measured fold distribution into corresponding angular momentum distribution.

| Fold | GEANT Simulation | Multiplicity Distribution | Multiplicity Distribution |
| (511 keV) | (1.17 MeV) | ||
| 2 | 12.2 4.7 | 10.5 4.5 | 9.2 4.3 |
| 3 | 15.1 4.8 | 12.9 4.5 | 11.0 4.3 |
| 4 more | 20.1 5.2 | 16.8 4.9 | 14.1 4.7 |
6 Summary
An approach based on Monte Carlo GEANT3 simulation has been presented for the selection of angular momentum space from the experimentally measured fold distribution. Drawback inherent in the existing approaches has been discussed and the present method has been applied to overcome the same. Experimental fold distribution was obtained employing our recently fabricated 50-element BaF2 multiplicity filter in the reaction 4He + 115In 119Sb∗ at 35 MeV beam energy. The present approach seems to have a significant importance while selecting the angular momentum space properly.
References
- [1] M. N. Harakeh and A. van der Woude, Giant Resonances, Fundamental High-frequency Modes of Nuclear Excitation, Clarendon Press, Oxford, 2001.
- [2] J.J. Gaardhoje, Ann. Rev. Nucl. Part. Sci. 42 (1992) 483.
- [3] K. Snover, Ann. Rev. Nucl. Part. Sci. 36 (1986) 545.
- [4] M. Mattiuzi et al., Nucl. Phys. A 612 (1997) 262.
- [5] A. Maj et al., Nucl. Phys. A 571 (1994) 185.
- [6] D.R. Chakrabarty Nucl. Instr. and Meth. 560 (2006) 546.
- [7] M. Jaaskelainen et al., Nucl. Instr. and Meth. 204 (1983) 385.
- [8] R. Brun et al., GEANT3, CERN-DD/EE/84-1 (1986).
- [9] S. Mukhopadhayay et al, Nucl. Instr. and Meth. A 582 603 (2007).
- [10] Srijit Bhattacharya et al, Phys. Rev. C 77 (2008) 024318.
- [11] F. Puhlhofer, Nucl. Phys. 280 (1977) 267.