Near-Infrared Spectroscopy of the Extrasolar Planet HR 8799 b
Abstract
We present 2.12-2.23 m high contrast integral field spectroscopy of the extrasolar planet HR 8799 b. Our observations were obtained with OSIRIS on the Keck II telescope and sample the 2.2 m CH4 feature, which is useful for spectral classification and as a temperature diagnostic for ultracool objects. The spectrum of HR 8799 b is relatively featureless, with little or no methane absorption, and does not exhibit the strong CH4 seen in T dwarfs of similar absolute magnitudes. The spectrum is consistent with field objects from early-L to T4 (3 confidence level), with a best-fitting type of T2. A similar analysis of the published 1-4 m photometry shows the infrared SED matches L5-L8 field dwarfs, especially the reddest known objects which are believed to be young and/or very dusty. Overall, we find that HR 8799 b has a spectral type consistent with L5-T2, although its SED is atypical compared to most field objects. We fit the 2.2 m spectrum and the infrared SED using the Hubeny & Burrows, Burrows et al., and Ames-Dusty model atmosphere grids, which incorporate nonequilibrium chemistry, non-solar metallicities, and clear and cloudy variants. No models agree with all of the data, but those with intermediate clouds produce significantly better fits. The largest discrepancy occurs in the -band, which is highly suppressed in HR 8799 b. Models with high eddy diffusion coefficients and high metallicities are somewhat preferred over those with equilibrium chemistry and solar metallicity. The best-fitting effective temperatures range from 1300–1700 K with radii between 0.3–0.5 . These values are inconsistent with evolutionary model-derived values of 800-900 K and 1.1–1.3 based on the luminosity of HR 8799 b and the age of HR 8799, a discrepancy that probably results from imperfect atmospheric models or the limited range of physical parameters covered by the models. The low temperature inferred from evolutionary models indicates that HR 8799 b is 400 K cooler than field L/T transition objects, providing further evidence that the L/T transition is gravity-dependent. With an unusually dusty photosphere, an exceptionally low luminosity for its spectral type, and hints of extreme secondary physical parameters, HR 8799 b appears to be unlike any class of field brown dwarf currently known.
Subject headings
planetary systems — stars: individual (HR 8799) — techniques: image processingI. Introduction
High contrast adaptive optics (AO) observations on large telescopes are beginning to explore the outer architecture (10 AU) of planetary systems for the first time (e.g., Biller et al. 11; Lafrenière et al. 64; Liu et al. 81; Chauvin et al. 24). The recent discoveries of giant planet systems around HR 8799 (Marois et al. 91), Fomalhaut (Kalas et al. 60), Pic (Lagrange et al. 70; Lagrange et al. 69), and 1RXS J160929.1–210524 (Lafrenière et al. 65; Lafrenière et al. 66) by direct imaging have shown that planets exist at large separations (10-330 AU) and are within reach of current telescope capabilities. The advantages of direct imaging compared to the radial velocity technique are threefold: it is the only way to study planets on wide orbits; it allows for estimates of the true planet mass through luminosity measurements (rather than minimum masses as is the case for non-transiting radial velocity planets), and it enables follow-up photometric and spectroscopic observations to study extrasolar planetary atmospheres.
Multiwavelength observations of extrasolar planets can be used to infer their physical and chemical properties and test our understanding of planetary atmospheres through direct comparisons with theoretical atmospheric models. Transmission spectroscopy and secondary eclipse observations of transiting exoplanets have led to the detections of several molecular species in the atmospheres of hot Jupiters, namely H2O, CO2, CO, and CH4 (e.g., Tinetti et al. 129; Swain et al. 126; Swain et al. 127). These short-period transiting gas giants are also providing valuable tests of irradiated planetary atmospheric models and have shown evidence for temperature inversions (e.g., Knutson et al. 62; Spiegel et al. 121), global atmospheric dynamics (Showman et al. 117), and non-equilibrium carbon chemistry (e.g., Cooper & Showman 30; Swain et al. 125).
At much larger separations of tens to hundreds of AU, observations of young (100 Myr) substellar companions near and below the brown dwarf/planetary-mass limit (13 ) are revealing the physical properties of very low-mass objects through direct imaging and spectroscopy (e.g., AB Pic B: Chauvin et al. 26, Bonnefoy et al. 12; GQ Lup B: Neuhauser et al. 103, McElwain et al. 92, Lavigne et al. 72; see Table 1 of Zuckerman & Song 136). For example, atmospheric model comparisons to near-infrared spectroscopy of the planetary-mass companion 2MASS J1207-3932 b (Chauvin et al. 25) is demonstrating the important role that dust may play in the atmospheres of young gas giants (Mohanty et al. 96; Patience et al. 105).
The system of three directly imaged giant planets orbiting HR 8799 presents an excellent opportunity to investigate the properties of extrasolar planetary atmospheres at young ages. HR 8799 (= HD 218396, V342 Peg) is a young11 1 Recently, Moya et al. [100] inferred an age of up to several Gyrs for HR 8799 using asteroseismology, which would imply that the HR 8799 companions are brown dwarfs (30-40 at 1 Gyr; Baraffe et al. 9). However, the Frequency Ratio Method (Moya et al. 102) used in that study is only accurate for a range rotational velocities (Suárez et al. 124), which for HR 8799 limits the applicability to inclinations 36∘ (Moya et al. 101). Reidemeister et al. [110] infer an inclination between 20-30∘ based on a stability analysis of the companions and combining the range of true rotational velocities with sin. Moreover, Fabrycky & Murray-Clay [39] find that the orbiting companions must have masses 20 based on a stability analysis. Altogether this points to a younger age for the system. Unfortunately, searches for wide stellar companions to HR 8799 which could further help constrain the age have not produced any promising candidates (Close & Males 29; Hinz et al. 56). Additionally, the subsolar internal metallicity of HR 8799 inferred by Moya et al. [101] may not be accurate because of the most probable inclination of the system. (60 Myr; Marois et al. 91), intermediate-mass (1.5 0.3 ; Marois et al. 91), A-type22 2 HR 8799 is a Doradus variable star and belongs to the class of chemically peculiar Bootis stars. Gray & Kaye [50] infer a spectral type of kA5 hF0 mA5 V Boo based on detailed spectroscopic analysis, where “k”, “h”, and “m” refer to the Ca II K, hydrogen, and metallic line strengths and profiles, respectively. star with an parallactic distance of 39.4 1.1 pc (van Leeuwen 133). Marois et al. [91] discovered three faint common-proper motion companions with projected separations of 68 AU (“b”), 38 AU (“c”), and 24 AU (“d”) and evolutionary model-derived masses of 7 , 10 , and 10 , inferred from their luminosities and the age estimate for HR 8799. Subsequent analysis of previous imaging data from Keck II in 2007 (Metchev et al. 94), Subaru in 2002 (Fukagawa et al. 46), and the Hubble Space Telescope in 1998 (Lafrenière et al. 67) revealed several pre-discoveries of the HR 8799 planets and confirmed their common proper and orbital motions. Dynamical modeling of this system suggests a small (but non-zero) inclination and two- or three-body resonances among the planets (Goździewski & Migaszewski 49; Reidemeister et al. 110; Fabrycky & Murray-Clay 40). Thermal emission has been detected from a warm inner debris disk around HR 8799 at 10 AU and an outer massive disk at 100 AU, implying an architecture analogous to our Solar System with giant planets surrounded by “exo-asteroid” and “exo-Kuiper” belts (Sadakane & Nishida 113; Zuckerman & Song 135; Moór et al. 97; Williams & Andrews 134; Rhee et al. 111; Chen et al. 27; Su et al. 123; Reidemeister et al. 110).
The atmospheric properties of the HR 8799 planets have been investigated in several studies. All three planets exhibit redder near-infrared colors than field T dwarfs with similar absolute magnitudes, which suggests the presence of dusty clouds in their atmospheres (Marois et al. 91; Metchev et al. 94; Lafrenière et al. 67). Additionally, non-equilibrium CO/CH4 chemistry in the atmospheres of HR 8799 c and d has been suggested by Hinz et al. [56] based on mid-infrared (3.3 m, -band, and -band) photometry. Likewise, Janson et al. [59] presented a low signal-to-noise (S/N) 3.88-4.10 m spectrum of HR 8799 c and suggested that the disagreement with atmospheric models based on chemical equilibrium may hint at the influence of non-equilibrium chemistry.
Methane forms at temperatures 1400 K (e.g., Fortney et al. 44), so under equilibrium conditions the spectroscopic signature of CH4 provides an independent diagnostic of effective temperature for ultracool objects. The presence of CH4 absorption in the near-infrared is also the defining spectral signature of T dwarfs and therefore is a useful tool for spectral classification. Medium-band photometry on and off the 1.6 m methane band with the and filters shows no evidence for methane absorption in HR 8799 b and c, although it may be present in HR 8799 d (Marois et al. 91). In this work we focus on the 2.2 m absorption band of HR 8799 b, which is also sensitive to non-equilibrium CO/CH4 chemistry at low temperatures and low surface gravities (Hubeny & Burrows 58; Fortney et al. 44).
We describe our adaptive optics (AO) observations with OSIRIS at Keck II and our data reduction procedure in II and III. In IV we compare field L and T dwarfs to our spectrum and previously published photometry for HR 8799 b, and we do the same with atmospheric models in V. Finally, we discuss our results in VI and we provide a summary in VII.
II. Observations
High contrast AO imaging observations are limited by quasi-static speckle noise at small angular separations (1-2′′), which results from slight imperfections in telescope optics and AO wavefront correction (Racine et al. 108; Marois et al. 88; Marois et al. 90; Oppenheimer & Hinkley 104). These speckle patterns pose many problems for directly imaging faint targets near bright stars. Speckle noise is correlated and adds coherently, so longer exposure times do not improve contrast performance in this regime. The speckles themselves can resemble real astronomical objects, making it difficult or impossible to distinguish between noise and true signal in a dataset. Additionally, speckles are time-dependent phenomena spanning a range of durations (e.g., Macintosh et al. 86; Hinkley et al. 55). Because of the temporal evolution of speckle patterns, no single observation of the point spread function (PSF) at a given time can accurately represent the PSF for observations taken over a long period of time.
As a result of these difficulties, there has been a concerted effort to develop observing and reduction techniques to overcome the limitations imposed by speckle noise. One version of the spectral differential imaging technique (SDI; Sparks & Ford 120; Thatte et al. 128) takes advantage of the wavelength-dependent nature of speckle positions to distinguish speckles from bona fide objects, which remain stationary across all wavelengths.33 3 This version of SDI makes the fewest assumptions about the planet’s spectrum. An earlier, simpler version of SDI (Smith 119; Racine et al. 108; Marois et al. 88; Biller et al. 11) involves simultaneously imaging in two neighboring wavebands over which plant-star contrasts significantly vary, e.g. at the 1.6 m CH4 absorption band present in low-temperature objects. In principle, integral field spectrograph (IFS) observations can naturally utilize SDI (Sparks & Ford 120; Berton et al. 10; Thatte et al. 128; Antichi et al. 6). Yet to preserve the flux from real objects, SDI requires a fractional change in wavelength that is large enough to avoid self subtraction after de-magnification. SDI with IFSs is therefore more practical for observations with broad wavelength coverage (i.e., broad-band filters rather than narrow-band filters). Here we make use of a variant of the angular differential imaging method (ADI; Liu 79; Marois et al. 89), which normally relies on rotation of the field of view when the telescope rotator is turned off. This speckle subtraction technique makes it possible to distinguish between the speckle pattern, which remains stationary, and real objects, which rotate. Our implementation of ADI is different, however, as we leave the rotator on to ensure that HR 8799 b remains in the same position on our detector (to avoid the planet rotating out of the narrow field of view of our observations; see below). In this version of ADI the planet remains stationary while the speckles rotate.
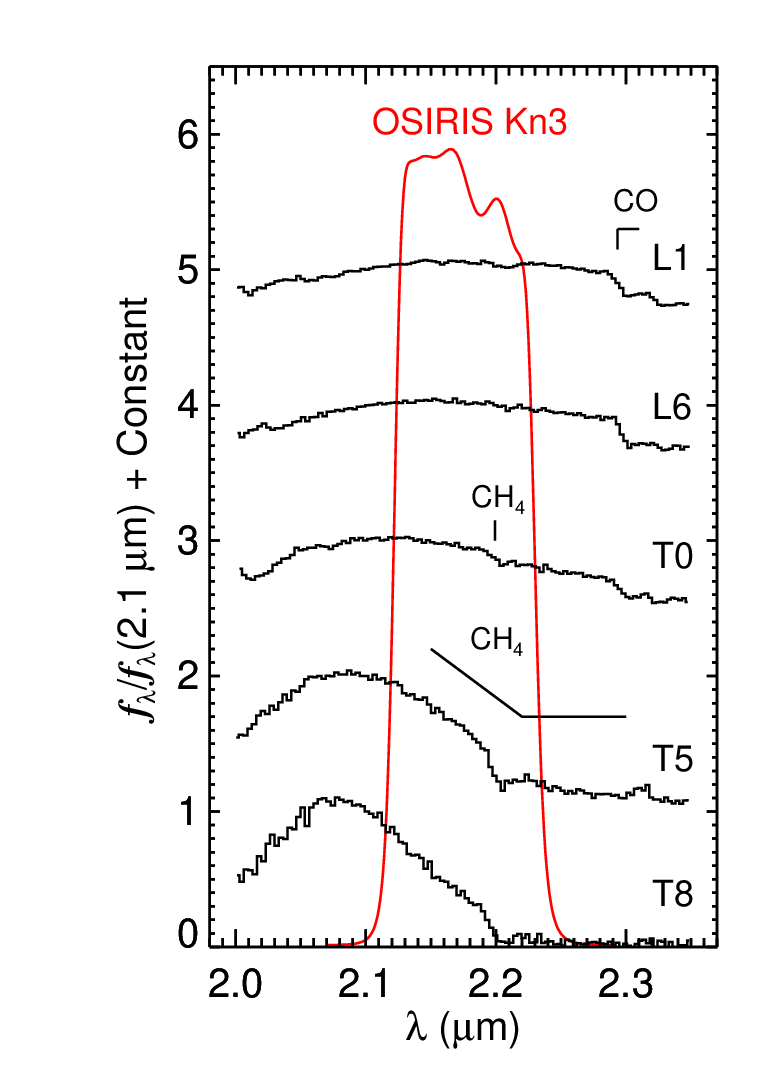
Our observations of HR 8799 b were carried out with the OH-Suppressing InfraRed Integral-field Spectrograph (OSIRIS; Larkin et al. 71) with natural guide star AO at Keck II on 2009 July 21 UT. The weather was clear with a seeing estimate of 07 in the optical. OSIRIS IFS observations result in data cubes with spectral information over a large number (between 1-3103) of spatial positions. The longer-lived portion of the speckle pattern in the OSIRIS data cubes can be used to register the individual images in an ADI sequence. Ideally we would obtain broad wavelength coverage over a large field of view to maximize the number of speckles in our observations, but there is a tradeoff between spectral coverage and field of view with IFS instruments as a result of limited space on the detector. We chose the Kn3 filter (2.121-2.229 m44 4 These wavelengths correspond to the half-power points for the Kn3 filter. The OSIRIS pipeline excludes wavelengths outside this region in the reduction.; Figure 1) with the smallest plate scale (002) to target the 2.2 m CH4 band with a moderate field of view (096128) while simultaneously well-sampling the PSF. Our filter choice was also based on AO performance, which is best in the -band, and the fact that better CH4 line lists exist at 2.2 m than at 1.6 m, thereby enabling more accurate constraints on physical parameters using atmospheric models. The spectral resolving power ( /) of the OSIRIS data varies as a function of lenslet geometry (which depends on the filter), wavelength, and spatial position. At the location of HR 8799 b in our observations, we estimate 4300.55 5 Based on data in the OSIRIS User’s Manual, v.2.3 (http://irlab.astro.ucla.edu/osiris).
We obtained 18 consecutive observations of HR 8799 b with exposure times of 300 s each for a total integration time of 90 min. The airmass varied from 1.16 to 1.00 throughout our observations, spanning 13∘ of the rotation of the PSF in our field of view. Immediately afterwards we obtained observations of the A0V standard star HD 208108 for telluric correction. We took sky frames before and after the science and standard star sequence. The FWHM of the standard star is 2.4 spaxels at 2.2 m, or 0048 with the 002 plate scale (i.e., diffraction-limited).
III. Data Reduction
III.1. LOCI Processing
Initial data reduction was performed using the OSIRIS data reduction pipeline (v.2.2; Krabbe 63). The OSIRIS pipeline corrects for detector artifacts, performs sky subtraction and flat fielding, wavelength-calibrates the data, and assembles the 2D spectra from each lenslet into 3D data cubes. Every resulting data cube contains 3063 spectra, each with 433 spectral channels and a spatial geometry of 4864 “spaxels,” or spatial pixels. An example of a median-combined data cube from our observations is shown in Figure 2 (left panel).
The limited field of view of our OSIRIS configuration made registering the individual data cubes more difficult than for standard high contrast imaging observations because the OSIRIS field of view encompassed only a portion of the stellar PSF and did not include the peak. (HR 8799 was placed 08 below the edge of the array.) Slight drifting caused the image positions to move on a 1-2 spaxel scale over the course of our observations. To register the data cubes we chose an observation near the middle of the ADI sequence and then used the relative rotation angle of the remaining observations to individually derive the and pivot coordinates about which the telescope rotated. The rotation angle between exposures was computed from the FITS header information and remained a fixed parameter in our analysis. We binned each data cube into 10 spectral channels and solved for a single pivot point position for each observation. This was done in an iterative fashion using the AMOEBA algorithm (Press et al. 107) by minimizing the rms of each de-rotated residual data cube (i.e., the fixed cube in the middle of our ADI sequence minus the cube being considered). The rms was computed in an overlapping rectangular region of the residual data cube and included several bright speckles. A visual inspection of each de-rotated data set confirmed the proper alignment of bright speckles.66 6 Although the speckles were well aligned using our registration technique, there was a large variation in the inferred pivot point positions (usually differing by 5-20 spaxels, but even larger for a few of the exposures). The reason for this discrepancy is that the pivot point position is highly sensitive to small adjustments when aligning two exposures using this technique. The impact on the extracted spectrum was minor when the pivot point and rotation angle were fixed in the reduction; the main effect was to increase the spectral measurement errors, but the shape of the spectrum was preserved. We tested the registration with several choices for the number of spectral bins and found that 10 bins adequately compensated between S/N and number of spectral channels.

We performed speckle subtraction on our de-rotated data cubes using the “locally optimized combination of images” (LOCI) algorithm (Lafrenière et al. 68; Figure 2, right panel). For each image, LOCI solves for the optimal linear combination of all the other images to build a reference frame for PSF subtraction. We median-combined each data cube into 10 spectrally binned frames and independently treated each binned spectral channel as images in an ADI sequence. Following Lafrenière et al. [68], we experimented with the different LOCI optimization parameters that control the shape and size of the optimization annular subsection ( and ), the size of the subtraction subsection (), and the minimum displacement distance from the science target to avoid self-subtraction (). We systematically varied each LOCI parameter and the number of bins to study the influence on the resulting spectrum. Adjusting the values of (from 100 to 400), (from 0.5 to 2.0), and (from 2 to 10) had little effect on the spectrum. Values of below 1.0 (in units of PSF FWHM) resulted in a smaller signal from the planet due to increased self-subtraction, but values of between 1.0-2.0 had only a minor impact. Increasing the number of spectral bins resulted in a noisier spectrum, but the shape and amplitude of the spectrum remained unchanged. We used ==1.0, =10, and =1.0 for our final spectrum.
After speckle subtraction, we performed aperture photometry on each individual data cube to extract the spectra of HR 8799 b. Although the sky background should be zero as a result of using LOCI, we tested aperture photometry with and without sky subtraction as a precaution. ADI+LOCI produces a slight negative trough on either side of the planet spectrum as a result of de-rotation and subtraction. These troughs may affect sky subtraction using sky values computed from an annulus so we also tried sky subtraction using a sky value computed from a nearby box; the shape and amplitude of the extracted spectrum were preserved in all cases and the final flux measurements were all in agreement. We chose an aperture radius of 2 spaxels with no sky subtraction for our final extracted spectrum. The final spectrum was assembled by scaling each of the 18 spectra to the median-combined spectrum and then computing the median of the scaled spectra.

| (m) | (2.1265 m) | |
|---|---|---|
| 2.1265 | 1.000 | 0.072 |
| 2.1373 | 1.103 | 0.082 |
| 2.1481 | 1.164 | 0.096 |
| 2.1589 | 1.004 | 0.058 |
| 2.1697 | 1.065 | 0.095 |
| 2.1805 | 0.820 | 0.067 |
| 2.1913 | 0.778 | 0.098 |
| 2.2021 | 0.722 | 0.090 |
| 2.2129 | 0.697 | 0.085 |
| 2.2237 | 0.932 | 0.121 |
To telluric correct the spectrum of HR 8799 b we first extracted the spectrum of the standard star by spectrally binning the standard star data cubes, performing aperture photometry with an aperture radius of 10 spaxels (the FWHM is 2.4 spaxels), and combining the individual standard spectra in the same fashion as we did for the planet. We then used the xtellcor_basic package in Spextool (Cushing et al. 33) to divide the planet spectrum by the standard spectrum and multiply by a blackbody with a temperature of 10,000 K (corresponding to an A0 star) to restore the continuum shape.
Our telluric-corrected spectrum is displayed in Figure 3 and the measurements are listed in Table 1. Methane can influence the 2.15-2.23 m spectral region, with a particularly prominent absorption feature at 2.20 m (Cushing et al. 32). Strong 2.2 m CH4 absorption is noticeably absent in our spectrum, although a weak methane feature may be present as a negative slope from 2.15-2.22 m and diminished flux from 2.20-2.22 m.
III.2. Determining Measurement Errors
Many sources of random and systematic errors can contribute to the uncertainties in our OSIRIS spectrum, including speckle noise, the use of a fixed radius in aperture photometry, and self-subtraction of the science target as a result of ADI+LOCI (e.g., Lavigne et al. 72). To assess the systematic and random errors in our spectrum, we injected and extracted fake planets in our data. For the artificial planets we used the standard star scaled to the amplitude of HR 8799 b. We injected the fake planets in six locations in the original individual images, reduced the full data set, and extracted the planets in the same fashion as we did with the science spectrum. To minimize the impact on the construction of the reference PSF, we input one fake planet into the data at a time. The ratio of the input to output spectra of the fake planets varied on the level of 5-10% depending on the location of the injected planet (Figure 4). In some locations systematic trends as a function of wavelength were observed, especially in the region closer to HR 8799 where the speckle subtraction was worse. Overall, however, a linear fit to the mean and rms of all six ratio spectra indicate that no correction is warranted as the slope of the fit is statistically consistent with zero.
When random noise is the dominant source of error, the best estimate of the actual flux at each wavelength is the mean value, and the best estimate of the uncertainty in that measurement is the standard error of the mean (/, where is the number of spectra). Here we use the median flux value at each wavelength instead of the mean to avoid outliers in the data. In this case the expected uncertainty from photon noise is the standard error of the median (which for large sample sizes and normally distributed data is / 1.25 ; Hojo & Pearson 57). However, our analysis of the fake planet spectra indicate that the standard error of the median of the real planet spectra underestimates the actual measurement uncertainty.
To compute the uncertainties from our fake planet simulations, we first computed the spectra for each of the six fake planets by taking the mean spectrum of 18 measurements from the individual images. After the spectra of the 6 fake planets were scaled to a common level, the standard deviation of the six spectra at every wavelength was adopted as the true standard error of the mean. When we compared these uncertainties from the fake planets to the standard error of the median from the 18 real spectra of HR 8799 b (and accounting for the factor of 1.25 between the two datasets), we found that the uncertainty derived from the spectra of HR 8799 b was underestimated by a factor of 1.5–2.5. We therefore adopted the standard error of the mean from the fake planet analysis for our HR 8799 b spectroscopic uncertainties. The final S/N per spectral bin of our OSIRIS spectrum varies between 7-18 with a mean value of 11.

IV. Comparison to Field Brown Dwarfs
In many ways brown dwarfs are massive analogs of giant planets, sharing similar radii, effective temperatures, atmospheric physics, and cooling histories. Brown dwarfs can therefore serve as natural reference objects to guide our understanding of giant planet properties. Here we compare both our OSIRIS spectrum and previously published photometry of HR 8799 b to near-infrared spectra of L and T dwarfs from the Infrared Telescope Facility (IRTF) SpeX Prism Spectral Library.77 7 Maintained by Adam Burgasser at http://www.browndwarfs.org/spexprism. The spectra have resolving powers between 75 and 120 and were reduced and telluric corrected using Spextool data reduction package for IRTF (Vacca et al. 132; Cushing et al. 33). When available we use optical spectral types for L dwarfs, and for all other objects we use near-infrared types. Objects with peculiar near-infrared classifications are omitted unless they have normal L-type optical spectral types. Altogether we use 238 L and T dwarf spectra in our analysis, consisting of 92 objects with L-type optical classifications, 56 with L-type near-infrared classifications, and 90 with T-type near-infrared classifications.

IV.1. 2.12-2.23 m Spectroscopy
We fit the L and T dwarf prism spectra to our OSIRIS spectrum by binning them onto the same wavelength grid as the OSIRIS data and scaling each prism spectrum by a factor , which is found by minimizing the statistic
| (1) |
where and are the measured flux density and uncertainty of HR 8799 b and is the prism spectrum flux density measurement at each wavelength . Equating the derivative to zero and solving for the scaling factor we get
| (2) |
The best-fitting spectral type to our HR 8799 b spectrum is T2 (Figure 5). Objects between L8 and T3 yield relatively small values (20 for 9 d.o.f.). Those later than T4 produce poor fits because of their strong methane absorption. We use the method (Press et al. 107) to determine which templates are statistically consistent with our data. We consider models with values 35.6 as being in agreement with our spectrum, which corresponds to a value with an integrated probability of 99.73% (3 ) for 9 degrees of freedom (25.3) plus the minimum value of the fits (10.3). This corresponds to spectral types earlier than T4. For an integrated probability of 68.3% ( for 9 d.o.f. = 10.4), our OSIRIS data are consistent with spectral types of L4-T3.88 8 The best-fitting object results in a reduced value (/, for =9 degrees of freedom) of 1.15 using the standard error of the mean uncertainties from the fake planet analysis. The reduced value using the standard error of the median uncertainties from the 18 scaled spectra of HR 8799 b result in a reduced value of 2.39, which is further evidence that adopting the standard errors from the extracted spectra underestimate the uncertainties (see III.2).

IV.2. 1.1-2.4 m Photometry
We perform a similar analysis using previously published photometry of HR 8799 b. Marois et al. [91] presented , , , , , and photometry of HR 8799 b in their discovery paper. Lafrenière et al. [67] published photometry, Fukagawa et al. [46] and Metchev et al. [94] -band photometry, and Hinz et al. [56] an detection with upper limits at 3.3 m and -band. We use only the Marois et al. , , , and photometry in this analysis to avoid overweighting the -band region of the spectrum in our fits.
We synthesize photometry (e.g., Equation 5 of Tokunaga & Vacca 131) from each prism spectrum of the field dwarf sample using the , , and bands from the Mauna Kea Observatory (MKO) filter consortium (Simons & Tokunaga 118; Tokunaga et al. 130) and the zero point Vega flux densities from Tokunaga & Vacca [131]. For , we use the Keck II/NIRC2 filter transmission curve (J. Lyke, private communication) and the flux-calibrated Vega model spectrum from Spextool (Cushing et al. 33) to compute a zero point flux density for that filter (5.3110-11 W/m2/m).
We use a modified form of the statistic to assess goodness-of-fits for our photometric comparison. Following Cushing et al. [31] we compute a statistic for each prism spectrum :
| (3) |
where is the weight applied to each photometric point and is the monochromatic flux density in each bandpass. The scaling factor is then
| (4) |
We experimented with equal weights (=1.0) for each filter, in which case becomes the usual statistic, and weights proportional to the width of each spectral bandpass such that =1, defined as
| (5) |
where is the number of filters used in the fit. This results in weights of 0.18, 0.33, 0.13, and 0.36 for the , , , and bands. We use this weighting scheme in our analysis, although using equal weights produces similar results.
The results of our photometric comparison are shown in the left panels of Figure 6. Overall, field brown dwarfs produce poor fits to the HR 8799 b photometry. This may be a result of comparing objects with an order of magnitude difference in surface gravity (log 4.0–4.5 [cgs] for HR 8799 b vs. log 5.0–5.5 for field brown dwarfs). The differences can also arise from comparing objects with different cloud properties and/or metallicities. T dwarfs produce the worst fits as a result of their blue – colors compared to HR 8799 b. The best-fitting spectral type (as measured by the average -value for a given spectral type) is L5, although similarly good values are obtained from L5 to L8. However, typical L5 objects with values near the mean for that spectral type do not produce a strong match because of the red colors of HR 8799 b compared to other field objects (see also Figure 6 of Allers et al. 5).
The best fitting individual objects produce much better matches to the HR 8799 b NIR photometry. The left panel of Figure 7 shows the five best-fitting ultracool dwarfs, which have optical spectral types between L6 and L8 (for those with optical classifications). These objects all have very red NIR colors (–2.0–2.5 mag) and generally show evidence of low gravity and/or thick clouds. For example, atmospheric model fitting to the 0.8-14.5 m spectrum of SDSS J085758.45+570851.4 indicates that it has a low surface gravity (log =4.5) and a very cloudy atmosphere (Stephens et al. 122). HR 8799 b is well fit by 2MASS J22443167+2043433 (2MASS J2244+2043), which is the reddest L dwarf known with a – color of 2.480.15 mag (Dahn et al. 34). A comparison of atmospheric models to mid-infrared photometry of 2MASS J2244+2043 presented by Leggett et al. [76] suggests that it has extreme cloud properties with strong vertical mixing (104 cm2 s-1). There is also evidence that 2MASS J2244+2043 has a low surface gravity based on weak K I lines and FeH bands (McLean et al. 93; Looper et al. 84). The overall best-fitting object to HR 8799 b is 2MASS J21481628+4003593, which has a – color of 2.380.06 mag and a triangular -band shape (Looper et al. 84; Allers et al. 4). However, Looper et al. [84] interpret this object as old and metal-rich. Note that although the NIR SED of HR 8799 b is well-matched by these red field L dwarfs, the luminosity of HR 8799 b is roughly 3-10 times lower than these best-fitting objects.

IV.3. 1.1-4.1 m Photometry
We now extend the empirical comparison to m by incorporating -band photometry. We use the compilation of ultracool dwarf near- and mid-infrared photometry from Leggett et al. [73] to fit the , , , and photometry of HR 8799 b. magnitudes are converted to magnitudes using a polynomial fit to differenced synthetic photometry of L and T dwarfs from the SpeX Spectral Prism Library (see Appendix A). Uncertainties in the polynomial fit are accounted for in the -band photometric error.
To incorporate the photometric measurement errors of the comparison objects into our fitting analysis we define a goodness-of-fit statistic as follows:
| (6) |
where is the photometric measurement uncertainty of the ultracool dwarf for filter .99 9 We remove angle brackets from in Equation 6 to distinguish between actual photometry and synthesized photometry from spectra, which we use in Equation 3. The scaling factor is calculated iteratively as described in Appendix B. The weights are defined as in Equation 5 and correspond to values of 0.11, 0.19, 0.22, and 0.48 for the , , , and filters.
Mid- to late-L dwarfs provide the best fits to the 1-4 m photometry of HR 8799 b (Figure 6, right panels). These results hold when the weights are set to unity for all bands. Similar to our empirical comparison of the NIR SED (1.1-2.4 m), the best-fitting field objects to the near- and mid-IR photometry (1.1-4.1 m) are late-L dwarfs (L7.5-L8 optical spectral types) with red NIR colors, most of which exhibit evidence of low gravities and/or abnormally dusty photospheres (Figure 7, right panel). 2MASS J08251968+2115521 (hereafter 2MASS J0825+2115) has the lowest value and is a well-studied red L dwarf (–=2.070.04 mag; L7.5 optical spectral type). Stephens et al. [122] and Cushing et al. [31] performed atmospheric model fits to its near- and mid-infrared spectrum and found best-fitting effective temperatures of 1200 K and 1400 K, respectively, with unusually thick clouds compared to other field L dwarfs.
The location of HR 8799 b in the (–, -) color-color diagram is shown in Figure 8. HR 8799 b has a very red – color (1.43 mag) compared to field L and T dwarfs. Its – color is even more extreme than the reddest field L dwarfs (labelled in Figure 8), which are generally thought to have low gravities and/or unusually dusty photospheres.
In Figure 9 we compare the 1.1-4.1 m photometry of HR 8799 b to four well-studied, young, low-mass L dwarfs. AB Pic b is a 13-14 companion to a young (30 Myr) K2-type member of the Tucana-Horologium association (Chauvin et al. 26). Recently, Bonnefoy et al. [12] obtained medium-resolution integral-field spectroscopy of AB Pic b from 1.1-2.5 m and determined a spectral type of L0-L1. A comparison of HR 8799 b to the Bonnefoy et al. NIR spectrum in Figure 9 shows a decent match from 1.1-2.4 m, but HR 8799 b is slightly redder in –. Similarly, HR 8799 b has redder NIR colors compared to the integrated-light spectrum of SDSS J224953.47+004404.6AB (hereafter SDSS J2249+0044AB), a pair of low-gravity L dwarfs (L3+L5) recently discovered by Allers et al. [5]. The NIR spectrum of the young 8 L4-type companion 1RXS J160929.1–210524 b from Lafrenière et al. [65] and Lafrenière et al. [66] is significantly bluer than HR 8799 b, although the – color is nearly identical. Finally, HR 8799 b appears to be slightly bluer compared to the NIR spectrum of the 5-8 mid/late L-type object 2MASS J1207-3932 b from Patience et al. [105]. None of these four low-gravity L dwarfs provide good templates to the 1.1-4.1 m photometry of HR 8799 b.
Altogether, our spectral and photometric comparisons to field brown dwarfs suggest a spectral type between L5 and T2 for HR 8799 b. Although peculiar compared to most L and T dwarfs in the field, the planet’s photometry is consistent with the reddest field L dwarfs. These results imply that HR 8799 b is the lowest-mass L/T transition object currently known.

V. Comparison to Atmospheric Models
To derive the physical properties of HR 8799 b we compare our 2.12-2.23 m spectrum and 1.1-4.1 m published photometry to atmospheric models. We use three published grids of low-temperature atmospheric models in our analysis. The models of Hubeny & Burrows [58, hereafter HB07] were developed to assess the effects of nonequilibrium chemistry on the emergent spectra of brown dwarfs and giant planets. In these objects, departure from local chemical equilibrium (LCE) can arise when vertical mixing dredges up molecules from warmer, deeper atmospheric layers on timescales shorter than chemical reaction timescales and primarily affects CO/CH4 and N2/NH3 chemical abundances. The HB07 grid includes a baseline LCE model as well as three variations of the mixing timescale, which is parametrized by the eddy diffusion coefficient (with model values of 0, 102, 104, and 106 cm s-1). HB07 compute models for three CO/CH4 chemical reaction timescales (“,” “fast1,” and “fast2”). We consider the and fast2 chemical timescale prescriptions (fast1 and fast2 are similar) spanning effective temperatures of 700–1800 K (=100 K; see Hubeny & Burrows 58 for details). The models are for solar metallicity abundances and include clear atmospheres and cloudy atmospheres containing 100 m forsterite particles (Figure 10). The surface gravity of HR 8799 b is expected to be 4.0-4.7 dex given its luminosity and an age range of 30-160 Myrs (Baraffe et al. 9), so we use the log =4.5 models here.
Metallicity plays an important role in shaping the near-infrared spectra of ultracool objects by impacting the strength of collision-induced absorption by H2 (CIA H2; Linsky 78; Borysow et al. 13). CIA H2 is strongest in the 1.3–2.5 m spectral region and can affect the shape and amplitude of the -band emergent spectrum; metallicity variations are therefore directly relevant to our OSIRIS spectrum. We use the grid of low-temperature LCE atmospheric models from Burrows et al. [21, hereafter BSH06], which sample an order of magnitude variation in metallicity (=–0.5, 0.0, +0.5) for effective temperatures of 700-1800 K (Figure 10). We consider log =4.5 models with clear and cloudy variants for our analysis. As emphasized in BSH06, we note that there remain many uncertainties in the meteorological physics behind cloudy models in general. This particular set is only a representative version of particle size and cloud prescription which works well for modeling L dwarfs.

The red colors of HR 8799 b suggest that photospheric dust may play an important role in shaping its emergent spectrum. The HB07 and BSH06 models we consider here include a single cloud prescription with modest dust content and large grain sizes. To compare with a more extreme case of dust formation we also use the solar metallicity Ames-Dusty atmospheric models of Allard et al. [3], which considers the limiting case of dust formation with no gravitational settling and is computed in LCE. Thirty types of spherical grains are included in the models with an interstellar size distribution from 0.00625-0.24 m. The grid contains effective temperatures from 500-2000 K (=100 K) and surface gravities from 3.5-6.0 dex (log =0.5). The effect of atmospheric dust is to increase the gas temperature in the outer photospheric layers compared to the dust-free case (Allard et al. 3). This heating can result in weaker molecular features (like CH4 and H2O) and, in combination with the depletion of metals from the gas and the higher grain opacities at shorter wavelengths, tends to smooth out the SED to more closely resemble that of a blackbody. This phenomenon is shown in Figure 11 in a comparison between the HB07 clear (red), HB07 cloudy (green), and Ames-Dusty models (blue), which progressively shows the impact of higher levels of photospheric dust at different effective temperatures. (Note that the LCE HB07 cloudy models end at 1000 K.)


V.1. Physical Properties from Spectroscopic Analysis
We use the same fitting procedure as we did for field brown dwarfs in IV to compare the model atmosphere spectra to our OSIRIS spectrum. Our OSIRIS spectrum is not flux calibrated so for our analysis of the spectrum we cannot compute a radius as we do in V.2 using photometry. For the same reason we do not include the spectrum into a joint analysis with the photometry. The values for the HB07 and BSH06 models continue to decline with increasing until they reach a minimum at 1300-1600 K (Figure 12). The overall behavior of the values is a result of the strength of the 2.2 m CH4 feature in the models diminishing with higher temperature as the carbon balance shifts from CH4 to higher CO abundances. The result is a flattening the 2.12-2.23 m spectral region in the models, producing better fits to our HR 8799 b spectrum. In contrast, the distributions for the Ames-Dusty models (Figure 13) are relatively flat for effective temperatures higher than 800 K as a result of inhibited methane formation.

For effective temperatures between 800-1300 K, the HB07 models with clouds and high values produce better fits than clear LCE models. The distributions for cloudy HB07 models result minima 100 K lower than for the clear models. For the BSH06 models, the cloudy versions tend to fit the data slightly better than clear models. Higher gravity Ames-Dusty models tend to fit the spectrum better than lower gravities for 900 K, although the actual goodness-of-fit for the Ames-Dusty models is worse than for the HB07 and BSH06 models as is evident from the values.
The dominant opacity sources (CH4, CIA H2, and H2O) are generally well understood in the narrow spectral range of the observations, so systematic errors in the -band region of the models are probably small compared to the entire spectral energy distribution. (See 3.2 of Bowler et al. 15 and Dupuy et al. 36 for a discussion of this problem.) We therefore use the method to assign confidence limits as we did for field brown dwarfs in IV, except here we employ a value of 37.8 as a cutoff value between consistent and inconsistent models (corresponding to a 3 confidence level) for the HB07 and BSH6 grids because the minimum value is 12.5. For the Ames-Dusty grid (which we consider distinct enough to merit its own cutoff value), the equivalent value is 54.2 (=28.9). If HR 8799 b has parameters that fall within these grids, and if the atmospheric models are correct, the HB07 and BSH06 models constrain the effective temperature of HR 8799 b to 1100 K, and the Ames-Dusty models constrain the effective temperature to 800 K.
In Figure 14 we show examples of cloudy HB07 models with log =6 (left), cloudy BSH06 models with =+0.5 (middle), and Ames-Dusty models (right) for log =4.5 and =900, 1200, and 1400 K. The 900 K models correspond to effective temperatures derived from evolutionary models (Marois et al. 91) but produce poor fits to the OSIRIS spectrum.


V.2. Physical Properties from Photometric Analysis
To further constrain the physical properties of HR 8799 b, we fit the same three sets of atmospheric models to published photometry. We use the Marois et al. [91] , , , , and photometry in the fits. We exclude the published photometry because the 1.6 m CH4 band is too weak in atmospheric models as a result of incomplete CH4 line lists (e.g., Saumon et al. 116; Leggett et al. 75). We choose not use other published photometry near -band to avoid overweighting that portion of the spectrum in the fitting (: Lafrenière et al. 67). As described below, 3 upper limits at 3.3 m and -band by Hinz et al. [56] are also incorporated into our analysis. Our approach is to fit the observed SED using two techniques to scale the predicted flux densities from the atmospheric models.

V.2.1 Radius as a Free Parameter
The first method uses the statistic (Equation 3) as a measure of the goodness-of-fit and scales the model values using from Equation 4. The model spectra represent the emergent flux at the object’s surface, so the best-fitting value is also equal to , where is the object’s radius and is its distance. Throughout this work we use HR 8799 b flux densities at 10 pc. is therefore allowed to vary in a way that may not satisfy =. The model monochromatic flux densities for each filter are computed the same way as in IV. After we compute goodness-of-fit statistics we then consider the upper limits at 3.3 m and -band (Hinz et al. 56) to infer a range of best-fitting effective temperatures. The Hinz et al. upper limits are incorporated by considering two extreme cases. At one extreme, any models with flux above the upper limits are ruled out. In the weakest scheme, the upper limits are ignored and the best-fitting model is the one that provides the best fit to the detections only. As shown below, the two extremes produce very similar answers, so we adopt the range of models from both cases as the best fits. We note that between the 3.3 m and -band upper limits, the upper limit at 3.3 m provides the stronger constraint on the models and generally disfavors the cloudy versions with effective temperatures between 1400–1800 K.
Cloudy models produce significantly better fits to the observed SEDs for both the HB07 and BSH06 models (Figure 15). HB07 models with larger values of yield better fits for a given effective temperature. The best-fitting models for the HB07 grid are the cloudy variants with =1300-1500 K and log =6, and for the fast2 grid are the cloudy models with =1400-1600 K and log =6 (Figure 16). Based on the scaling factors, the radii inferred for the best-fitting models are 0.38-0.50 1010 10 The standard value for Jupiter’s radius is 71,492 km (Lindal et al. 77), which is the equatorial radius at 1 bar. and fast2 models are 0.35-0.44 . For a given effective temperature, BSH06 models with higher metallicities and clouds result in better fits. The best-fitting BSH06 model is the cloudy version with =1300 K and a corresponding radius of 0.48 (in this case the upper limits do not exclude the best-fitting model to the detections only). The best-fitting Ames-Dusty model to the detections has =1700 K, log =5.5, and =0.32 (Figures 16 and 17). All the Ames-Dusty models, however, do not agree with the upper limits. The -band upper limit is inconsistent with 900 K and the 3.3 m upper limit is inconsistent with models 800 K. Overall, these temperatures and radii are hotter and smaller than those predicted by evolutionary models (800–900 K and 1.1–1.3) given the age and luminosity of the planet (see VI).1111 11 We also calculate luminosities for each model by integrating the scaled synthetic spectra. We derive a luminosity log of –5.20.1 dex, which is in excellent agreement with the Marois et al. value of –5.10.1 dex. We note that for lower effective temperatures (larger radii), the luminosities are closer to –5.3 dex, while for higher effective temperatures (smaller radii), the luminosities are near –5.1 dex.
In Figure 18 we show the 900 K atmospheric models compared to the HR 8799 photometry, which corresponds to the temperature predicted by the evolutionary models. The -band fluxes are overpredicted and the -band fluxes are underpredicted in the HB07 and BSH06 cloudy models, indicating that even cloudier or more metal-rich models are needed to reproduce the observed flux. The 900 K Ames-Dusty model is a poor fit to the data, indicating that this limiting case of dust content is too extreme for HR 8799 b.
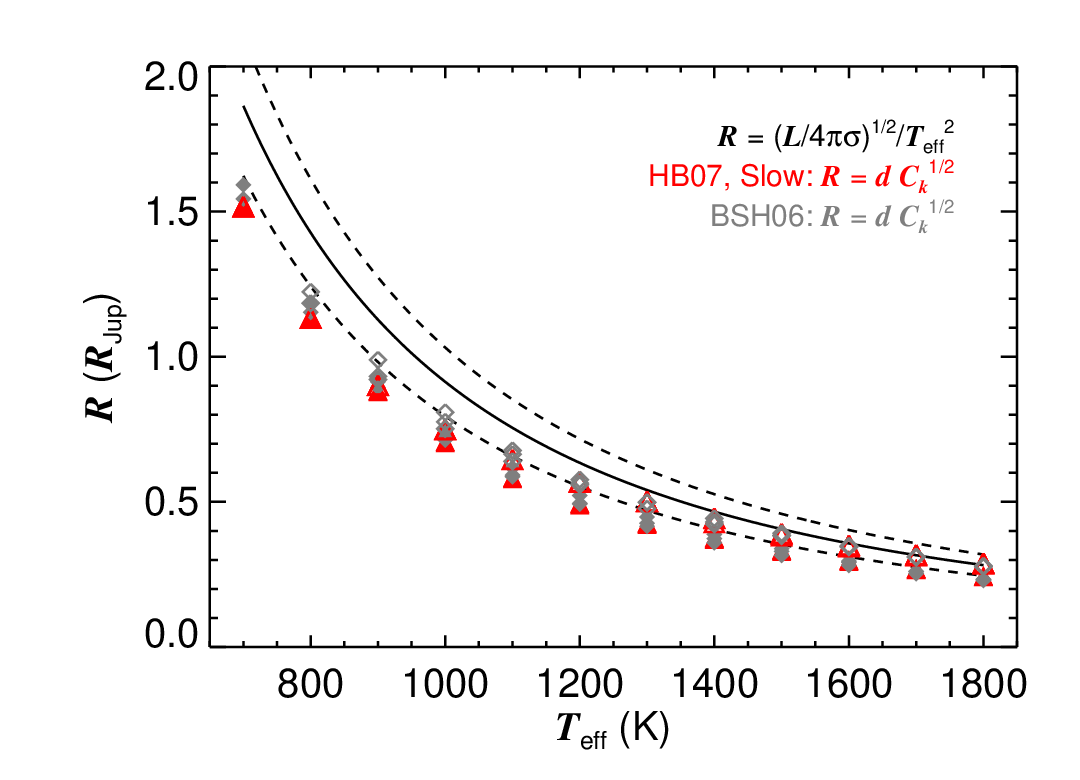
There appears to be a systematic underestimate of radii inferred using this fitting technique compared to the radius derived using =4 (Figure 19). The magnitude of the offset increases at lower effective temperatures and may result from inadequate atmospheric models. This suggests that caution must be used when inferring distances or radii from at very low temperatures.
To study the influence of surface gravity on our results, we also fit the HB07 and BSH06 models at log =5.5 and 5.0 (Figure 20). The distributions of values shift to lower effective temperatures at lower gravities. Additionally, the minima of the distributions occur at lower values for lower gravities, indicating that low gravities produce better fits than high gravities. We note that for the HB07 models the models result in lower values than fast2 models for all gravities, and for the BSH06 models the high metallicities are preferred over solar-metallicity and metal-poor models for all gravities.

V.2.2 Fixed Radius
Our second fitting method uses =4, the measured luminosity (log =–5.1 dex), and the model effective temperature to derive the scaling factor for each model. All models with the same effective temperature will have the same radius for a given luminosity, and therefore the same scaling factor =. To incorporate the uncertainty in the measured luminosity (0.1 dex) we fit the atmospheric models in a Monte Carlo fashion by randomly drawing a new luminosity value, computing a new scaling factor using the model effective temperature, and calculating the value for each trial. We use the same weights defined in Equation 5. We repeat this for 103 trails, resulting in a distribution of values for each model.
The outcome of fitting the models by fixing at each are similar to those from treating as a free parameter (Figure 21). Cloudy models, high models, and high metallicity models produce the best fits to the photometry. However, the systematic differences between the models and the data are similar to those noted in V.2.1, with the largest discrepancy in the -band.


VI. Discussion
Atmospheric model fitting to our OSIRIS spectrum and published photometry suggests that HR 8799 b is an object with extreme physical parameters (see Table 2 and Figure 22 for a summary of our results). The best-fitting atmospheric models are consistently the cloudy variants, which is in agreement with previous work indicating a high photospheric dust content (Marois et al. 91; Lafrenière et al. 67). The unusually red color of HR 8799 b (–=2.25 mag) is particularly striking given its intrinsic faintness (=16.30 mag), which is comparable to mid-T dwarfs in the field (which have –0 mag; e.g. Knapp et al. 61). Its position on the (, –) diagram from Burrows et al. [21, their Figure 3] is near the “Case A” and “Case B” model tracks, which formulate clouds in a similarly extreme fashion to the Ames-Dusty models with no gravitational settling of dust. However, the Ames-Dusty atmospheric models are inconsistent with the upper limits at thermal wavelengths. The more modest dust model used in HB07 and BSH06 models overestimate the and band fluxes and underestimate the band flux (which are suppressed and enhanced, respectively, in cloudy models), implying that an intermediate case between the cloudy HB07/BSH06 prescription and the Ames-Dusty case will provide better fits to the HR 8799 b photometry. Other low-mass, low-gravity objects such as HR 8799 d (=15.26 mag, –=2.15 mag; Marois et al. 91) and 2MASS 1207-3932 b (=16.38 mag, –=3.07 mag; Chauvin et al. 25, Mohanty et al. 96) sit in the same region of the color-magnitude diagram, suggesting that young planetary-mass objects possess radically enhanced cloud properties compared to every class of brown dwarf currently known.

Among the cloudy models, we find that those with high values (106 cm2 s-1) and metal-rich compositions (=+0.5) are generally preferred. These results are particularly intriguing because field L and T dwarfs do not appear to have such high levels of disequilibrium chemistry; values of 102-106 cm2 s-1 typically produce the best fits to near- and mid-infrared photometry and spectroscopy of ultracool dwarfs (Leggett et al. 76; Saumon et al. 116; Stephens et al. 122; Geballe et al. 47). The gas giants in our solar system have moderate values of in their stratospheres (102-105 cm2 s-1; Saumon et al. 115)1212 12 Note that is much higher in the convective regions of solar system giant planetary atmospheres than the radiative zone, reaching values of 106-109 cm2 s-1 (Fegley & Lodders 41; Atreya et al. 8; Moses et al. 98; Saumon et al. 116). also varies as a function of latitude and atmospheric pressure; see Moses et al. [98] for a detailed discussion applied to Jupiter’s atmosphere. with substantially metal-rich atmospheric compositions (metal abundances range from 2-4 times solar values for Jupiter, up to 10 times for Saturn, and even higher for some species in Uranus and Neptune; Atreya et al. 7; Lodders 82; Flasar et al. 42; Fortney & Nettelmann 45).

| Type of Fit | Best Fits |
|---|---|
| -band Spectroscopic Analysis | |
| Field Brown Dwarfs | SpT=T2 (earlier than T4) |
| HB07 Models | 1100 K |
| BSH06 Models | 1100 K |
| Ames-Dusty Models | 800 K |
| 1-4 m SED Analysis | |
| Field Brown Dwarfs | SpT between L5-L8 |
| HB07 Models | 1300-1600 K, cloudy, high |
| BSH06 Models | 1300 K, cloudy, =+0.5 |
| Ames-Dusty Models | =1700 K, log =5.5aaThis is the best-fitting model to the detections, but all Ames-Dusty models are inconsistent with the upper limits at 3.3 m and band from Hinz et al. [56]. |
The metallicity of HR 8799 b has implications for scenarios of its formation. Giant planets formed through core accretion (Pollack et al. 106; Alibert et al. 1) are generally predicted to have metal-rich atmospheres as a result of planetesimal accretion, the accretion of metal-rich gas, and/or core erosion (Alibert et al. 2; Guillot & Hueso 52; Mousis et al. 99; see Fortney et al. 44 for a thorough summary). There is currently no theoretical consensus regarding the atmospheric metallicities of gas giants formed through disk instability, the proposed alternative mechanism of giant planet formation (Cameron 22; Boss 14), but recent simulations by Helled & Bodenheimer [53] suggest that the metallicity of the HR 8799 planets should be similar to HR 8799 itself if they formed in this fashion. Unfortunately, the metallicity of HR 8799 is not known. HR 8799 is a Bootis star, so while its photosphere is metal-poor ([M/H]–0.5; Gray & Kaye 50; Sadakane 112), this may be a result of recent accretion of metal-poor gas and its internal metallicity could be very different (see Moya et al. 101 for a detailed discussion of this phenomenon). Ultimately, more refined predictions from planet formation theory combined with a better determination of the internal metallicity of HR 8799 and the metallicities of its planets will provide a key test to distinguish between core accretion and disk instability as the formation mechanism.1313 13 Note that the luminosities of HR 8799 b, c, and d do not agree with the luminosities of giant planets formed in the “cold start” models of Marley et al. [87] and Fortney et al. [44] for any ages or planet masses. The planets are far too luminous compared to the models. The agreement with the “hot-start” models may suggest that the HR 8799 planets were formed through disk instability, as has been suggested by Dodson-Robinson et al. [35] based on an analysis of plausible theoretical formation mechanisms.
While our model fitting of the SED demands a very cloudy atmosphere, the other physical parameters are less well-constrained. We caution that it is not clear whether our results represent actual evidence for strong vertical mixing and high metallicity, or whether they are simply an outcome of using grids of models with only a limited variety of cloud prescriptions (cloud-free, 100 m forsterite clouds, and completely cloudy). No atmospheric model that we analyzed agrees well with the SED of HR 8799 b, indicating that the atmospheric models are incorrect or that the physical parameters of HR 8799 b fall outside of the available grids. The relative success of these atmospheric models in reproducing the spectra of field brown dwarfs (e.g., Cushing et al. 31) suggests that the reason for the disagreement between atmospheric models and the photometry is most likely caused by a higher dust opacity in HR 8799 b than is included in the models. Indeed, there are many parameters in the cloud models that can influence the emergent spectra, such as particle size and cloud model prescription (see, e.g., Burrows et al. 21 and Helling et al. 54 for detailed discussions), and thus the best-fitting vertical mixing and/or metallicity value may change with a broader set of models.
Our results highlight a significant discrepancy between atmospheric and evolutionary model predictions. The measured luminosity of planet b (log =–5.10.1 dex) combined with the age of HR 8799 (30-160 Myr) implies an effective temperature of 800-900 K,1414 14 Note that the effective temperatures predicted by evolutionary models based on the luminosity of HR 8799 b are relatively insensitive to age since the radii of brown dwarfs and giant planets are nearly constant with mass and age after 100 Myr. At 1 Gyr the predicted temperature is 1000 K and at 10 Gyr it is 1100 K (Baraffe et al. 9) a radius of 1.16-1.24 , and a mass of 7-10 based on the Baraffe et al. [9] evolutionary models. However, we find the best-fitting atmospheric models have effective temperatures between 1300-1700 K and radii between 0.3-0.5 , significantly hotter and smaller than the evolutionary model predictions. This discrepancy for HR 8799 b has previously been noted by Marois et al. [91], Lafrenière et al. [67], and Hinz et al. [56]. In contrast, the radii inferred from fitting the spectra of late-M dwarfs (which have similar radii of 1 ) have been in better agreement with the values predicted by evolutionary models (Leggett et al. 74; Bowler et al. 15; Dupuy et al. 37) and likewise for field L and T dwarfs (Stephens et al. 122).
The radii inferred from atmospheric model fitting of HR 8799 b are likely to be incorrect because giant planets with degenerate cores cannot reach such small volumes at any point in their lifetimes (e.g., Guillot 51; Fortney et al. 43). Moreover, evolutionary models are less sensitive to boundary conditions (atmospheric parameters) than synthetic spectra are (Chabrier et al. 23; Saumon & Marley 114), which implicates the atmospheric models as the culprit. One probable explanation is that HR 8799 b has atmospheric properties that are outside of the parameter space explored by current models. At cool temperatures 1000 K (large radii), the 100 m cloud prescription from BSH06 does not significantly improve the fit to the photometry compared to cloud-free models (Figures 15 and 21). However, increasing the metallicity not only improves the fit at those temperatures, but it also shifts the best-fitting model from higher temperatures to lower temperatures. Even higher metallicities and dustier atmospheres (but less extreme than the Ames-Dusty case) may yield a best-fitting model with a temperature and radius closer to the values predicted by evolutionary models and with methane still inhibited in the -band spectrum.
An alternative solution to the discrepancy between the atmospheric model fitting results and predictions from evolutionary models is that HR 8799 b is underluminous, perhaps as a result of obstruction by an edge on-disk as suggested by Marois et al. [91]. This scenario is unlikely, however, because a similar underluminosity is seen with HR 8799 c and d. A radius discrepancy has also been found with 2MASS 1207-3932 b, which Mohanty et al. [96] and Patience et al. [105] interpret as an underluminosity caused by an edge-on disk. However, in light of the analogous problems with the HR 8799 planets, we favor a common origin either from fitting imperfect atmospheric models, or fitting models that do not cover sufficient parameter space. No underluminosity is observed for the brown dwarf primary 2MASS 1207-3932 A, which also makes this edge-on disk scenario unfavorable. More extensive atmospheric model development and fitting to the HR 8799 planets and other low-mass, low-gravity objects using different cloud prescriptions, metallicities, and eddy diffusion coefficients may help resolve this issue.
Our spectroscopic and photometric analysis indicates that the spectral type for HR 8799 b falls in the late-L/early-T range, corresponding to a physical regime where the atmospheres of field dwarfs are progressing from cloud-filled to cloudless (Burgasser et al. 19). The fainter absolute magnitude of HR 8799 b compared to field objects appears to be an extension of the suggestion by Metchev & Hillenbrand [95] that the L/T transition depends on surface gravity (or equivalently age). In their study of HD 203030B, a companion to a young (130-400 Myr) field star, they found a temperature of 100-200 K cooler for this L/T transition object compared to field objects of comparable spectral type using temperatures derived from evolutionary models combined with the age estimate of HD 203030. The temperatures inferred for the HR 8799 planets from evolutionary models are even cooler compared to field objects (by 300–400 K). Precise temperature derivations for brown dwarf binaries with dynamical mass measurements support this idea of a gravity-dependent L/T transition (Liu et al. 80; Dupuy et al. 38). Stephens et al. [122] find additional evidence based on atmospheric model fits to field L and T dwarfs, and Saumon & Marley [114] make a similar suggestion based on the location of Pleiades L/T transition objects in color-magnitude diagrams. We note that the same result is obtained with 2MASS 1207-3932 b; its luminosity (log =–4.720.14; Mohanty et al. 96) combined with the likely age of 5-10 Myrs (constrained through membership with the TW Hydrae association) implies an effective temperature of 1000 K based on evolutionary models (Baraffe et al. 9). This temperature is well below the L/T transition temperature for field objects (1200-1400, Golimowski et al. 48; Cushing et al. 31), yet the spectral type of 2MASS 1207-3932 b is mid- to late-L (Chauvin et al. 25; Mohanty et al. 96).
VII. Summary
We obtained a 2.12-2.23 m spectrum of HR 8799 b with the OSIRIS adaptive optics integral field spectrograph at Keck II. We performed an empirical comparison of field L and T dwarfs with our OSIRIS spectrum and previously published 1-4 m photometry using the SpeX Prism Spectral Library and the compilation of ultracool dwarf photometry from Leggett et al. [73]. Additionally, we fit these data using the HB07 model atmospheres, which include the effects of non-equilibrium chemistry caused by vertical mixing; the BSH06 models, which include non-solar metallicity chemical abundances; and the Ames-Dusty models, which explore the limiting case of extreme photospheric dust content. Our results are summarized below, in Table 2, and in Figure 22.
We rule out the presence of strong methane absorption at 2.2 m in HR 8799 b. The best-fitting spectral type to our OSIRIS spectrum is T2, although types earlier than T4 are consistent with our data.
Empirical fits of the SpeX Prism Library to the -, -, -, and -band photometry of HR 8799 b suggest a spectral type of L5-L8. The best-fitting field objects are red L dwarfs, which generally show evidence for low gravities and/or unusually dusty atmospheres.
Empirical fits of the Leggett et al. [73] compilation of ultracool dwarf photometry to HR 8799 b -, -, -, and -band photometry suggest a spectral type of mid-L to late-L. Late-type, red L dwarfs provide the best empirical fits to the near- to mid-infrared SED of HR 8799 b. Similarly, HR 8799 b lies near red L dwarfs in the –/– diagram, although it has even redder – colors than typical red L dwarfs.
Atmospheric model fits to our -band spectrum imply effective temperatures 1100 K.
Atmospheric model fits to the , , , , and bands favor cloudy HB07/BSH06 models with effective temperatures of 1300-1600 K and radii of 0.3-0.5 , although no models agree well with all the data. The best-fitting Ames-Dusty model has =1700 K, log =5.5, and =0.32 , but all models in this grid are inconsistent with the published upper limits at either 3.3 m or band. These effective temperatures and radii are inconsistent with evolutionary model predictions of 800-900 K and 1.1-1.3 based on the luminosity of HR 8799 b and the likely age of HR 8799. The origin of the discrepancy is unclear, but we suggest it is likely a result of imperfect atmospheric models or inadequate range of physical parameters in the models.
HB07/BSH06 atmospheric models with lower surface gravities, higher values, and higher metallicities generally provide better fits to the photometry of HR 8799 b. The effective temperature of the best-fitting model decreases as the surface gravity is lowered and as the metallicity is increased.
Altogether, we find that HR 8799 b has a spectral type consistent with L5-T2. With an evolutionary model-derived temperature of 800-900 K, HR 8799 b provides further evidence that the L/T transition is a gravity-dependent (or, equivalently, age-dependent) phenomenon.
Future photometric and spectroscopic observations can help to further constrain the physical properties of HR 8799 b. Cloudy atmospheric models indicate that the -band flux should be suppressed in a similar fashion as the observed -band flux. The -band region is sensitive to non-LCE chemistry; unfortunately, none of the HR 8799 planets were detected in a 2.7 hr observation in -band by Hinz et al. [56]. The lack of strong CH4 absorption at 2.2 m in our observations suggests that the CO feature of HR 8799 should be strong. Spectroscopy targeting the -band methane and the 2.3 m CO feature can provide even further constraints on the effective temperature and nonequilibrium chemistry of HR 8799 b. These observations, combined with spectroscopy of HR 8799 c and d, will elucidate the physical properties of this emerging class of low-mass objects which are characterized by low surface gravities, low luminosities, and exceptionally cloudy atmospheres.
Appendix A to Conversion
We converted -band to -band magnitudes for our sample of L and T dwarfs from Leggett et al. [73] by performing synthetic photometry to objects in the SpeX Prism Spectral Library and fitting a fifth order polynomial to the differential magnitudes (Figure 23). Optical types are used for L dwarfs when available, otherwise near-infrared spectral types are used. The best-fitting fifth-order polynomial is given by –=, where ={0.05538, 0.0055409, , 0.00083746, 10-5, 2.077810-6} and is the numerical spectral type defined such that =0 for L0 (e.g., L7=7, T0=10). This relation is valid from L0 to T7, and the rms of the fit is 0.0144 mag.
Appendix B Fitting Models to Data With Errors in Both Quantities
When there are uncertainties in both the model and the data we use the goodness-of-fit statistic (Equation 6), which scales both the model and the model errors by a scaling factor . Similar to (Equation 2) and (Equation 4), is computed by minimizing the merit function. Taking the derivative of with respect to , equating the result to zero, and simplifying, we get
| (B1) |
where is the model flux density for filter (of filters), is the flux density for object in filter , and and are the uncertainties in both quantities.
We solve for in an iterative fashion for each object with weights defined by Equation 5. was usually within 30% of when was computed with the “model” photometric errors ignored. Note that when =0, becomes , and additionally when =1, becomes .

References
- [1] Alibert, Y., Mordasini, C., Benz, W., & Winisdoerffer, C. 2005a, A&A, 434, 343
- [2] Alibert, Y., Mousis, O., Mordasini, C., & Benz, W. 2005b, ApJ, 626, L57
- [3] Allard, F., Hauschildt, P. H., Alexander, D. R., Tamanai, A., & Schweitzer, A. 2001, ApJ, 556, 357
- [4] Allers, K. N., et al. 2007, ApJ, 657, 511
- [5] Allers, K. N., Liu, M. C., Dupuy, T. J., & Cushing, M. C. 2010, ApJ, 715, 561
- [6] Antichi, J., et al. 2009, ApJ, 695, 1042
- [7] Atreya, S. K., Mahaffy, P. R., Niemann, H. B., Wong, M. H., & Owen, T. C. 2003, Planetary and Space Science, 51, 105
- [8] Atreya, S. K., Wong, M. H., Owen, T. C., Mahaffy, P. R., Niemann, H. B., de Pater, I., Drossart, P., & Encrenaz, T. 1999, Planetary and Space Science, 47, 1243
- [9] Baraffe, I., Chabrier, G., Allard, F., & Hauschildt, P. 2003, Brown Dwarfs, 211, 41
- [10] Berton, A., Gratton, R. G., Feldt, M., Henning, T., Desidera, S., Turatto, M., Schmid, H. M., & Waters, R. 2006, The Publications of the Astronomical Society of the Pacific, 118, 1144
- [11] Biller, B. A., et al. 2007, ApJSS, 173, 143
- [12] Bonnefoy, M., Chauvin, G., Rojo, P., Allard, F., Lagrange, A.-M., Homeier, D., Dumas, C., & Beuzit, J.-L. 2010, A&A, 512, A52
- [13] Borysow, A., Jorgensen, U. G., & Zheng, C. 1997, A&A, 324, 185
- [14] Boss, A. P. 1997, Science, 276, 1836
- [15] Bowler, B. P., Liu, M. C., & Cushing, M. C. 2009, ApJ, 1
- [16] Burgasser, A. J., Cruz, K. L., Cushing, M., Gelino, C. R., Looper, D. L., Faherty, J. K., Kirkpatrick, J. D., & Reid, I. N. 2010, ApJ, 710, 1142
- [17] Burgasser, A. J., Geballe, T. R., Leggett, S. K., Kirkpatrick, J. D., & Golimowski, D. A. 2006, ApJ, 637, 1067
- [18] Burgasser, A. J., Liu, M. C., Ireland, M. J., Cruz, K. L., & Dupuy, T. J. 2008, ApJ, 681, 579
- [19] Burgasser, A. J., Marley, M. S., Ackerman, A. S., Saumon, D., Lodders, K., Dahn, C. C., Harris, H. C., & Kirkpatrick, J. D. 2002, ApJ, 571, L151
- [20] Burgasser, A. J., McElwain, M. W., Kirkpatrick, J. D., Cruz, K. L., Tinney, C. G., & Reid, I. N. 2004, AJ, 127, 2856
- [21] Burrows, A., Sudarsky, D., & Hubeny, I. 2006, ApJ, 640, 1063
- [22] Cameron, A. G. W. 1978, Moon and the Planets, 18, 5
- [23] Chabrier, G., Baraffe, I., Allard, F., & Hauschildt, P. 2000, ApJ, 542, 464
- [24] Chauvin, G., et al. 2010, A&A, 509, A52
- [25] Chauvin, G., Lagrange, A.-M., Dumas, C., Zuckerman, B., Mouillet, D., Song, I., Beuzit, J.-L., & Lowrance, P. 2004, A&A, 425, L29
- [26] Chauvin, G., et al. 2005, A&A, 438, L29
- [27] Chen, C. H., Sheehan, P., Watson, D. M., Manoj, P., & Najita, J. R. 2009, ApJ, 701, 1367
- [28] Chiu, K., Fan, X., Leggett, S. K., Golimowski, D. A., Zheng, W., Geballe, T. R., Schneider, D. P., & Brinkmann, J. 2006, AJ, 131, 2722
- [29] Close, L. M., & Males, J. R. 2009, ApJ, 709, 342
- [30] Cooper, C. S., & Showman, A. P. 2006, ApJ, 649, 1048
- [31] Cushing, M. C., et al. 2008, ApJ, 678, 1372
- [32] Cushing, M. C., Rayner, J. T., & Vacca, W. D. 2005, ApJ, 623, 1115
- [33] Cushing, M. C., Vacca, W. D., & Rayner, J. T. 2004, PASP, 116, 362
- [34] Dahn, C. C., et al. 2002, AJ, 124, 1170
- [35] Dodson-Robinson, S. E., Veras, D., Ford, E. B., & Beichman, C. A. 2009, ApJ, 707, 79
- [36] Dupuy, T., Liu, M., Bowler, B., Cushing, M., Helling, C., Witte, S., & Hauschildt, P. 2010, arXiv/astro-ph:1007.4197
- [37] Dupuy, T. J., Liu, M. C., & Bowler, B. P. 2009a, ApJ, 706, 328
- [38] Dupuy, T. J., Liu, M. C., & Ireland, M. J. 2009b, ApJ, 699, 168
- [39] Fabrycky, D. C., & Murray-Clay, R. A. 2010a, ApJ, 710, 1408
- [40] —. 2010b, ApJ, 710, 1408
- [41] Fegley, B., & Lodders, K. 1994, Icarus, 110, 117
- [42] Flasar, F. M., et al. 2005, Science, 307, 1247
- [43] Fortney, J. J., Marley, M. S., & Barnes, J. W. 2007, ApJ, 659, 1661
- [44] Fortney, J. J., Marley, M. S., Saumon, D., & Lodders, K. 2008, ApJ, 683, 1104
- [45] Fortney, J. J., & Nettelmann, N. 2009, Space Sci Rev, 1
- [46] Fukagawa, M., Itoh, Y., Tamura, M., Oasa, Y., Hayashi, S. S., Fujita, Y., Shibai, H., & Hayashi, M. 2009, ApJ, 696, L1
- [47] Geballe, T. R., Saumon, D., Golimowski, D. A., Leggett, S. K., Marley, M. S., & Noll, K. S. 2009, ApJ, 695, 844
- [48] Golimowski, D. A., et al. 2004, AJ, 127, 3516
- [49] Goździewski, K., & Migaszewski, C. 2009, Monthly Notices RAS Letters, 397, L16
- [50] Gray, R. O., & Kaye, A. B. 1999, AJ, 118, 2993
- [51] Guillot, T. 2005, Annual Review of Earth and Planetary Sciences, 33, 493
- [52] Guillot, T., & Hueso, R. 2006, Monthly Notices RAS Letters, 367, L47
- [53] Helled, R., & Bodenheimer, P. 2010, Icarus, 207, 503
- [54] Helling, C., et al. 2008, MNRAS, 391, 1854
- [55] Hinkley, S., et al. 2007, ApJ, 654, 633
- [56] Hinz, P. M., Rodigas, T. J., Kenworthy, M. A., Sivanandam, S., Heinze, A. N., Mamajek, E. E., & Meyer, M. R. 2010, arXiv, astro-ph.EP
- [57] Hojo, T., & Pearson, K. 1931, Biometrika, 23, 315
- [58] Hubeny, I., & Burrows, A. 2007, ApJ, 669, 1248
- [59] Janson, M., Bergfors, C., Goto, M., Brandner, W., & Lafrenière, D. 2010, ApJ, 710, L35
- [60] Kalas, P., et al. 2008, Science, 322, 1345
- [61] Knapp, G. R., et al. 2004, AJ, 127, 3553
- [62] Knutson, H. A., Charbonneau, D., Burrows, A., O’Donovan, F. T., & Mandushev, G. 2009, ApJ, 691, 866
- [63] Krabbe, A. 2004, Proc. SPIE, 5492, 1403
- [64] Lafrenière, D., et al. 2007a, ApJ, 670, 1367
- [65] Lafrenière, D., Jayawardhana, R., & van Kerkwijk, M. H. 2008, ApJ, 689, L153
- [66] —. 2010, arXiv: astro-ph/1006.3070
- [67] Lafrenière, D., Marois, C., Doyon, R., & Barman, T. 2009, ApJ, 694, L148
- [68] Lafrenière, D., Marois, C., Doyon, R., Nadeau, D., & Artigau, É. 2007b, ApJ, 660, 770
- [69] Lagrange, A.-M., et al. 2010, Science, 329, 57
- [70] —. 2009, A&A, 493, L21
- [71] Larkin, J., et al. 2006, New Astronomy Reviews, 50, 362
- [72] Lavigne, J.-F., Doyon, R., Lafrenière, D., Marois, C., & Barman, T. 2009, ApJ, 704, 1098
- [73] Leggett, S. K., et al. 2010, ApJ, 710, 1627
- [74] —. 2000, ApJ, 536, L35
- [75] Leggett, S. K., Marley, M. S., Freedman, R., Saumon, D., Liu, M. C., Geballe, T. R., Golimowski, D. A., & Stephens, D. C. 2007a, ApJ, 667, 537
- [76] Leggett, S. K., Saumon, D., Marley, M. S., Geballe, T. R., Golimowski, D. A., Stephens, D., & Fan, X. 2007b, ApJ, 655, 1079
- [77] Lindal, G. F., et al. 1981, Journal of Geophysical Research, 86, 8721
- [78] Linsky, J. L. 1969, ApJ, 156, 989
- [79] Liu, M. C. 2004, Science, 305, 1442
- [80] Liu, M. C., Dupuy, T. J., & Ireland, M. J. 2008, ApJ, 689, 436
- [81] Liu, M. C., et al. 2009, in AIP Conf. Proc. 1094, Cool Stars, Stellar Systems, and the Sun, ed. E. Stempels (Melville, NY: AIP), 1094, 461
- [82] Lodders, K. 2004, ApJ, 611, 587
- [83] Looper, D. L., Kirkpatrick, J. D., & Burgasser, A. J. 2007, AJ, 134, 1162
- [84] Looper, D. L., et al. 2008, ApJ, 686, 528
- [85] Lupton, R., Blanton, M. R., Fekete, G., Hogg, D. W., O’Mullane, W., Szalay, A., & Wherry, N. 2004, The Publications of the Astronomical Society of the Pacific, 116, 133
- [86] Macintosh, B., Poyneer, L., Sivaramakrishnan, A., & Marois, C. 2005, Astronomical Adaptive Optics Systems and Applications II. Edited by Tyson, 5903, 170
- [87] Marley, M. S., Fortney, J. J., Hubickyj, O., Bodenheimer, P., & Lissauer, J. J. 2007, ApJ, 655, 541
- [88] Marois, C., Doyon, R., Racine, R., & Nadeau, D. 2000, The Publications of the Astronomical Society of the Pacific, 112, 91
- [89] Marois, C., Lafrenière, D., Doyon, R., Macintosh, B., & Nadeau, D. 2006, ApJ, 641, 556
- [90] Marois, C., Lafrenière, D., Macintosh, B., & Doyon, R. 2008a, ApJ, 673, 647
- [91] Marois, C., Macintosh, B., Barman, T., Zuckerman, B., Song, I., Patience, J., Lafreniere, D., & Doyon, R. 2008b, Science, 322, 1348
- [92] McElwain, M. W., et al. 2007, ApJ, 656, 505
- [93] McLean, I. S., McGovern, M. R., Burgasser, A. J., Kirkpatrick, J. D., Prato, L., & Kim, S. S. 2003, ApJ, 596, 561
- [94] Metchev, S., Marois, C., & Zuckerman, B. 2009, ApJ, 705, L204
- [95] Metchev, S. A., & Hillenbrand, L. A. 2006, ApJ, 651, 1166
- [96] Mohanty, S., Jayawardhana, R., Huélamo, N., & Mamajek, E. 2007, ApJ, 657, 1064
- [97] Moór, A., Ábrahám, P., Derekas, A., Kiss, C., Kiss, L. L., Apai, D., Grady, C., & Henning, T. 2006, ApJ, 644, 525
- [98] Moses, J. I., Fouchet, T., Bézard, B., Gladstone, G. R., Lellouch, E., & Feuchtgruber, H. 2005, Journal of Geophysical Research, 110, 08001
- [99] Mousis, O., Marboeuf, U., Lunine, J. I., Alibert, Y., Fletcher, L. N., Orton, G. S., Pauzat, F., & Ellinger, Y. 2009, ApJ, 696, 1348
- [100] Moya, A., Amado, P. J., Barrado, D., Hernández, A. G., Aberasturi, M., Montesinos, B., & Aceituno, F. 2010a, arXiv, astro-ph.SR
- [101] —. 2010b, arXiv, astro-ph.SR
- [102] Moya, A., Suárez, J. C., Amado, P. J., Martin-Ruíz, S., & Garrido, R. 2005, A&A, 432, 189
- [103] Neuhauser, R., Guenther, E. W., Wuchterl, G., Mugrauer, M., Bedalov, A., & Hauschildt, P. H. 2005, A&A, 435, L13
- [104] Oppenheimer, B. R., & Hinkley, S. 2009, Annual Review of Astronomy & Astrophysics, 47, 253
- [105] Patience, J., King, R. R., Rosa, R. J. D., & Marois, C. 2010, arXiv, astro-ph.EP
- [106] Pollack, J. B., Hubickyj, O., Bodenheimer, P., Lissauer, J. J., Podolak, M., & Greenzweig, Y. 1996, Icarus, 124, 62
- [107] Press, W., Teukolsky, S. A., Vetterling, W. T., & Flannery, B. P. 2007, Numerical Recipes: The Art of Scientific Computing, 3rd Ed.
- [108] Racine, R., Walker, G. A. H., Nadeau, D., Doyon, R., & Marois, C. 1999, The Publications of the Astronomical Society of the Pacific, 111, 587
- [109] Reid, I. N., Lewitus, E., Burgasser, A. J., & Cruz, K. L. 2006, ApJ, 639, 1114
- [110] Reidemeister, M., Krivov, A. V., Schmidt, T. O. B., Fiedler, S., Müller, S., Löhne, T., & Neuhäuser, R. 2009, A&A, 503, 247
- [111] Rhee, J. H., Song, I., Zuckerman, B., & McElwain, M. 2007, ApJ, 660, 1556
- [112] Sadakane, K. 2006, PASJ, 58, 1023
- [113] Sadakane, K., & Nishida, M. 1986, Astronomical Society of the Pacific, 98, 685
- [114] Saumon, D., & Marley, M. S. 2008, ApJ, 689, 1327
- [115] Saumon, D., Marley, M. S., Cushing, M. C., Leggett, S. K., Roellig, T. L., Lodders, K., & Freedman, R. S. 2006, ApJ, 647, 552
- [116] Saumon, D., et al. 2007, ApJ, 656, 1136
- [117] Showman, A. P., Fortney, J. J., Lian, Y., Marley, M. S., Freedman, R. S., Knutson, H. A., & Charbonneau, D. 2009, ApJ, 699, 564
- [118] Simons, D. A., & Tokunaga, A. 2002, The Publications of the Astronomical Society of the Pacific, 114, 169
- [119] Smith, W. H. 1987, Astronomical Society of the Pacific, 99, 1344
- [120] Sparks, W. B., & Ford, H. C. 2002, ApJ, 578, 543
- [121] Spiegel, D. S., Silverio, K., & Burrows, A. 2009, ApJ, 699, 1487
- [122] Stephens, D. C., et al. 2009, ApJ, 702, 154
- [123] Su, K. Y. L., et al. 2009, ApJ, 705, 314
- [124] Suárez, J. C., Moya, A., Martín-Ruíz, S., Amado, P. J., Grigahcène, A., & Garrido, R. 2005, A&A, 443, 271
- [125] Swain, M. R., et al. 2010, Nature, 463, 637
- [126] Swain, M. R., Vasisht, G., & Tinetti, G. 2008, Nature, 452, 329
- [127] Swain, M. R., Vasisht, G., Tinetti, G., Bouwman, J., Chen, P., Yung, Y., Deming, D., & Deroo, P. 2009, The Astrophysical Journal Letters, 690, L114
- [128] Thatte, N., Abuter, R., Tecza, M., Nielsen, E. L., Clarke, F. J., & Close, L. M. 2007, MNRAS, 378, 1229
- [129] Tinetti, G., et al. 2007, Nature, 448, 169
- [130] Tokunaga, A. T., Simons, D. A., & Vacca, W. D. 2002, The Publications of the Astronomical Society of the Pacific, 114, 180
- [131] Tokunaga, A. T., & Vacca, W. D. 2005, The Publications of the Astronomical Society of the Pacific, 117, 421
- [132] Vacca, W. D., Cushing, M. C., & Rayner, J. T. 2003, PASP, 115, 389
- [133] van Leeuwen, F. 2007, A&A, 474, 653
- [134] Williams, J. P., & Andrews, S. M. 2006, ApJ, 653, 1480
- [135] Zuckerman, B., & Song, I. 2004, ApJ, 603, 738
- [136] —. 2009, A&A, 493, 1149