Superdense massive galaxies in the ESO Distant Cluster Survey (EDisCS)Note: DraftNote: August 24, 2026
Abstract
We find a significant number of massive and compact galaxies in clusters from the ESO Distant Clusters Survey (EDisCS) at . They have similar stellar masses, ages, sizes and axial ratios to local compact galaxies in WINGS clusters, and to massive and passive galaxies found in the general field. If non-BCG cluster galaxies of all densities, morphologies and spectral types are considered, the median size of EDisCS galaxies is only a factor 1.18 smaller than in WINGS. We show that for morphologically selected samples, the morphological evolution taking place in a significant fraction of galaxies during the last Gyrs may introduce an apparent, spurious evolution of size with redshift, which is actually due to intrinsic differences in the selected samples. We conclude that the median mass-size relation of cluster galaxies does not evolve significantly from to . In contrast, the masses and sizes of BCGs and galaxies with have significantly increased by a factor of 2 and 4, respectively, confirming the results of a number of recent works on the subject. Our findings show that progenitor bias effects play an important role in the size-growth paradigm of massive and passive galaxies.
Subject headings
galaxies: clusters: general — galaxies: evolution — galaxies: structureI. Introduction
High-z studies (as far as ) have found a significant number of massive, passively evolving galaxies (stellar mass ) with relatively small effective radii [36, 5, 39, 38, 29, see, among others,], sometimes named superdense11 1 Regarding physical densities, these galaxies are anyway thought not to be extreme [2, 16, see, e.g.,] galaxies (SDGs). The general claim by various authors is that local galaxies are three to six times larger in size when compared to high-z ones, at the same stellar mass. In addition, Trujillo et al. [35] found a complete absence of massive, old and extremely compact galaxies in the local universe.
However, Valentinuzzi et al. [37] (hereafter V10) have shown that 22% of local cluster members in the WINGS sample with and have the same characteristics of the high-z SDGs reported in the literature by various authors. In the same paper, the authors found that selecting galaxies with old stellar populations is equivalent to selecting the smaller ones, for a given stellar mass. Since a large number of galaxies have stopped forming stars at relatively low redshift (), and these tend to be the largest, it is not valid to compare high-z passive galaxies with all low-z passive ones. To avoid selection effects when making comparisons with passive galaxies at high redshift, one needs to select locally those galaxies which were already passive at the cosmic time the high-z data correspond to.
More recently, Taylor et al. [34] revisited the search of SDGs in SDSS-DR7 and found a relatively small but significant number of SDGs. Following the same criterion used in V10, they find a 1.3% fraction of SDGs.
The issue is much debated. Mancini et al. [20] have analyzed a sample of 12 galaxies at in the Cosmos field, finding masses and sizes compatible with the local SDSS ones. Furthermore, by using a set of simulated early-type galaxies, they have shown that the low signal-to-noise of high-z images can cause measured effective-radii to be lower than the intrinsic values. In a recent paper van Dokkum et al. [40] select galaxies with a constant number density at different cosmic times. They use all galaxies instead of only passive ones, and find that galaxies have grown in size by a factor of 4 from to .
Even more recently, while Szomoru et al. [33] confirm the extreme compactness of a galaxy with the HST-WFC3, Saracco et al. [30] show that the comoving number density of compact ETGs over the volume of about sampled by the GOODS area between is compatible even with the local lower limits given in V10.
In this Letter we present the results of a search for SDGs in the ESO Distant Clusters Survey (EDisCS) at , and we report the comparison of the mass-size relation (MSR) with the same relation in WINGS clusters at . We further discuss selection effects which may introduce a spurious size evolution with redshift if not properly taken into account.
II. The data
The high-z cluster sample is extracted from EDisCS, a multiwavelength photometric and spectroscopic survey of galaxies in 20 fields containing galaxy clusters at [43]. We will use a sub-sample of 8 clusters22 2 Their short names found in other EDisCS’s papers are CL1138,CL1138a, CL1040, CL1216, CL1054-11, CL1054-12, CL1232, CL1354. which have HST-ACS images for high-precision size measurements [7], and cluster central velocity dispersions (, ) similar to local WINGS clusters [14, 21, 7]. Three of these clusters have , the rest of them have .
Galaxy stellar masses were estimated using the kcorrect tool [3]33 3 http://cosmo.nyu.edu/mb144/kcorrect/, that models the available observed broad band photometry (VRIJK, or BVIJK), fitting templates obtained with spectrophotometric models. The stellar masses are defined as the mass locked into stars, including stellar remnants, at any time, using a Kroupa [17] initial mass function (type 2 mass in V10). Taking into account the statistical errors on the mass estimates, the error of the stellar mass on individual galaxies is of the order , even though it has to be taken into account that the scatter (rms) in the relation between masses computed with different models is typically [13, 18, 41, for further details, see]
We use visual morphological classifications from Desai et al. [7].
We measure galaxy effective-radii with the GIM2D tool [32] on the HST images in F814W band, by using a single component Sersic fit. The circularized is determined by numerically integrating the curve of growth of the fitted Sersic model, and solving the equation [for further details, see 27, submitted]. The typical random error on the EDisCS’s sizes is of the order of 20% [31].
We use a mass limited sample of EDisCS spectroscopically confirmed cluster members, with stellar masses . This mass limit corresponds to the mass of an object whose observed magnitude is equal to the faint magnitude limit of the spectroscopic survey, with the reddest possible color. We correct for spectroscopic incompleteness using Milvang-Jensen et al. [21] completeness functions.
The local sample examined in this Letter comes from the WIde-field Nearby Galaxy-clusters Survey [11]. WINGS44 4 http://web.oapd.inaf.it/wings is a multiwavelength photometric and spectroscopic survey designed to provide a robust characterization of the properties of galaxies in nearby clusters.
We use only cluster members of the subset of WINGS clusters that have an average spectroscopic completeness larger than 50% (21 out of 78 clusters), and correct for spectroscopic incompleteness using the prescriptions given in Cava et al. [4]. These WINGS clusters have redshifts and central velocity dispersions .
WINGS effective-radii, axial ratios and Sersic indexes are measured on the V-band images with GASPHOT [22], an automated tool which performs a simultaneous fit of the major and minor axis light growth curves with a 2D flattened Sersic-law, convolved by the appropriate, space-varying PSF. As a measure of galaxy size we use the circularized effective radii, calculated in the same way it was done for EDisCS sizes (see above). We note here that SDG fractions and number densities are updated accordingly in this Letter compared to V10 (see next sections). The maximum error on WINGS sizes, based on extensive simulation runs, is of the order of 10% [22, see,].
As a consistency check on sizes, we run GIM2D on one representative V-band WINGS cluster image, to compare the resulting circularized and Sersic index of galaxies with GASPHOT values. We found a systematic difference in sizes of , in the sense that GASPHOT sizes are larger than GIM2D ones. This difference becomes larger (as far as ) for larger galaxies, somehow confirming that GIM2D has the tendency to systematically underestimate the sizes of the largest galaxies at all luminosities [32, see]. On the other hand, we do not find any systematic difference regarding the Sersic index estimate.
Stellar masses of WINGS galaxies have been determined by fitting the optical spectrum (in the range Å), with the spectro-photometric model fully described in Fritz et al. [13], and correcting for color gradients outside of the fiber (see V10). The model derives the integrated spectrum as the combination of stellar populations of 13 different ages, allowing dust extinction to vary with the stellar population age and using the single metallicity (either Z=0.05, 0.02 or 0.004) that gives the lowest fit of the observed spectrum. Although the masses were calculated in two different ways we have shown in V10 (and soon in Fritz et al. 2010 in prep.) that there is no significant systematic offset between different methods that could be capable of biasing our results.
WINGS morphologies are derived from V images using the purposely devised tool MORPHOT. We have verified that the differences in classification between MORPHOT and an experienced human classifier are comparable to the differences between two experienced human classifiers [10, in preparation].
For the sake of comparing the median sizes of the two surveys, we divide the total sample into four mass intervals, selected to have a statistically significant number of objects in each one of them:
- •
BIN1:
- •
BIN2:
- •
BIN3:
- •
BIN4:
and will refer to them with the label BIN[1-4].
III. EDisCS Superdense Galaxies

In Figure 1 we present the MSR (mass-size relation, bottom panel) and the mass-density relation (top panel) of EDisCS cluster members with . Colors differentiate the morphological types (see caption and legend), large open squares are the brightest cluster galaxies (BCGs) listed in White et al. [43].
In the top panel, the dashed line isolates the EDisCS SDGs (larger dots in both panels) with the same density selection criteria () used in V10, above the mass completeness limit of this Letter. These criteria were chosen to select galaxies with mass and density ranges similar to those of high-z () passively evolving galaxies.
As apparent in Figure 1, we do find a significant number of SDGs in the EDisCS sample. Indeed, EDisCS SDGs represent 41% of the total cluster population of galaxies more massive than . This is an even larger fraction than V10 found in WINGS local clusters, where 17% are SDGs for the mass limits and radii adopted in this Letter. A decline with time of the SDG fraction in clusters might be expected given that a) the “oldest” galaxies in the Universe (those who stopped forming stars very early on) inhabit clusters since very high redshifts, and clusters accrete throughout their history galaxies with more extended star formation histories, and b) as shown in V10, at any given mass the oldest galaxies tend to be the most compact. Therefore the original population of old and compact galaxies in clusters get progressively diluted by larger galaxies infalling into clusters at later times.
Of the EDisCS SDGs, 41% are ellipticals, 36% are S0s, 20% are late-type galaxies, and for 4% of them it was not possible to assign a reliable visual morphological classification. In Table 1 we present the main mean properties of EDisCS SDGs.
| Quantity | EDisCS | WINGS |
|---|---|---|
| SDG fraction | 41% | 17% |
| Ellipticals | 41% | 28% |
| S0s | 36% | 64% |
| Late-type | 20% | 8% |
| Unknown morph. | 3% | - |
| Eff. radius | ||
| Sersic index | ||
| Axial ratio | ||
| Stellar mass |
| WINGS/EDisCS | BIN1 | BIN2 | BIN3 | BIN4 |
|---|---|---|---|---|
| All galaxies | ||||
| Early-type galaxies | ||||
| WINGS Early/EDisCS All |
In the bottom panel of Figure 1 the median MSR of EDisCS galaxies is presented as a black solid line, and compared to the dashed WINGS one. As we did in V10 we excluded BCGs and galaxies with , that are discussed separately below. We find that the median of EDisCS cluster galaxies with is only a factor 1.18 lower than the WINGS one. Considering separate mass bins, the maximum amount of evolution is 1.48 (BIN3, see Table 2), while in the other mass bins the median sizes turn out to be in good agreement.
These numbers may be compared with field studies that are including all morphological and spectral galaxy types. Recently, Williams et al. [44] report a size evolution for all galaxies from to of a factor of . In this regard, we stress that it is hard to draw conclusions from this comparison because it is still unclear how the incidence of SDGs and the evolution of galaxy sizes depend on environment [19, 26, see,].
So far, we have seen that a considerable fraction of EDisCS cluster members are SDGs and that galaxy sizes in EDisCS and WINGS, at all mass ranges considered, are rather similar, and do not suggest a strong increase in size with redshift.
The BCGs and the most massive cluster galaxies with have to be discussed separately, due to their peculiar nature and evolution [9, see, amongst others,]. Indeed, the EDisCS BCGs have mean mass and size of and , respectively. In contrast, WINGS BCGs have mean values of and , suggesting that the mean size and mass of BCGs have increased by a factor of and between and , respectively. Although this result seems in contrast with Whiley et al. [42], we note that the mass of local BCGs in that paper was calculated inside an aperture of 37kpc, which is approximately the median half luminosity circularized radius in V band of our local sample of BCGs. This is consistent with a picture where the BCG progenitors increase their mass via minor mergers in the outer regions, leaving practically unchanged the dense core [15, see]. We also note that the size and mass evolution of our sample of high-z BCGs with redshift is compatible with the observational study of Bernardi [1] and with the theoretical expectations of De Lucia & Blaizot [6], that predict a factor of 3-4 growth in mass between and .
IV. Selection effects
We have seen that the morphological fractions among the EDisCS SDGs are considerably different from WINGS SDGs. The latter show a larger fraction of S0s and a corresponding lower fraction of later types. This is expected, as many studies have come to the conclusion that a large fraction of today’s passive early-type galaxies have evolved from star forming late-type galaxy progenitors in clusters [8, 12, 25, 23].
In V10 we have shown that selecting the oldest cluster galaxies means selecting the smallest in size. In the following, we will highlight the biases that can be introduced by selecting galaxies morphologically, and thus the importance of properly taking into account the morphological change too. Although the morphological evolution is strictly linked to the evolution in star formation activity [23], the time scales can be largely different [24, 28] and thus become important at different cosmic times, in a way difficult to predict.
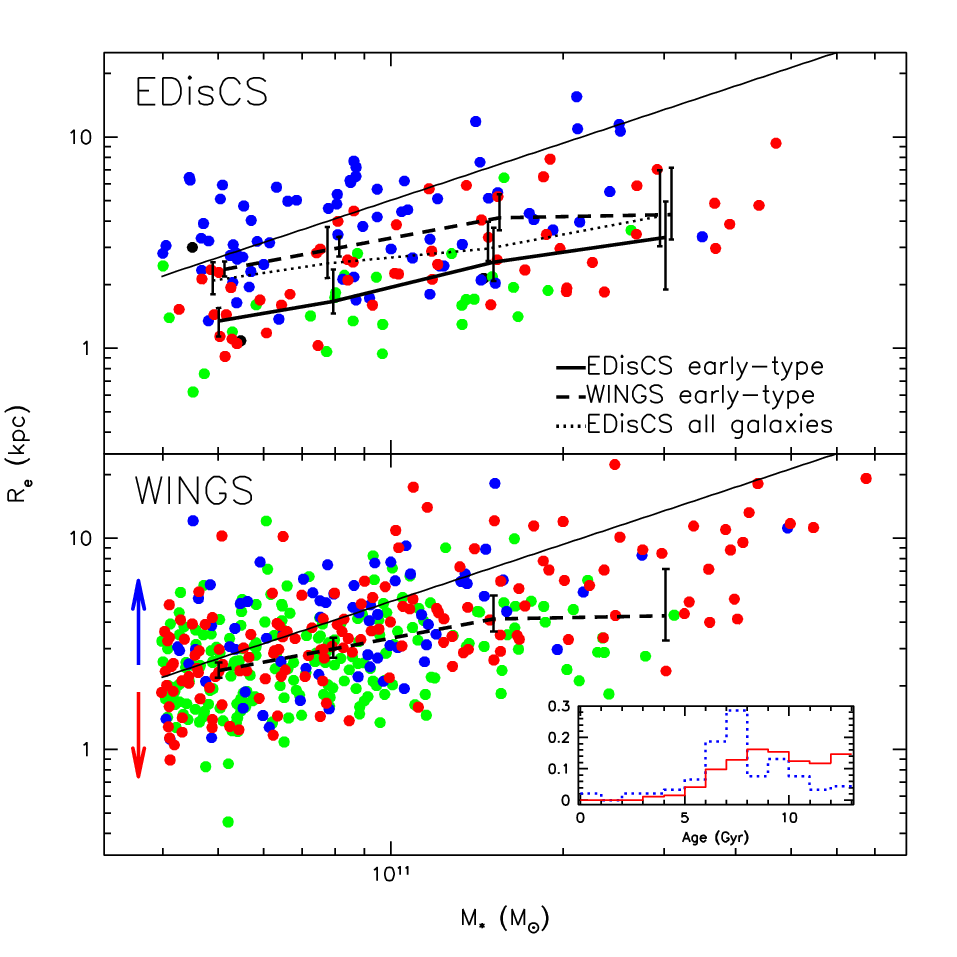
In Figure 2 we compare EDisCS (top panel) and WINGS (bottom panel) MSRs. Color coding is the same as for Figure 1. The black solid and dashed lines show the median MSR for early-type galaxies in EDisCS and WINGS, respectively. Error bars are errors on the medians. The median size of WINGS early-type galaxies is a factor 1.53 larger than EDisCS’s early-types, reaching an offset as large as 1.7 at the lowest masses (BIN1 and BIN2, see Table 2).
At face value, this could be interpreted as an evolution in the sizes of individual early-type galaxies. However, we note that the largest EDisCS cluster members tend to have late-type morphology (some of which are star-forming, , and some passively evolving, ). We have arbitrarily identified a region in the mass-size diagram, above the tilted line drawn in both panels, where EDisCS galaxies are large and all have late-type morphologies. In contrast, WINGS galaxies in this region are mostly (72%) early-types, consistent with a morphological evolution.
A convincing test of this picture is presented in the lower right inset of Figure 2, where the distributions of the luminosity-weighted ages of WINGS early-type galaxies above (blue dashed) and below (red solid) the tilted line is shown. The blue-dotted histogram is visibly sharply peaked toward lower ages, when compared to the red one. This is consistent with a significant fraction of EDisCS large, late-type galaxies having turned into large, passive, early-types by .
Let’s now focus only on late-types turning in S0s. Practically all EDisCS S0s are SDGs (see Figure 1) and most of them are old (81% have Luminosity-weighted-age Gyr, 52% Gyr); in WINGS, instead, a large number of S0s are not SDGs (see Figure 2). On the other hand, among the WINGS SDGs with S0 morphology, only 20% have ages lower than the corresponding EDisCS lookback time, i.e. were most likely morphologically changed at redshifts lower than EDisCS. This is an indication that for the largest galaxies the majority of the morphological transformations took place a few billion years ago, while for most of the compact galaxies both the quenching of star formation and the final morphological type were reached at earlier epochs.
It is clear that when comparing high- with low-z samples, it is of paramount importance to keep in mind that morphologically selecting galaxies at different epochs introduces an apparent, but spurious size evolution with redshift, which instead is a selection effect. Although it is impossible55 5 Because stellar ages cannot be used as a proxy for morphology, given that the timescale for morphological transformation is longer than the timescale for star formation quenching. from the WINGS data to recover which galaxies were early-types at the EDisCS’s epoch, our findings support the hypothesis that the main reason why the median size of WINGS early-type galaxies (dashed line in Figure 2) is much more consistent with the median size of all EDisCS galaxies (dotted line, see also Table 2) than with the size of only EDisCS early-types is that the largest late-type EDisCS’s galaxies have gradually become earlier types by the WINGS epoch.
V. Discussion and conclusion
We have found that 41% of EDisCS galaxies with are SDGs. Their properties are similar to WINGS SDGs, apart for a significantly different morphological mix: the prevalence of S0s in WINGS is not found in EDisCS.
Such a result is not unexpected, given our previous findings: in V10 we have found that 17% (for the mass limits and radii adopted here) of WINGS clusters members at are SDGs. More than 50% of them have stellar ages older than 9Gyr, a clear indication that they were already old and compact at the EDisCS’s epoch. The evolution of the SDG fraction in clusters with redshift is expected if SDGs are massive and old galaxies, formed in clusters seeds and preferentially found in today’s massive clusters, while they are rarer in the field [34, see] and therefore in the population of galaxies infalling into clusters at later and later times.
We find that when galaxies of all morphological types are considered, the median size of cluster galaxies at is only a factor 1.18 smaller than the local median. We conclude that from to , there is at most a very modest evolution in galaxy sizes in clusters.
Similarly to our V10 analysis of age selection effects, we have shown that comparing high-z morphologically selected samples with local ones can be misleading. In agreement with previous results regarding the morphological evolution in clusters, we have found that the largest EDisCS late-type galaxies are found to be large early-types in WINGS clusters, as it is apparent studying the morphologies above the tilted line in Figure 2.The BCGs, instead, have been found to evolve both in mass (a factor of ) and size (a factor of ), in agreement with other recent theoretical and observational results.
Our findings show that the progenitor bias (in age or morphology) plays an important role in the size-growth paradigm, and must be carefully taken into account when comparing local galaxy sizes with those of massive high-z galaxies.
References
- [1] Bernardi, M. 2009, MNRAS, 395, 1491
- [2] Bezanson, R., van Dokkum, P. G., Tal, T., Marchesini, D., Kriek, M., Franx, M., & Coppi, P. 2009, ApJ, 697, 1290
- [3] Blanton, M. R., & Roweis, S. 2007, AJ, 133, 734
- [4] Cava, A., Bettoni, D., Poggianti, B. M., Couch, W. J., Moles, M., Varela, J., Biviano, A., D’Onofrio, M., Dressler, A., Fasano, G., Fritz, J., Kjærgaard, P., Ramella, M., & Valentinuzzi, T. 2009, A&A, 495, 707
- [5] Cimatti, A., Cassata, P., Pozzetti, L., Kurk, J., Mignoli, M., Renzini, A., Daddi, E., Bolzonella, M., Brusa, M., Rodighiero, G., Dickinson, M., Franceschini, A., Zamorani, G., Berta, S., Rosati, P., & Halliday, C. 2008, A&A, 482, 21
- [6] De Lucia, G., & Blaizot, J. 2007, MNRAS, 375, 2
- [7] Desai, V., Dalcanton, J. J., Aragón-Salamanca, A., Jablonka, P., Poggianti, B., Gogarten, S. M., Simard, L., Milvang-Jensen, B., Rudnick, G., Zaritsky, D., Clowe, D., Halliday, C., Pelló, R., Saglia, R., & White, S. 2007, ApJ, 660, 1151
- [8] Dressler, A., Oemler, Jr., A., Couch, W. J., Smail, I., Ellis, R. S., Barger, A., Butcher, H., Poggianti, B. M., & Sharples, R. M. 1997, ApJ, 490, 577
- [9] Fasano, G., Bettoni, D., Ascaso, B., Tormen, G., Poggianti, B. M., Valentinuzzi, T., D’Onofrio, M., Fritz, J., Moretti, A., Omizzolo, A., Cava, A., Moles, M., Dressler, A., Couch, W. J., Kjaergaard, P., & Varrela, J. 2010a, ArXiv e-prints
- [10] Fasano, G., Fritz, J., Poggianti, B. M., Cava, A., Bettoni, D., B. M., Couch, W. J., Moles, M., Varela, J., Biviano, A., D’Onofrio, M., Dressler, A., , Kjaergaard, P., Ramella, M., & Valentinuzzi, T. 2010b, in preparation
- [11] Fasano, G., Marmo, C., Varela, J., D’Onofrio, M., Poggianti, B. M., Moles, M., Pignatelli, E., Bettoni, D., Kjærgaard, P., Rizzi, L., Couch, W. J., & Dressler, A. 2006, A&A, 445, 805
- [12] Fasano, G., Poggianti, B. M., Couch, W. J., Bettoni, D., Kjærgaard, P., & Moles, M. 2000, ApJ, 542, 673
- [13] Fritz, J., Poggianti, B. M., Bettoni, D., Cava, A., Couch, W. J., D’Onofrio, M., Dressler, A., Fasano, G., Kjærgaard, P., Moles, M., & Varela, J. 2007, A&A, 470, 137
- [14] Halliday, C., Milvang-Jensen, B., Poirier, S., Poggianti, B. M., Jablonka, P., Aragón-Salamanca, A., Saglia, R. P., De Lucia, G., Pelló, R., Simard, L., Clowe, D. I., Rudnick, G., Dalcanton, J. J., White, S. D. M., & Zaritsky, D. 2004, A&A, 427, 397
- [15] Hopkins, P. F., Bundy, K., Hernquist, L., Wuyts, S., & Cox, T. J. 2010, MNRAS, 401, 1099
- [16] Hopkins, P. F., Bundy, K., Murray, N., Quataert, E., Lauer, T. R., & Ma, C. 2009, MNRAS, 398, 898
- [17] Kroupa, P. 2001, MNRAS, 322, 231
- [18] Longhetti, M., & Saracco, P. 2009, MNRAS, 394, 774
- [19] Maltby, D. T., Aragón-Salamanca, A., Gray, M. E., Barden, M., Häußler, B., Wolf, C., Peng, C. Y., Jahnke, K., McIntosh, D. H., Böhm, A., & van Kampen, E. 2010, MNRAS, 402, 282
- [20] Mancini, C., Matute, I., Cimatti, A., Daddi, E., Dickinson, M., Rodighiero, G., Bolzonella, M., & Pozzetti, L. 2010, A&A, 500, 705
- [21] Milvang-Jensen, B., Noll, S., Halliday, C., Poggianti, B. M., Jablonka, P., Aragón-Salamanca, A., Saglia, R. P., Nowak, N., von der Linden, A., De Lucia, G., Pelló, R., Moustakas, J., Poirier, S., Bamford, S. P., Clowe, D. I., Dalcanton, J. J., Rudnick, G. H., Simard, L., White, S. D. M., & Zaritsky, D. 2008, A&A, 482, 419
- [22] Pignatelli, E., Fasano, G., & Cassata, P. 2006, A&A, 446, 373
- [23] Poggianti, B. M., Fasano, G., Bettoni, D., Cava, A., Dressler, A., Vanzella, E., Varela, J., Couch, W. J., D’Onofrio, M., Fritz, J., Kjaergaard, P., Moles, M., & Valentinuzzi, T. 2009, ApJ, 697, L137
- [24] Poggianti, B. M., Smail, I., Dressler, A., Couch, W. J., Barger, A. J., Butcher, H., Ellis, R. S., & Oemler, Jr., A. 1999, ApJ, 518, 576
- [25] Postman, M., Franx, M., Cross, N. J. G., Holden, B., Ford, H. C., Illingworth, G. D., Goto, T., Demarco, R., Rosati, P., Blakeslee, J. P., Tran, K., Benítez, N., Clampin, M., Hartig, G. F., Homeier, N., Ardila, D. R., Bartko, F., Bouwens, R. J., Bradley, L. D., Broadhurst, T. J., Brown, R. A., Burrows, C. J., Cheng, E. S., Feldman, P. D., Golimowski, D. A., Gronwall, C., Infante, L., Kimble, R. A., Krist, J. E., Lesser, M. P., Martel, A. R., Mei, S., Menanteau, F., Meurer, G. R., Miley, G. K., Motta, V., Sirianni, M., Sparks, W. B., Tran, H. D., Tsvetanov, Z. I., White, R. L., & Zheng, W. 2005, ApJ, 623, 721
- [26] Rettura, A., Rosati, P., Nonino, M., Fosbury, R. A. E., Gobat, R., Menci, N., Strazzullo, V., Mei, S., Demarco, R., & Ford, H. C. 2010, ApJ, 709, 512
- [27] Saglia, R., Sánchez-Blázquez, P., Bender, R., Simard, L., Desai, V., Aragón-Salamanca, A., Milvang-Jensen, B., Halliday, C., Jablonka, P., Noll, S., Poggianti, B., Clowe, D. I., De Lucia, G., Pelló, R., Rudnick, G., Valentinuzzi, T., R. White, S. D. M., & Zaritsky, D. 2010, submitted to A&A
- [28] Sánchez-Blázquez, P., Jablonka, P., Noll, S., Poggianti, B. M., Moustakas, J., Milvang-Jensen, B., Halliday, C., Aragón-Salamanca, A., Saglia, R. P., Desai, V., De Lucia, G., Clowe, D. I., Pelló, R., Rudnick, G., Simard, L., White, S. D. M., & Zaritsky, D. 2009, A&A, 499, 47
- [29] Saracco, P., Longhetti, M., & Andreon, S. 2009, MNRAS, 392, 718
- [30] Saracco, P., Longhetti, M., & Gargiulo, A. 2010, ArXiv e-prints
- [31] Simard, L., Clowe, D., Desai, V., Dalcanton, J. J., von der Linden, A., Poggianti, B. M., White, S. D. M., Aragón-Salamanca, A., De Lucia, G., Halliday, C., Jablonka, P., Milvang-Jensen, B., Saglia, R. P., Pelló, R., Rudnick, G. H., & Zaritsky, D. 2009, A&A, 508, 1141
- [32] Simard, L., Willmer, C. N. A., Vogt, N. P., Sarajedini, V. L., Phillips, A. C., Weiner, B. J., Koo, D. C., Im, M., Illingworth, G. D., & Faber, S. M. 2002, ApJS, 142, 1
- [33] Szomoru, D., Franx, M., van Dokkum, P. G., Trenti, M., Illingworth, G. D., Labbé, I., Bouwens, R. J., Oesch, P. A., & Carollo, C. M. 2010, ApJ, 714, L244
- [34] Taylor, E. N., Franx, M., Glazebrook, K., Brinchmann, J., van der Wel, A., & van Dokkum, P. G. 2009, ArXiv e-prints
- [35] Trujillo, I., Cenarro, A. J., de Lorenzo-Cáceres, A., Vazdekis, A., de la Rosa, I. G., & Cava, A. 2009, ApJ, 692, L118
- [36] Trujillo, I., Förster Schreiber, N. M., Rudnick, G., Barden, M., Franx, M., Rix, H.-W., Caldwell, J. A. R., McIntosh, D. H., Toft, S., Häussler, B., Zirm, A., van Dokkum, P. G., Labbé, I., Moorwood, A., Röttgering, H., van der Wel, A., van der Werf, P., & van Starkenburg, L. 2006, ApJ, 650, 18
- [37] Valentinuzzi, T., Fritz, J., Poggianti, B. M., Cava, A., Bettoni, D., Fasano, G., D’Onofrio, M., Couch, W. J., Dressler, A., Moles, M., Moretti, A., Omizzolo, A., Kjærgaard, P., Vanzella, E., & Varela, J. 2010, ApJ, 712, 226
- [38] van der Wel, A., Bell, E. F., van den Bosch, F. C., Gallazzi, A., & Rix, H.-W. 2009, ApJ, 698, 1232
- [39] van Dokkum, P. G., Franx, M., Kriek, M., Holden, B., Illingworth, G. D., Magee, D., Bouwens, R., Marchesini, D., Quadri, R., Rudnick, G., Taylor, E. N., & Toft, S. 2008, ApJ, 677, L5
- [40] van Dokkum, P. G., Whitaker, K. E., Brammer, G., Franx, M., Kriek, M., Labbé, I., Marchesini, D., Quadri, R., Bezanson, R., Illingworth, G. D., Muzzin, A., Rudnick, G., Tal, T., & Wake, D. 2010, ApJ, 709, 1018
- [41] Vulcani, B., Poggianti, B. M., Finn, R. A., Rudnick, G., Desai, V., & Bamford, S. 2010, ApJ, 710, L1
- [42] Whiley, I. M., Aragón-Salamanca, A., De Lucia, G., von der Linden, A., Bamford, S. P., Best, P., Bremer, M. N., Jablonka, P., Johnson, O., Milvang-Jensen, B., Noll, S., Poggianti, B. M., Rudnick, G., Saglia, R., White, S., & Zaritsky, D. 2008, MNRAS, 387, 1253
- [43] White, S. D. M., Clowe, D. I., Simard, L., Rudnick, G., De Lucia, G., Aragón-Salamanca, A., Bender, R., Best, P., Bremer, M., Charlot, S., Dalcanton, J., Dantel, M., Desai, V., Fort, B., Halliday, C., Jablonka, P., Kauffmann, G., Mellier, Y., Milvang-Jensen, B., Pelló, R., Poggianti, B., Poirier, S., Rottgering, H., Saglia, R., Schneider, P., & Zaritsky, D. 2005, A&A, 444, 365
- [44] Williams, R. J., Quadri, R. F., Franx, M., van Dokkum, P., Toft, S., Kriek, M., & Labbé, I. 2010, ApJ, 713, 738