Precise, Scalable and Online Request Tracing for Multi-tier Services of Black Boxes
Abstract
As more and more multi-tier services are developed from commercial off-the-shelf components or heterogeneous middleware without source code available, both developers and administrators need a request tracing tool to (1) exactly know how a user request of interest travels through services of black boxes; (2) obtain macro-level user request behavior information of services without the necessity of inundating within massive logs. This need is further exacerbated by the IT system ”agility”[22], which mandates the tracing tool to on-line offer performance data since off-line approaches can not reflect system changes in real time. Moreover, taking it into account the large scale of deployed services, a pragmatic tracing approach should be scalable in terms of the cost in collecting and analyzing logs.
Previous research efforts either accept imprecision of probabilistic correlation methods or present precise but unscalable tracing approaches that have to collect and analyze large amount of logs; Besides, previous precise request tracing approaches of black boxes fail to propose macro-level abstractions that enables debugging performance-in-the-large, and hence users have to manually interpret massive logs. This paper introduces a precise, scalable and online request tracing tool, named PreciseTracer, for multi-tier services of black boxes. Our contributions are four-fold: first, we propose a precise request tracing algorithm for multi-tier services of black boxes, which only uses application-independent knowledge; second, we respectively present micro-level and macro-level abstractions: component activity graphs and dominated causal path patterns to represent causal paths of each individual request and repeatedly executed causal paths that account for significant fractions; third, we present two mechanisms: tracing on demand and sampling to significantly increase system scalability; fourth, we design and implement an online request tracing tool. PreciseTracer’s fast response, low overhead and scalability make it a promising tracing tool for large-scale production systems.
Index Terms:
Multi-tier service, black boxes, precise request tracing, micro and macro-level abstractions, online analysis, scalability.I Introduction
11 1 This is an extended work of our paper: Z. Zhang, J. Zhan, Y. Li, L. Wang and D. Meng, Precise request tracing and performance debugging for multi-tier services of black boxes, The 39th IEEE/IFIP International Conference on Dependable Systems & Networks (DSN ’09), 2009.As more and more multi-tier services are developed from commercial off-the-shelf components or heterogeneous middleware without source code available, both developers and administrators need a request tracing tool to (1) exactly know how a user request of interest travels through services of black boxes if necessary; (2) obtain macro-level performance information of services without the necessity of inundating within massive logs. This need is further exacerbated by IT system ¡°agility¡±[22]. For example, in data centers, service customers increasingly require support for peak loads that are an order of magnitude greater than those experienced in normal steady state [30]. To meet with fluctuated workloads, resources are often dynamically provisioned, and hence service instances are adjusted accordingly. In this context, system agility mandates tracing tools to on-line offer performance information, since off-line tracing approaches can not reflect system changes in real time.
There are several challenges in proposing a request tracing tool for on-line analysis of multi-tier services of black boxes. First of all, those tools should not produce disturbed impact on performance of multi-tier services. Second, services are often deployed within data centers with a large scale, and hence a pragmatic tracing tool should be scalable in terms of the cost in collecting and analyzing logs[27]. Finally, administrators not only needs to exactly track a user request of interest if necessary, but also needs to focus on performance-in-the-large [4]. A precise request tracing system will inevitably produce massive logs, however debugging inundated with massive logs is not a trivial issue, and hence we need to propose macro-level abstractions to facilitate debugging performance-in-the-large of multi-tier services.
The most straightforward and accurate way [27][11] [1] [10] [15][12] to correlate message streams is to leverage application-specific knowledge and explicitly declare causal relationships among events of different components. The disadvantage is that user must obtain and modify source code of target applications or middleware, or even require that users have in-depth knowledge of target applications or instrumented middleware, and hence they cannot be used for services of black boxes. Without the knowledge of source code, several previous approaches [4][3][7] either accept imprecision of probabilistic correlation methods to infer average response time of components[22], or [5] rely upon the knowledge of protocols to isolate events or requests for precise request tracing. Probably closest to our work is vPath [22], which presents a precise but unscalable request tracing tool for services of black boxes. Because of its implementation limitation, the tracing mechanism in vPath can not be enabled or disabled on demand without interrupting services, and hence it has to continuously collect and analyze logs, which results in unacceptable cost. For example, as stated in [2], a simple e-commercial system would generates log data per minute. Usually, a data center has thousands or even more nodes being deployed with multi-tier services. If we debug performance problems of multi-tier services on this scale for one minute, a tracing system with continuous logging needs to analyze at least logs, which in nature is unscalable. Moreover, state-of-the-art precise requesting tracing approaches of black boxes [5] [22] fail to propose abstractions for representing macro-level user request behaviors, and instead depend on users’ manual interpretation of logs in debugging performance-in-the-large. Besides, they [5] [22] are offline.
In this paper, we present a precise and scalable request tracing tool for online analysis of multi-tier services of black-boxes. Our tool collects activity logs of multi-tier services through kernel instrumentation, which can be enabled or disabled on demand. Through tolerating loss of logs, our system supports sampling or tracing on demand, which significantly decreases the collected and analyzed logs and hence improves the system scalability. After reconstructing those activity logs into causal paths, each of which is a sequence of activities with causal relations caused by an individual request, we classify those causal paths into different patterns according to their shapes, and present an macro-level abstraction, dominated causal path patterns, to represent repeatedly executed causal paths that account for significant fractions. Finally, we detect performance problems through observing changes of performance data of dominated causal path patterns. In this paper, we make the following contributions:
- 1.
We design a precise tracing algorithm to deduce causal paths of requests from interaction activities of components of black boxes. Our algorithm only uses application-independent knowledge.
- 2.
We present two abstractions: component activity graphs and dominated causal path patterns to respectively represent micro-level and macro-level user request behaviors of services.
- 3.
We present two mechanisms: tracing on demand and sampling, to improve system scalability. Our experiments show sampling decreases the cost of collecting and analyzing logs, and at the same time still preserves performance data of services in the way that it captures most of dominated causal path patterns.
- 4.
We design and implement an online request tracing system. Our experiments demonstrate that the fast response, low overhead and robustness of PreciseTracer make it a promising tracing tool for large-scale production systems.
II Problem statement
Our target environments are data centers deployed with multi-tier services. There are two types of nodes in this environment: service nodes and analysis nodes. Service nodes are the ones on which multi-tier services are deployed, while most component of the tracing tool are deployed on analysis nodes.
We treat each component in a multi-tiers service as a black box. That is to say we can not obtain the application or middleware source code. In Fig. 1, we observe that a request will cause a series of interaction activities in the operating system kernel , e.g. sending or receiving messages. Those activities happen under specific contexts (processes or kernel threads) of different components. We record an activity of sending a message as , which indicates a process sends a message to a process . We record an activity of receiving a message as , which indicates a process receives a message from a process .

When an individual request is serviced, a series of activities having causal relations or happened-before relationships as defined by Lamport [8] constitute a causal path. For example in Fig. 1, the activities sequence {} constitutes a causal path. For each individual request, there is a causal path.
Our project develops a tracing tool to help developers and administrators in the following ways:
- 1.
Precisely correlate activities of components caused by each request into individual causal paths, through which user can exactly track how a user request of interest travels through services.
- 2.
Identify dominated causal path patterns, and obtain their statistic information, e.g. the average service time of each component in different patterns.
- 3.
- 4.
Provide online performance data of services for the feedback controller in the runtime power management system to save cluster power consumption, which is resolved in our another research project[32].
The application limits of our system are as follows:
- 1.
We do not require source code of applications, neither deploy the instrumented middleware, and neither have the knowledge of high-level protocols used by services, like http etc.
- 2.
A single execution entity (a process or a kernel thread) of each component can only service one request in a certain period. For serving each individual request, execution entities of components cooperate through sending or receiving messages using a reliable communication protocol, like TCP.
Though not all multi-tier services fall within the scope of our target applications, fortunately many popular services satisfy these assumptions. For example, our method can be used to analyze concurrent servers following nine design patterns introduced in [6], including iteration model, concurrent process model and concurrent thread model.
III Related work
| accuracy | scalability | request abstraction | mode | |
| Project5 | imprecise | / | macro level | offline |
| E2EProf | imprecise | / | macro level | online |
| BorderPatrol | precise | continuous logging | micro level | offline |
| vPath | precise | continuous logging | micro level | offline |
| Our tool | precise | sampling & tracing on demand | micro/macro levels | online |
Imprecise black-box approaches. A much earlier project, DPM [9] instruments the operating system kernel and tracks the causality between pairs of message to trace unmodified applications. DPM is not precise, since the existence of a path in resulting graphs does not necessarily mean that any real causal path followed all of those edges in that sequence [5]. Project5 [4] and WAP5 [3] accept imprecision of probabilistic correlations. Project5 proposes two algorithms intended for offline analysis: a nesting algorithm assumes ’RPC-style’ (call-returns) communication, while a convolution algorithm does not assure a particular messaging protocol. The nesting algorithm only uses one timestamp per message[3] without distinguishing SEND or RECEIVE timestamp, and hence it only provides aggregate information per component. The convolution algorithm only infers average response time of components, and can not build individual causal paths (micro-level request abstraction) for each request. More recently WAP5 [3] infers causal paths for wide-area systems from tracing stream on a per-process granularity using library interposition. Similar to the convolution algorithm of Project5, E2Eprof [7] proposes a pathmap algorithm, and uses compact trace representations and a series of optimizations make it suitable for online performance diagnosis. As claimed by themselves [7], E2EProf only tolerate small clock skews (i.e., equal to few times of the time quanta in term of milliseconds), when determining service paths. If the skew is large, analysis results will not be accurate. Adopting probabilistic correlation in those approaches [4][3][7] should facilitate reducing the cost in collecting and analyzing logs, though the system scalability is not demonstrated in [4] [7] [3].
Precise black-box approaches. There are only two precise black-box approaches: BorderPatrol and vPath, which are offline and can not offer performance information in real time. With the knowledge of diverse protocols used by multi-tier service, BorderPatrol isolates and schedules events or requests at the protocol level to precisely trace requests. When multi-tier services are developed from commercial components or heterogeneous middleware, BorderPatrol needs to write many protocol processors and requires more specialized knowledge than pure black-box approach [5]. VPath consists of an monitor and an offline log analyzer. The monitor continuously logs which thread performs a send or recv system call over which TCP connection. The offline log analyzer parses logs generated by the monitor to discover request-processing paths. The monitor is implemented in virtual machine monitor (VMM) through system call interceptions. Using library interposition (BorderPatrol) or system call interception(vPath) , the logging mechanism of BorderPatrol or vPath can not be enabled or disabled on demand without interrupting services, and hence it is unscalable in terms of the cost of collecting and analyzing logs. Beside, BorderPatrol and vPath fails to present macro-level abstractions to facilitate debugging performance-in-the-large, and users have to inundate within massive logs with great efforts.
The most invasive systems, such as Netlogger [10] and ETE [11] require programmers to add event logging to carefully-chosen points to find causal paths rather than infer them from passive traces. Pip [13] inserts annotations into source code to log actual system behaviors, but can extract causal path information with no false positives or false negatives. Magpie [1] collects events at different points in a system and uses an event schema to correlate these events into causal paths. In order to track a request from end to end, magpie must obtain the source code of application, at least require ”wrapper” around some part of the application [4]. Stardust [12], a system used as an on-line monitoring tool in a distributed storage system, is implemented in a similar way. Whodunit [14] annotates profile data with transaction context synopsis, and tracks and profiles transactions that flow through shared memory, events, or via inter- process communication using messages, which provides finer grained knowledge of transactions and their profile data within each box.
To avoid modifying applications’ source code, several previous efforts enforce middleware or infrastructure change, bound to specific middleware or deployed instrumented infrastructure. Pinpoint [15] locates component faults in J2EE platforms by tagging and propagating a globally unique request ID with each request. Causeway [16] enforces change to network protocol so as to tag meta-data with existing module communication. X-Trace [17] modifies each network layer to carry X-Trace meta-data that enables path casual path reconstruction and focuses on debugging paths through many network layers. The recent Google technical report shows that its production tracing infrastructure Dapper uses a global identifier to tie together related events from various parts of a distributed system. Dapper uses sampling to improve system scalability and reduce performance overhead. With the support of logging mechanism of Hadoop, J. Tan et al. [28] presented a non-intrusive approach to tracing the causality of execution in MapReduce systems, which is significantly different from multi-tier services.
IV PreciseTracer Design and Implementation
Section IV-A, IV-B, IV-C and Section IV-D respectively presents PreciseTracer architecture, tracing algorithm, system scalability issue and system implementation.
IV-A PreciseTracer Architecture

PreciseTracer is flexible, and administrators could configure the system according to their requirements. PreciseTracer could work under a offline model or an online model. Under an offline model, PreciseTracer only analyze logs after collecting logs for the specified period, which is often quite a long time. Under an online model, PreciseTracer will collect and analyze logs simultaneously, providing administrators with real-time performance information.
Fig 2 shows PreciseTracer architecture, including three major components: TCP_Tracer, Correlator and Analyzer. TCP_Tracer logs all interaction activities of components, and provides Correlator with logs of multi-tier service. Correlator is responsible for correlating those activity logs of different components into causal paths. Finally based on causal paths produced by Correlator, Analyzer extracts useful information and outputs analysis results.
IV-A1 TCP_Tracer
TCP_Tracer includes two modules: Gather and Coordinator. Deployed on each service node, Gather is responsible for collecting logs of services deployed on the same node. Coordinator, which is deployed on a analysis node, is in charge of controlling Gather modules on each service node. Coordinator configures and synchronies Gather modules to send logs to Correlator deployed on a analysis node.
TCP_Tracer independently observe interaction activities of components of black boxes on different nodes. Concentrating on the main focus, TCP_Tracer only concern about when serving a request starts, finishes, and when components receive or send messages within the confine of a data center. Of course, we can extend our concerns to observe more activities if the overhead is acceptable. In this paper, our concerned activities types include: BEGIN, END, SEND, and RECEIVE. SEND and RECEIVE activities are the ones of sending and receiving messages. A BEGIN activity marks the start of serving a new request, while an END activity marks the end of servicing a request.
For each activity, TCP_Tracer log five attributes: activity type, timestamp, context identifier, message identifier and message size. For each activity, we use (hostname, program name, process ID, thread ID) tuple to describe its context identifier, and use (IP of sender, port of sender, IP of receiver, port of receiver, message size) tuple to describe its message identifier.
IV-A2 Correlator
Correlator includes two major modules: Ranker and Engine. Ranker is responsible for choosing candidate activities for composing causal paths; Engine constructs causal paths from the outputs of Ranker, and then outputs them.
Formally, a causal path can be described as a directed acyclic graph , where vertices are activities set of components, and edges represent causal relations between activities. We define this abstraction as component activity graph (CAG). For an individual request, a corresponding CAG represents all activities with causal relations in the life cycle of serving an individual request.
CAGs include two types of relations: adjacent context relation and message relation. We formally define two relations based on the happened-before relation [8], which is denoted as , as follows:
Adjacent Context Relation: caused by the same request , and are activities observed in the same context (a process or a kernel thread), and holds true. If no activity that satisfies the relations and is observed in the same context, we can say an adjacent context relation exits between and , denoted as . So the adjacent context relation means that has happened right before in the same execution entity.
Message Relation: for serving a request , if is a SEND activity, which sends a message , and is a RECEIVE activity, which receives the same message , then we can say a message relation exists between and , denoted as . So the message relation means that , which sends a message, has happened right before , which receives a message, in two different execution entities.
If there is an edge from activity to activity in a CAG, for which or holds true, then is the parent of .
In a CAG, every activity vertex must satisfy the property: each activity vertex has no more than two parents, and only a RECEIVE activity vertex could have two parents, with which one parent has an adjacent context relation and another one has a message relation.
For an individual request, it is clear that correlating a causal path is the course of building a CAG with interaction activities as the input. Fig.3 shows an example of an individual CAG.

IV-A3 Analyzer
Analyzer includes two major modules: classifier and extractor. Classifier is responsible for classifying causal paths into different causal path patterns, while Extractor provides analysis results based on causal path patterns.
CAGs include rich performance data of services, because a CAG indicates how a request from clients is served by each component. For example, if administrators want to pinpoint the performance bottleneck of a service, they need to obtain the service time consumed on each component in serving requests. According to a CAG, we can calculate latencies of components in serving an individual request. For example, for the request in Fig. 1, the latency of process 2 is , and the interaction latency from process 1 to process 2 is , where is the local timestamp of each activity. The latency of process 2 is accurate, since all timestamps are from the same node. The interaction latency from process 1 to process 2 is inaccurate, since we do not remedy the clock skew between two nodes.
A single causal path could help administrators get micro-level user request information of services. For example, administrators could detect failed nodes if some causal paths show abnormal information. However, causal paths could not be directly utilized to represent macro-level performance data of services directly for two reasons: (1) There are massively causal paths. An individual causal path could only reflect how a request was served by services. To consider the disturbances in environment, it’s not so credible to take an individual causal path as service’s performance data; (2) different types of requests would produce causal paths with different features. Thus, we need a macro-level abstraction to represent performance data of multi-tier services.
We can classify causal paths into different causal path patterns according to shapes of CAGs, and further figure out which ones are dominated causal path patterns according to their fractions in terms of path number. CAGs could be classified into the same causal path pattern when they meets with the following criteria:
- 1.
There are the same number of activities in two CAGs;
- 2.
Two matching activities with the same order in two respective CAGs have the same attribution in terms of (activity type, program name).
In a CAG, for each activity, we define its order according to the following rules:
Rule 1: If or , then ;
Rule 2: If and and there is no relation between and , then ;
Rule 3: If and and there is no relation between and , then .
After the classification, we could compute the average performance data about dominated causal path patterns, on a basis of which we could further detect performance problems of multi-tier service. Our experiments in Section V-F2 demonstrate the effectiveness of this approach.
IV-B The tracing algorithm
Before we proceed to introduce the algorithm of ranker, we explain how engine stores incomplete CAGs. In the course of building CAGS, all incomplete CAGs are indexed with two index map data structures. An index map maps a key to a value, and supports basic operations, like search, insertion and deletion. One index map, named mmap, is used to match message relations, and another one, named cmap, is used to match adjacent context relations. For mmap, the key is the message identifier of an activity, and the value of mmap is an unmatched SEND activity with the same message identifier. The key in cmap is the context identifier of an activity, and the value of cmap is the latest activity with the same context identifier .
Section IV-B1 explains how to choose candidate activities in constructing CAGs in our algorithm; Section IV-B2 introduces how to construct CAGs; and Section IV-B3 describes how to handle disturbances.
IV-B1 Choosing candidate activities for composting CAGs
For each service node, we choose the minimal local timestamp of activities as the initial time. We set a sliding time window for processing activity stream, and activities, logged on different nodes, will be fetched into the buffer of Ranker if their timestamps are within the sliding time window. Section IV-B3 will present to how to deal with clock skews in distributed systems.
Ranker puts each activity into several different queues according to the IP address of its context identifier. Naturally, activities in the same queue are sorted according to the same local clock, so Ranker only need to compare head activities of each queue and select candidate activities for composing CAGs according to the following rules:
Rule 1: If a head activity in a queue has RECEIVE type and ranker had found an activity in the mmap, of which holds true, then is the candidate.
If a key is the message identifier of an activity and the value of the mmap points to a SEND activity with the same message identifier, we can say .
Rule 1 ensures that when a SEND activity has became a candidate and been delivered to engine, the RECEIVE activity having message relation with it will also become a candidate once it becomes a head activity in its queue.
Rule 2: If no head activity is qualified with Rule 1, then ranker compares the type of head activities in each queue according to the priority of . Finally the head activity with the lower priority is the candidate.
Rule 2 ensures that a SEND activity always becomes a candidate earlier than a RECEIVE activity , if holds true.
After a candidate activity is chosen, it will be popped out from its queue and delivered to engine, and engine matches the candidate with an incomplete CAG. Then the element next to the popped candidate will become a new head activity in that queue. At the same time, ranker will update the new minimal timestamp in the sliding time window and fetch new qualified activities into the buffer of ranker in a new round.
IV-B2 Constructing CAG
Engine fetches a candidate, outputted by Ranker, and matches it with an incomplete CAG. The following pseudo-code illustrates the correlation algorithm. In line 1, engine iteratively fetches a candidate activity current by calling rank() function of Ranker, introduced in Section IV-B1. From line 2-34, Engine parses and handles activity current according to its activity type. Line 3-11 handles BEGIN and END activities. For BEGIN activity, a new CAG is created. For END activity, the construction of its matched CAG is finished.
Procedure correlate {
1: while (current=ranker.rank ( ))
2: switch (currentget_type ( ))
3: case BEGIN:
4: create a CAG with current as its root;
5: case END:
6: find the matched parent where parentcurrent;
7: if (the match is found)
8: add current into the matched CAG;
9: add an adjacent context edge from parent to current;
10: output CAG;
11: }
12: case SEND:
13: find matched parent_msg where parent_msgcurrent;
14: if (the match is found) {
15: If ( parent_msg.type==SEND£©}{
16: parent_msg.size current.size;
17: else
18: add current into the matched CAG.
19: add an adjacent context edge from parent_msg to current.
20: }
21: }
22: case RECEIVE:
23: find matched parent_msg where parent_msgcurrent;
24: if (the match is found) {
25: parent_msg.size-=current.size;
26: if (parent_msg.size 0) {
27: add current into the matched CAG;
28: add a message edge from parent_msg to current;
29: find matched parent_cntx where parent_cntxcurrent;
30: if (the match is found)
31: if (parent_msg and parent_cntx are in the same CAG)
32: add a context edge from parent_cntx to current;
33: }
34: }
35: }//switch
36:}//while
37:}//correlate
Line 12-34 handle SEND and RECEIVE activities. Activities are inherently asymmetric between a sender and a receiver because of their underlying buffer sizes and delivery mechanism, and hence a match between SEND and RECEIVE activities is not always one-to-one, but n-to-n relations. Fig.4 shows a case that a sender consecutively sends a message in two parts and a receiver receives messages in three parts. Our algorithm correlates and merges these activities according to message sizes in message identifiers.

A situation may happen that an activity is wrongly correlated into two causal paths because of reusing threads in some concurrent programming paradigms. For example in a thread-pool implementation, one thread may serve one request at a time. When the work is done, the thread is recycled into the thread pool. Line 30-31 check if the two parents are in the same CAG. If the check returns true, Engine will add an edge of context relation, or else not.
IV-B3 Disturbance tolerance
In a clean environment without disturbance, our algorithm in Section IV-B1 and Section IV-B2 can produce correct causal paths. But in a practical environment, there are many disturbances. In the rest of this subsection, we consider how to resolve noise activities disturbance, concurrency disturbance, and clock skew disturbance.
Noise activities disturbance: Noise activities are caused by other applications coexisting with the target service on the same nodes. Their activities through the kernel’s TCP stack will also be logged and gathered by our tool.
Ranker handles noise activities in two ways: 1) filters noise activities according to their attributes, including program name, IP and port. 2) If activities can not be filtered with the attributes, the ranker checks them with is_noise() function. If true, the ranker will discard them. The is_noise() function is illustrated in the following pseudo codes.
bool is_noise (Activity * E) {
return (( Etype==RECEIVE)&&(No matched SEND activity X in mmap with XE) && ( No matched SEND activity Y in the buffer of ranker with YE));
}
Concurrency disturbance: The second disturbance is called concurrency disturbance, which only exists in multi-processor nodes. Fig. 5-a illustrates a possible case, of which two concurrent requests are concurrently served by two multi-processor nodes and four activities are observed. means a SEND activity produced on the CPU1 of Node1, and is its matched RECEIVE activity produced on the CPU0 of Node2. When these four activities are fetched into the buffer of Ranker, they are put into two queues as shown in Figure. 5a. The head activities of both two queues are RECEIVE activities and hence block the matched SEND activities of each other. Ranker handles this case by swapping the head activity and its following activity in the first queue. Figure. 5b illustrates our solution.

Clock skew disturbance: As explained in Section IV-B1, activities will be fetched into the buffer of Ranker according to their local timestamp. RECEIVE activities may be fetched into the buffer before their corresponding SEND activities when local clock of SEND activities is much later than RECEIVE activities because of clock skew. We take a simple solution to resolve this issue. In comparing head activities of each queue, we record the timestamp of the first activity from each node, and then we can calculate the approximate clock skew between two nodes. According to the the approximate clock skew, we remedy timestamp of activities on the node with the larger clock skew, and hence we can prevent the case mentioned above from happening.
IV-C Improving systems scalability
In this section, we present two mechanisms to improve system scalability.
IV-C1 Tracing on demand
The instrumentation mechanism of PreciseTracer depends on a open source software named SystemTap http://sourceware.org/systemtap, which extends the capabilities of Kprobe [31]- a tracing tool on a single Linux node. Using SystemTap, we have written the LOG_TRACE module, which is a part of Gather. LOG_TRACE could obtain context information of processes and threads from the operating system and inserts probe points into tcp_sendmsg() and tcp_recvmsg() functions of the kernel communication stack to log sending or receiving activities.
Deployed on every node, Gather receives commands from Coordinator. When users demands PreciseTracer to be enabled or disabled on demand, Coordinator will synchronize each Gather to dynamically load or unload the kernel module LOG_TRACE, which are supported by the Linux OS. PreciseTracer could choose instrumentation mode of continuous collection or Tracing on demand or periodical sampling. When administrators find services are abnormal, they can choose the model of Tracing on demand, which starts tracing requests according to commands of administrators. When administrators have pinpointed the problems, they can stop tracing requests. When PreciseTracer choose the mode of periodical sampling, it will be enabled or disabled alternatively, which could decrease the overhead on running applications, and hence improve system scalability.
IV-C2 sampling
To consider large amount of logs produced by tracing requests of multi-tier services, it seems that sampling is a straightforward solution. However, it is not a trivial issue to support sampling in accurate requesting tracing approaches: first, the tracing mechanism must allow to be enabled or disabled on demand; second the tracing algorithm must tolerate loss of logs. In this section , we discuss how to tolerate losses of activities and consider three cases:
- •
Case 1: Lost BEGIN and END activities;
- •
Case 2: Lost RECEIVE activities;
- •
Case 3: Lost SEND activities.
It is difficult to handle Case 1. Each CAG needs a BEGIN activity and an END activity to identify its begin and end. Fortunately, losses of BEGIN and END activities only affect constructing their affiliated CAG, and have no influence on other CAGs that have identified BEGIN and END activities.
About Case 2, due to the underlying delivery mechanism, a receiver will receive a message in several parts, which is explained in Section IV-B2. So the situation seldom happens that all parts of a message fail to be collected. In this case, the received message size will be less than its corresponding sent message size, but this wouldn’t prevent from constructing a CAG.

Fig. 6 shows a case of lost SEND activities when candidate activities are in queues of Ranker. Activities from the same node are put into a queue and ordered according to their local timestamp. We hereby utilize (activity type, context identifier, message identifier, message size) to identify an activity. In Fig. 6, (SEND, context_1, message_1, 60) is related to (RECEIVE, context_8, message_1, 60) while (SEND, context_4, message_1, 40) is related to (RECEIVE, context_6, message_1, 40) and they share the same message identifier. Ranker would pick candidate activities. However, if it fails to collect activity (SEND, context_1, message_1, 60), activity types of all head activities will be RECEIVE, and our algorithm mentioned above can not proceed. We propose a simple approach to resolve this issue, and we just discard the RECEIVE activity with the smallest timestamp. In Section V-B, our experiments show our approach to handling lost activities is acceptable.
IV-C3 The complexity of the algorithm
For a multi-tier service, the time complexity of our algorithm is approximately , where measures the structure complexity of a service, is the number of requests in the fixed duration, is the size of activities sequence per request in the sliding time window. Furthermore, the time complexity of our algorithm can be expressed as , where n is the size of activities sequence in the sliding time window. The space complexity of our algorithm is approximately or .
IV-D PreciseTracer Implementation
We have implemented PreciseTracer with the following components: TCP_Tracer, Correlator, Analyzer and a visualized tool named PathViewer.
If the kernel module named LOG_TRACE (a part of Gather) is loaded, when an application sends or receives a message, a probe point will be trapped and an activity is logged. The original format of an interaction activity produced by LOG_TRACE is ”timestamp hostname program_name Process ID Thread ID SEND/RECEIVE sender_ip: port-receiver_ip: port message_size”. Gather transforms the original format of an interaction activity into more understandable n-ary tuples to describe context and message identifiers of activities, described in Section IV-A1. Distinguishing activity types is straightforward. SEND and RECEIVE activities are transformed directly. BEGIN or END activities are distinguished according to the port of the communication channel. For example, the RECEIVE activity from a client to the web server’s port 80 means the START of a request, and the SEND activity in the same connection with opposite direction means the STOP of a request. After all Gathers have finished transformation, Coordinator would start Correlator and Analyzer to deal with collected logs.
Correlator constructs CAGs and delivers them to Analyzer. Analyzer analyzes CAGs to obtain causal path patterns, and further calculates statistical information of those patterns.
Unlike Analyzer, which only provides administrators with analysis results, PathViewer is a graphical user interface, which provides administrators with visual views of causal paths. Presently, we provides two view of CAGs: (1) time-space diagram of CAGs; and (2) causal path pattern of CAGs. Fig. 7 shows a picture of the time-space diagram of a CAG, from which administrator would get detail information about how this request was served by multi-tier services.

V Evaluation
In this section, we will evaluate PrecisTracer. First, we introduce the experimental environment and setup; second, we evaluate the accuracy of our tracing tool; third, we test the efficiency of the tracing algorithm; fourth, we demonstrate the online analysis ability of PreciseTracer; fifth, we present the sampling effect; finally, we demonstrate how PreciseTracer facilitates debugging performance.
V-A Experimental environment and setup
We have performed experiments on RUBiS and TPC-W[33]. In the rest of experiments, We choose RUBiS as the target application. Developed by Rice University, RUBiS is a three-tier auction site prototype modeled after eBay.com, which is used to evaluate application servers’ performance scalability.

The experiment platform is a 6-node Linux cluster connected by a 100Mbps Ethernet switch. Web tier (Apache) and active web pages server (JBOSS) is respectively deployed on two SMP nodes with two PIII processors and memory. Database (MYSQL) and the analysis component of PreciseTracer are respectively deployed on two SMP nodes with eight Intel Xeon processors and memory. Every node runs the Redhat Federo Core 6 Linux with the kprobe [31] feature enabled. The deployment of RUBiS is shown in Fig. 8.
In the following experiments, client nodes emulate two kinds of workload: read_only workload (Brows_only) and read_write mixed workload (Default). We utilize two nodes to emulate clients. Each node is set to the same number of concurrent clients. In order to make the experiences close to reality, we adapt mix workload in all experiences.
According to the user guide of RUBiS, every workload includes 3 stages: up ramp, runtime session, and down ramp. In the following experiences, we set different durations for three stages.
V-B Evaluating PreciseTracer accuracy
To verify the accuracy of PreciseTracer, we build another library-interposition tool to collect network communication. We rewrite the following system library functions in our library: write, writev, send, read, recv. When a message is sent, a global request ID will be tagged and propagated, and hence we can obtain causal paths with 100% accuracy. The following attributes are logged for the Apache web server, the JBoss Server and the MySql database, including (1) request ID, (2) the start time and end time of serving a request; (3) ID of the process or thread.
At the same time, with only application independent knowledge, such as timestamps, end-to-end communication channels, we use PreciseTracer to obtain causal paths. For each causal path, we independently obtain information like (2) and (3). If all attributes of a causal path are consistent with the ones obtained from our another library-interposition tools, we confirm that the causal path is correct. So we define the path accuracy as follows:
Path accuracy = correct paths/ all logged requests
We test the accuracy of our algorithm in the offline mode with the configuration of (offline, 20 milliseconds) for read_write mixed workload of RUBiS. The configuration (offline, 20 milliseconds) indicates the sliding time windows is 20 milliseconds. The number of concurrent clients is respectively set as 200, 500 and 800. The up ramp duration, runtime session and down ramp duration is respectively set as 1 minute, 5 minutes and 1 minute. Table II summarizes the experiment reports, and the accuracy of our algorithm are almost 100%. This is because most of activities of components are logged using SystemTap (which fails to collect a negligible fraction of logs), so our algorithm almost correlates all activities into causal paths.
| 200 | 500 | 800 | |
| Total CAGs (library interposition) | 3617 | 13627 | 10403 |
| matched | 3610 | 13623 | 10402 |
| accuracy | 99.97% | 99.81% | 99.99% |
Since we adopt a sampling policy to increase system scalability, we can not accurately keep complete logs, which constitutes different causal paths, so we delete logs randomly to test the ability of our algorithm to handle lost logs. We conduct four groups of experiments: only deleting logs from Apach, only deleting logs from Jboss, only deleting logs from MySql, and deleting logs from all three components. The deletion of logs is conducted randomly according to a defined percent. The number of concurrent clients is 800. We adapt read_write mixed workload and each workload is set as followed: up ramp with a duration of 2 minutes, runtime session with a duration of 5 minutes, and down ramp with a duration of 1 minute.

V-C Evaluating PreciseTracer efficiency
In this section, we respectively evaluate the complexity and the overhead of PreciseTracer. Lastly, we demonstrate its online analysis ability.
V-C1 Evaluating the complexity
We set the baseline configuration as (online, 120, 400, 20, 1) in this experiment, and the detailed parameter analysis will be deferred to the end of this subsection. This configuration (online, 120, 400, 20, 1) indicates that PreciseTracer will work under online model; It will gather logs for one round, lasting for 120 seconds (collecting time window) and then stop collecting logs (in next 400 seconds); The sliding time window is 20 milliseconds.
When concurrent clients vary from 100 to 1000, we record the number of served requests and the correlation time. For different numbers of concurrent clients, the test duration is fixed for the read_write mixed workload. And each workload is set as following: up ramp with the duration of 2 minutes, runtime session with the duration of 5 minutes, and down ramp with the duration of 1 minute.


From Fig. 10 and Fig. 11, we observe that the number of requests is almost linear in the number of concurrent clients and the correlation time is almost linear in the number of requests in the fixed duration. In Section IV-C3, we conclude that the time complexity of our algorithm is approximately . Our experiment data in Fig. 11 is consistent with this analysis, since is a constant for RUBiS and is unchanged in the fixed sliding time window, so the correlation time is linear in the number of requests in the fixed test.
There are two important parameters in experiments, which could influence the efficiency of our correlate algorithm: collecting time window and sliding time window. A collecting time window is the time duration of gathering logs. So the longer collecting time window is, the more logs that our algorithm should deal with at a time and the higher time cost for our system. The influence of the sliding time window is much more complex, and Fig. 12 shows the effect of different size of the sliding time window on the correlation time for different numbers of concurrent clients (200, 500, and 800).

The size of sliding time window would effect the correlation time in two ways: first, when the number of requests in the fixed duration is unchanged, the time complexity of the algorithm is linear in the size of for RUBiS. is the size of activities sequence per request in the sliding time window, which is determined by the size of the sliding time window. So the correlation time will increase with the sliding time window; secondly, the sliding time window also affects handling noise activities. If the size of the sliding time window is set to be a smaller value (less than 10 milliseconds), it has to deal with noise activities more frequently, and hence increases the correlation time. From Fig. 12, we can observe those effects.

Fig. 13 shows the effect of the size of the sliding time window on the memory consumption of Correlator for different concurrent clients. We do not show the memory consumption of other components, because they consume fewer memory in comparison with that of Correlator.
V-C2 The overhead of PreciseTracer
We compare the throughput and average response time of RUBiS for the read_write mixed workload when the instrumentation mechanism is disabled (no instrumentation), enabled (only starting Gather module) or PreciseTracer is in the model of online analysis. In order to test the maximum overhead of PreciseTracer under online model, we choose the continuous collection mode. Thus, we set the configuration of PreciseTracer as (online, 60, 0, 20, 7). Every workload is set as following: up ramp with the duration of 2 minutes, runtime session with the duration of 5 minutes, and down ramp with the duration of 1 minute.


V-D Evaluating the online analysis ability of PreciseTracer
In this section, we demonstrate the online analysis ability of PreciseTracer. We set the baseline configuration as (online, 60, 0, 20, 10). The test duration is fixed for the read_write mixed workload. The workload is set as followed: up ramp with the duration of 2 minutes, runtime session with the duration of 5 minutes, and down ramp with the duration of 1 minute.

There are four steps in applying request tracing for online analysis of services: first, the system would transform original logs into tuple logs; secondly, it will transmit tuple logs to a analysis node for further work; then the system correlates those tuple logs into CAGs; finally, the tool analyzes useful information from those CAGs. So the time consumption of PreciseTracer include four main stages: transform time, transmit time, correlate time and analysis time. Because the second step is conducted on each node simultaneously, we take the maximum one as the time consumption in this stage.
Fig. 16 shows that PreciseTracer could deal with logs efficiently. It can output analysis results within 20 seconds even the workload is so heavy as 900 concurrent clients. This demonstrates that our system could be applied in online analysis.
V-E The sampling effect
PreciseTracer supports sampling through tolerating losses of activities. In this section, through experiments, we demonstrate that adopting a sampling policy could decrease the size of logs to be collected and analyzed, at the same time we still can capture most of dominated causal path patterns.
We run experiments twice with the baseline configurations (offline, 20 milliseconds) respectively for one minutes and 10 minutes. The test duration is fixed for the brown_only workload. And every workload is set as following: up ramp with the duration of 30 seconds, runtime session with the duration of 30 minutes, and down ramp with the duration of 1 minute.
We analyze top 10 dominated causal path pattern in two run of experiments (1 minute V.S. 10 minutes). We have two observations: first, in two runs, causal paths belonging to the top 10 dominated causal patterns respectively take up a significant percent of all causal paths (both 88%); Second, two runs of experiments have the same top 10 dominated causal path patterns. These two observations justified adopting the sampling policy, since the adoption of the sampling policy still can capture most of dominated casual path patterns, even not all causal path patterns.
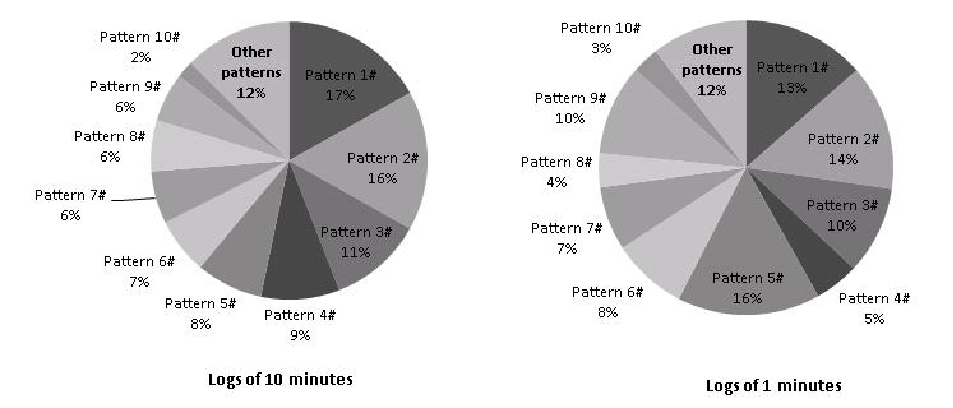
Table III compares log sizes in two runs of experiments respective with 1 minute and 10 minutes. It indicates that sampling captures most of dominated causal path patterns, at the same time decreases the cost of collecting and analyzing logs, and hence improves system scalability.
| Original logs on Apache (M) | Original logs on Jboss (M) | Original logs on MySql (M) | |
|---|---|---|---|
| 1 minute | 3.9 | 6.6 | 6.7 |
| 10 minutes | 27.9 | 55.1 | 58.6 |
V-F Identifying performance bottleneck
In the following section, we will utilize PreciseTracer to detect performance problems of multi-tier service. The following experiments are done offline. The experiment platform is a Linux cluster connected by a 100Mbps Ethernet switch. Web tier (APACHE) and active web pages server (JBOSS), database (MYSQL) and analysis components of PreciseTracer is respectively deployed on four SMP nodes, each of which has two PIII processors and memory. Each node runs the Redhat Federo Core 6 Linux with the kprobe [31] feature enabled. The deployment of RUBiS is similar to Fig. 8.
V-F1 Misconfiguration shooting
When we perform offline experiments using PreciseTracer with the configuration of (offline, 20 milliseconds), we observe that when the number of concurrent clients increases from 700 to 800, the throughput of RUBiS decreases. Fig. 18 shows the relationship between number of concurrent clients and requests The test duration is fixed for the brown_only workload. And every workload is set as following: up ramp with the duration of 1 minutes, runtime session with the duration of 7 minutes, and down ramp with the duration of 1 minute. An interesting question is what is the wrong with RUBiS?

Generally, we will observe the resource utilization rate of each tier and the metrics of quality of service to pinpoint the bottlenecks. Using the monitoring tool of RUBiS, we notice that the CPU usage of the each node is less than 80% and the I/O usage rate is not high. Obviously, the traditional method does not help.
To answer this question, we use our tool to analyze the most frequent request ViewItem for RUBiS, compute the most dominated causal path pattern and visualize the view of latency percentages of components. We identify the problem quickly.

From Fig. 19, we observe that when the number of concurrent clients increases from 500 to more, the latency percentage of httpd2Java from the first tier to the second tier changes dramatically, and the value is 46%, 80%, 71% and 60% respectively for 500, 600, 700 and 800 concurrent clients. In Fig.19, the latency percentage of httpd2Java is 46% for 500 clients, which means that the processing time of the interaction from httpd to Java takes up 46% of the whole time of servicing a request.
At the same time, the latency percentage of httpd2httpd (first tier) increases dramatically from 17% (700 clients) to 31% (800 clients). We observe the CPU usage of the Jboss node is less than 60% and the I/O usage rate is not high. When servicing a request, the httpd2httpd is before the httpd2java in a causal path. So we can confirm that there is something wrong with the interaction between the httpd and the JBoss. Through reading the manual reference of RUBiS, we confirm that the problem may be mostly related with the configuration of thread pool in the JBoss. According to the manual book of the JBoss, one parameter named MaxThreads controls the max available thread number, and one thread services a connection. The default value of MaxThreads is 40.
We set MaxThreads as 250 and run the experiments again. In Fig. 20, we observe that our work is effective. When concurrent clients increase from 500 to 800, the throughput is increased and the average response time is decreased in comparison with that of the default configuration. However, for 900 concurrent clients, the resource limit of hardware platform results in the new bottleneck. In Fig. 20, TP_MT40 is the throughput when MaxThreads is 40, and RT_MT250 is the average response time when MaxThreads is 250.

V-F2 Injected performance problem
To further validate the accuracy of locating performance problems using PreciseTracer, we have injected several performance problems into RUBiS components and the host nodes: for abnormal case 1, we modify the RUBiS code to inject a random delay into the second tier; for abnormal case 2, we lock the items table of the RUBiS database to inject a delay into the third layer; for abnormal case 3, we change the configuration of the Ethernet driver from 100 M to 10 M on the node running the JBoss.

We use PreciseTracer to locate the component in question where different performance problems are injected. Fig. 21 shows the latency percentages of components for normal case and three abnormal cases.
For abnormal case 1 (EJB_Delay), the latency percent-age of Java2Java (JBoss, second tier) increases from less than 10% for the normal case to more than 40%, and the latency percentages of other components decrease with different amounts. So we can confirm that JBoss is in question.
For abnormal case 2 (DataBase_Lock), the latency percentage of mysqld2mysqld (third tier) increases from 12% for the normal case to more than 20%, and the latency percentage of java2mysqld (interaction from second tier to third tier) increases from 26% for the normal case to more than 35%. The Latency percentages of other components keep unchanged or decrease. So we confirm that MySQL is in question.
For the abnormal case 3 (EJB_Network), the latency percentage of Java2mysqld (from second tier to third tier) increases from 26% for the normal case to 47%; mysqld2java (from third tier to second tier) keeps about 37%. The latency percentage of httpd2java from first tier to second tier increases from 1% to 2%; the percentage of java2httpd from second tier to first tier increases from 4% to 8%. We observe that most of time of servicing request is spent on the interactions between second tier and third tier, and the three latency percentages of four interactions related with the second tier are increased. We confirm the second tier is in question. Further observation shows the latency percentage of Java2java strangely decreases from 9% to almost 0%. So we confirm that there is something wrong with the network of second tier.
VI Conclusion
We have developed an accurate request tracing tool: PreciseTracer to help users understand and debug performance problems of a multi-tier service of black boxes. Our contributions are two-fold: (1) we have designed a precise tracing algorithm to derive causal paths for each individual request, which only uses the application-independent knowledge, such as timestamps and end-to-end communication channels; (2) We respectively presented abstractions: component activity graphs and dominated causal path patterns for understanding and debugging micro-level and macro-level user request behaviors of services; (3) we have presented two mechanisms: tracing on demand and sampling to increase system scalability, and our experiments show sampling efficiently preserves performance data of services in the way that it captures most of dominated causal path patterns, at the same decreases the cost of collecting and analyzing logs; (4) we have designed and implemented an online request tracing system. Our experiments demonstrated that PreciseTracer’s fast response, low overhead and scalability make it a promising tracing tool for large-scale production systems.
References
- [1] P. Barham, A. Donnelly, R. Isaacs and R.Mortier, Using Magpie for Request Extraction and Workload Modeling, in Proc. 6th OSDI, 2004, pp. 18-18.
- [2] P. Barham, R.Isaacs,R.Mortier and D.Narayanan, Magpie: online modelling and performance-aware system, in Workshop on HotOS’03, 2003, PP.85-90.
- [3] P. Reynolds, J. L.Wiener, J. C. Mogul, M. K. Aguilera and A. Vahdat, WAP5: Black-box Performance Debugging for Wide-area Systems, in Proc. 15th WWW, 2006, pp.347-356.
- [4] M. K. Aguilera, J. C. Mogul, J. L. Wiener, P. Reynolds and A. Muthi-tacharoen, Performance Debugging for Distributed Systems of Black Boxes, in Proc. 19th SOSP, 2003, pp. 74-89.
- [5] E. Koskinenand and J. Jannotti, BorderPatrol: Isolating Events for Black-box Tracing. SIGOPS Oper. Syst. Rev. 42, 4, 2008, pp. 191-203.
- [6] M. Ricahrd Stevens, UNIX Network Programming Networking APIs: Sockets and XTI, Volume 1, Prentice Hall, 1998.
- [7] S. Agarwala, F. Alegre, K. Schwan and J. Mehalingham, E2EProf: Automated End-to-End Performance Management for Enterprise Systems, in Proc. 37th DSN, 2007, pp.749-758.
- [8] L. Lamport, Time, Clocks and the Ordering of Events in a Distributed System, Comms. ACM, 21(7), 1978, pp.558-565.
- [9] B. P. Miller, DPM: A Measurement System for Distributed Programs, IEEE Trans. on Computers, 37(2), 1988, pp.243-248.
- [10] B. Tierney, W. Johnston, B. Crowley, G. Hoo, C. Brooks and D. Gunter, The NetLogger Methodology for High Performance Distributed Systems Performance Analysis, in Proc. 17th HPDC, 1998, pp. 260-267
- [11] J. L. Hellerstein, M.M. Maccabee, W.N. III. Mills and J.J. Turek, ETE: a Customizable Approach to Measuring End-to-end Response Times and Their Components in Distributed Systems, in Proc. 19th ICDCS, 1999, pp. 152-162.
- [12] E. Thereska, B. Salmon, J. Strunk, M. Wachs, M. Abd-El-Malek, J. Lopez and G. R. Ganger, Stardust: Tracking Activity in a Distributed Storage System, in Proc. SIGMETRICS, 2006, pp. 3-14.
- [13] P. Reynolds, C. Killian, J. L. Wiener, J. C. Mogul, M. A. Shahand and A. Vahdat, Pip: Detecting the Unexpected in Distributed Systems, in Proc. 3rd NSDI, 2006, pp.115-128.
- [14] A. Chanda, A. L. Cox and W. Zwaenepoel, Whodunit: Transactional Profiling for Multi-tier Applications, SIGOPS Oper. Syst. Rev. 41, 3, 2007, pp. 17-30.
- [15] M. Y. Chen, E. Kiciman, E. Fratkin, A. Fox and E. Brewer, Pinpoint: Problem Determination in Large, Dynamic Internet Services, In Proc. 32th DSN, 2002, pp.595-604.
- [16] A. Chanda, K. Elmeleegy, A. L. Cox and W. Zwaenepoel, Causeway: Operating System Support for Controlling and Analyzing the Execution of Distributed Programs, in Proc. 10th HotOS, 2005, pp. 18-18.
- [17] R. Fonseca, G. Porter, R. H. Katz, S. Shenker, I. Stoica, X-Trace: A Pervasive Network Tracing Framework, In Proc. 4th NSDI, 2007, pp.271-284.
- [18] A. Anandkumar, C. Bisdikian and D. Agrawal, Tracking in a spaghetti bowl: monitoring transactions using footprints, In Proc. SIGMETRICS’08, 2008, pp. 133-144.
- [19] M. Y. Chen, A. Accardi, E. Kiciman, J. Lloyd, D. Patterson, A. Fox and E. Brewer; Path-based faliure and evolution management, In Proc. NSDI’04, 2004.
- [20] Z. Zhang, J. Zhan, Y. Li, L. Wang. D. Meng, B. Sang, Precise Request Tracing and Performance Debugging of Multi-tier Servcies of Black Boxes, In Proc. DSN’09, 2009, pp.337-346.
- [21] B. Sang, J. Zhan, G. Tian,Decreasing Log Data of Multi-tier Services for Effective Request Tracing, In Proc. DSN’09 Fast Abstract.
- [22] B. C. Tak, C. Tang, C. Zhang, S. Govindan and B. Urgaonkar, vPath: Precise Discovery of Request Processing Paths from Black-Box Observations of Thread and Network Activities, In Proc. USENIX’09, 2009.
- [23] B. M. Cantrill and M.W.S.a.A.H.L, Dynamic Instrumentation of Production Systems, In Proc. USENIX’04, 2004.
- [24] Y. Ruan and V. Pai. Making the ”box” transparent: system call performance as a first-class result. In Proc. USENIX ATC’04, 2004.
- [25] Y. Ruan and V. Pai. Understanding and Addressing Blocking-Induced Network Server Latency. In Proc. of the USENIX ATC’ 06, 2006.
- [26] K. Shen, M. Zhong, S. Dwarkadas, C. Li, C. Stewart, and X. Zhang. Hardware counter driven on-the-fly request signatures. In Proc. ASPLOS XIII, 2008, pp.189-200.
- [27] B. H. Sigelman, L. A. Barroso, M. Burrows, P. Stephenson, M. Plakal, D.Beaver, S.Jaspan, C. Shanbhag, Dapper, a Large-Scale Distributed Systems Tracing Infrastructure, Google Technical Report dapper-2010-1, April 2010.
- [28] J. Tan, S. Kavulya, R. Gandhi, P. Narasimhan. Visual Log-based Causal Tracing for Performance Debugging of MapReduce Systems. To Appear in Proc. of ICDCS’10.
- [29] C.Stewart and K.Shen, Performance Modeling and System Management for Multi-component Online Services, In Proc.NSDI’05, 2005.
- [30] K. Appleby, S.Fakhoury, L. Fong, G.Goldszmidth, M.Kalantar, S. Krishnakumar, D. P.Pazel, J.Pershing,B. Rochwerger, Oceano- SLA Based Management of a Computing Utility. In Proc. of the IFIP/IEEE Symposium on Integrated Network Management, 2001, pp.855–868.
- [31] R. Krishnakumar. 2005. Kernel korner: kprobes-a kernel debugger. Linux J. 2005, 133 (May. 2005), 11.
- [32] L. Yuan, J. Zhan, B. Sang, L. Wang, H. Wang. 2010. PowerTracer, tracing requests in multi-tier services to save cluster power consumption. Technical Report. Avaialable at http://arxiv.org/corr/.
- [33] TPC Benchmark: http://www.tpc.org/tpcw/