Pressure from dark matter annihilation and the rotation curve of spiral galaxies
Abstract
The rotation curves of spiral galaxies are one of the basic predictions of the cold dark matter paradigm, and their shape in the innermost regions has been hotly debated over the last decades. The present work shows that dark matter annihilation into electron-positron pairs may affect the observed rotation curve by a significant amount. We adopt a model-independent approach, where all the electrons and positrons are injected with the same initial energy in the range from 1 MeV to 1 TeV and the injection rate is constrained by INTEGRAL, Fermi, and HESS data. The pressure of the relativistic electron-positron gas is determined by solving the diffusion-loss equation, considering inverse Compton scattering, synchrotron radiation, Coulomb collisions, bremsstrahlung, and ionization. For values of the gas density and magnetic field that are representative of the Milky Way, it is estimated that pressure gradients are strong enough to balance gravity in the central parts if GeV. The exact value depends somewhat on the astrophysical parameters, and it changes dramatically with the slope of the dark matter density profile. For very steep slopes, as those expected from adiabatic contraction, the rotation curves of spiral galaxies would be affected on kpc scales for most values of . By comparing the predicted rotation curves with observations of dwarf and low surface brightness galaxies, we show that the pressure from dark matter annihilation may improve the agreement between theory and observations in some cases, but it also imposes severe constraints on the model parameters (most notably, the inner slope of halo density profile, as well as the mass and the annihilation cross-section of dark matter particles into electron-positron pairs).
Keywords:
dark matter – astroparticle physics – galaxies: haloes, kinematics and dynamics1 Introduction
Although cosmological observations are providing increasingly convincing evidence that non-baryonic cold dark matter (CDM) is the building block of structures in the Universe, the exact nature of dark matter remains a mystery. A promising approach to the problem relies on the possibility that dark matter particles annihilate into observable products such as photons, neutrinos, protons, anti-protons, electrons, and positrons. Thus one can aim for indirect dark matter detection by looking for signatures of the annihilation products (Bertone et al., 2005, see e.g.).
The most commonly studied signature is the emission of gamma rays from the Galactic centre (e.g. Bergström et al., 1998; Baltz & Edsjö, 1999; Gondolo & Silk, 1999; Morselli et al., 2002; Ullio et al., 2002; Stoehr et al., 2003; Prada et al., 2004; Cesarini et al., 2004; Aharonian et al., 2006; Springel et al., 2008; Cirelli & Panci, 2009; Fornasa et al., 2009; Bernal & Palomares-Ruiz, 2010, among many others) as well as photons at other frequencies (Colafrancesco & Mele, 2001; Regis, 2008; Regis & Ullio, 2008; Bergström et al., 2009; Cholis et al., 2009; Pato et al., 2009; Profumo & Ullio, 2010; Crocker et al., 2010, e.g.). As the annihilation products travel through the surrounding medium, they heat and ionize the gas, potentially leaving an imprint on the cosmic microwave background (Chen & Kamionkowski, 2004; Colafrancesco, 2004; Padmanabhan & Finkbeiner, 2005; Mapelli et al., 2006; Zhang et al., 2006; Zhang et al., 2007; Hooper et al., 2007; Cirelli et al., 2009; Galli et al., 2009; Cumberbatch et al., 2009; Kanzaki et al., 2010) and the HI 21 cm spectral line (Furlanetto et al., 2006; Valdés et al., 2007; Chuzhoy, 2008). Heating and ionization of the surrounding baryonic gas can also affect the formation of the first stars (Iocco et al., 2008; Spolyar et al., 2008; Natarajan et al., 2009; Ripamonti et al., 2010) and the formation and evolution of galaxies (Ascasibar, 2007; Ripamonti et al., 2007; Natarajan et al., 2008).
In this paper, we investigate the contribution of dark matter annihilation to the total gas pressure and consider the possibility that it has a significant effect on the rotation curve of spiral galaxies. While rotation curves provided one of the first and most important pieces of evidence for the existence of dark matter (see e.g. Sofue & Rubin, 2001, and references therein), their shape in the inner regions of gas-rich dwarf and low surface brightness (LSB) spiral galaxies is one of the outstanding issues in modern cosmology (see e.g. de Blok, 2010, for a recent discussion).
Observationally, rotation curves are found to rise approximately linearly with radius, consistent with a constant density core in the dark matter distribution (Flores & Primack, 1994; Moore, 1994; Burkert, 1995; Kravtsov et al., 1998; Borriello & Salucci, 2001; de Blok et al., 2001; de Blok & Bosma, 2002; Marchesini et al., 2002; Gentile et al., 2004; Donato et al., 2004; Spano et al., 2008; Kuzio de Naray et al., 2008; de Blok et al., 2008; Oh et al., 2010, e.g.) rather than the steep power law predicted by cosmological N-body simulations (Dubinski & Carlberg, 1991; Navarro et al., 1996; Navarro et al., 1997; Navarro et al., 2004; Navarro et al., 2010; Fukushige & Makino, 1997; Fukushige & Makino, 2001; Moore et al., 1998; Moore et al., 1999; Ghigna et al., 1998; Ghigna et al., 2000; Jing & Suto, 2000; Klypin et al., 2001; Power et al., 2003; Ascasibar et al., 2004; Fukushige et al., 2004; Hayashi et al., 2004; Reed et al., 2005; Diemand et al., 2005; Diemand et al., 2008; Ascasibar & Gottlöber, 2008; Gao et al., 2008, e.g.). Several modifications to the standard CDM scenario, such as warm (Colín et al., 2000; Sommer-Larsen & Dolgov, 2001), repulsive (Goodman, 2000), fluid (Peebles, 2000), fuzzy (Hu et al., 2000), decaying (Cen, 2001), annihilating (Kaplinghat et al., 2000), or self-interacting (Spergel & Steinhardt, 2000; Yoshida et al., 2000; Davé et al., 2001) dark matter, and even alternative theories of gravitation (McGaugh & de Blok, 1998; Sanders & McGaugh, 2002; Gentile et al., 2010, e.g.) have been proposed in order to explain the discrepancy.
Here we focus on the energy density associated to electrons and positrons arising from dark matter annihilations, neglecting other processes, such as dark matter decay, or other annihilation products, such as protons and antiprotons (Adriani et al., 2009b, whose contribution is severely constrained by recent observational data; see e.g.). We adopt a model-independent approach, in which all particles are created with the same initial energy . Results for a particular dark matter candidate can be obtained by convolution with the appropriate source function.
Since the characteristic energies involved are of the order of the mass of the dark matter particle, and this mass is usually much larger than the rest mass of the electron, electrons and positrons will be relativistic at the moment of their creation. However, they can efficiently lose their energy through different processes, such as inverse Compton scattering (ICS), synchrotron radiation, Coulomb collisions, bremsstrahlung, and ionization. Throughout this paper, we will often use the Lorentz factor to express the energy , where denotes the rest mass of electron, and is the speed of light.
The pressure associated to these particles, hereafter referred to as “dark matter pressure”, is given by
| (1) |
where the electron-positron spectrum is the number density of particles with Lorentz factor at a radius from the centre of the dark matter halo. The pressure gradient induces an acceleration
| (2) |
where is the gas density at radius , that opposes the gravitational pull towards the centre, affecting observable quantities such as the circular velocity
| (3) |
It is our aim to show that, depending on the model parameters, the contribution of dark matter pressure to the rotation curve may not be negligible. Section 2 describes the procedure followed to estimate the electron-positron spectrum. The ensuing dark matter pressure is presented in Section 3, and the role of each astrophysical parameter (gas density and ionization fraction of the interstellar medium, intensity of the magnetic field, and dark matter density profile) is discussed in detail. The effect on the rotation curve is investigated in Section 4, and our main conclusions are briefly summarized in Section 5.
2 The electron-positron spectrum
2.1 Propagation
The propagation of electrons and positrons through the interstellar medium (ISM) is determined by the diffusion-loss equation
| (4) | |||||
We assume a diffusion coefficient of the form
| (5) |
with and , independent of Galactic location (Donato et al., 2004, MED model in). The energy loss rate
| (6) |
is a sum over the relevant physical processes, and the source term represents the instantaneous electron-positron injection rate.
Given enough time, the electron-positron population will approach a steady-state distribution, . Assuming that varies smoothly in space, the particle spectrum fulfills the relation
| (7) |
where
| (8) |
Imposing at infinity, one obtains the Green’s function
| (9) |
and either the image charges method or an expansion over the eigenfunctions of the linear differential operator may be used to derive the Green’s function for other boundary conditions (Baltz & Edsjö, 1999; Delahaye et al., 2009, see e.g.). The electron-positron spectrum is given by
| (10) |
where the quantity
| (11) |
is related to the characteristic diffusion length of the electrons and positrons, and denotes their initial energy. The variable is defined as
| (12) |
Considering the dark matter halo as a spherically-symmetric source, the spatial integral can be reduced to one dimension, and the electron-positron spectrum is finally given by the expression
| (13) | |||||
2.2 Loss rates
Electrons and positrons can lose their energy by several physical processes as they move through the ISM. We consider ICS of cosmic microwave background (CMB) and starlight photons, synchrotron radiation, Coulomb collisions, bremsstrahlung, and ionization of neutral hydrogen atoms.
The energy loss rates depend on the energy of the particle. High-energy electrons and positrons mainly lose energy by ICS (Sarazin, 1999, e.g.). The relevant loss function is
| (14) |
where is the Thomson cross section and
| (15) |
is the combined radiation energy density of the CMB, starlight, and thermal dust emission (Porter & Moskalenko, 2005, see e.g.).
Synchrotron radiation is another important loss mechanism at high energies. The expression for the loss rate is similar to that of ICS, substituting the radiation energy density in equation (14) by the energy density of the magnetic field, , where is the intensity of the magnetic field:
| (16) |
For lower-energy electrons and positrons, Coulomb interactions with the thermal plasma must be taken into account. The loss rate is approximately (Rephaeli, 1979)
| (17) |
where is the number density of thermal electrons.
Collisions with thermal ions and electrons also produce radiation through bremsstrahlung. The loss rate due to bremsstrahlung can be approximated as (Blumenthal & Gould, 1970)
| (18) |
Additional energy losses come from the ionization of hydrogen atoms. The loss rate is given in Longair (1981),
| (19) | |||||
where is the number density of hydrogen atoms, is the charge of electron, is the permittivity of free space and is the ionization energy of the hydrogen atom. The number density of thermal electrons and neutral atoms can be expressed in terms of the total ISM gas density and the ionization fraction as
| (20) |
and
| (21) |
respectively.
2.3 Source term
Since the electrons and positrons in our model originate from the annihilation of dark matter particles, the production rate is dictated by the dark matter number density and the annihilation rate into electron-positron pairs,
| (22) |
where and denote the number densities of dark matter particles and anti-particles, respectively, is the thermal average of the annihilation cross-section times the dark matter relative velocity, and is the injection spectrum of electrons and positrons in the final state.
Assuming all electrons and positrons are injected with the same energy ,
| (23) |
where
| (24) |
is the local production rate per unit volume per unit time and denotes a Dirac delta function.
Although this is a rather coarse approximation, it has the advantage of being absolutely model-independent. Moreover, the contribution of electrons and positrons to the gas pressure will be mostly determined by their total number and average initial energy, with the details of the injection spectrum playing only a minor role. The factor of 2 in equation (24) accounts for one electron and one positron produced per annihilation event, and self-conjugate (Majorana) dark matter particles have been assumed. If dark matter particles and anti-particles were different, and would decrease by a factor of four. For the dark matter density , we consider a perfectly spherically-symmetric halo described by a density profile of the form
| (25) |
where and denote a characteristic density and radius of the halo, respectively, and the is the inner logarithmic slope of the density profile. Local inhomogeneities that would boost the expected signal, such as small-scale clumpiness or the presence of subhaloes, are not taken into account. The shape of the dark matter density profile in the inner regions is far from being a settled question. As stated in the introduction, N-body simulations suggest that, at least in the absence of baryons, the profile should be quite steep near the centre (), in apparent contradiction with observations. Traditionally, it has been argued that the presence of gas and stars makes the profile even steeper due to the effects of adiabatic contraction (Blumenthal et al., 1986), although some recent claims have also been made in the opposite direction (El-Zant et al., 2001; Mashchenko et al., 2006; Oh et al., 2010, e.g.). Given the current uncertainties, we have left the inner slope of the density profile as a free parameter of the model.

For similar reasons, we also consider the injection energy as a free parameter and investigate values of the initial Lorentz factor between and , corresponding to energies from about 1 MeV to 1 TeV. The production rate , on the other hand, is strongly constrained by different Galactic observations. At high energies, we consider observations of the electron-positron spectrum in the solar neighbourhood by HESS and the Large Area Telescope (LAT) on board the Fermi satellite (Aharonian et al., 2008; Abdo et al., 2009). More specifically, the predicted amount of electrons and positrons cannot exceed the observed values for any Lorentz factor . Given the energy dependence of the observed spectrum, , and the energy losses, , the most restrictive constraint comes from the spectrum near the injection energy, where propagation can be safely neglected and . The maximum production rate allowed by the data can then be expressed as
| (26) |
Another, completely independent upper limit, valid at all energies, can be obtained from the observed intensity of the 511 keV line that measures the positron annihilation rate at the Galactic centre. In order to fully explain the line with dark matter annihilations, it is necessary that (Ascasibar et al., 2006)
| (27) |
so one just have
| (28) |
in order not to overproduce the observed signal.
The corresponding exclusion regions are shown in Figure 1, together with the production rates used in our calculation at the position of the Sun, . These conditions constitute strict upper limits, since astrophysical sources will also contribute to the relativistic particle budget, but the annihilation cross-sections they imply are comparable to or larger than the ones required to explain the cosmic dark matter density,
| (29) |
Therefore, we have set the injection rate according to equation (28) for MeV, while a cross-section compatible with the relic density constraint, , has been assumed for Mev GeV, and slightly larger values (Adriani et al., 2009a, based on the positron excess observed by PAMELA;) have been used for GeV and 1 TeV. Numeric values are given in Table 1.
3 Dark matter pressure
Apart from the initial energy and injection rate of the electron-positron pairs, related to the nature of the dark matter particle, there are many astrophysical parameters that determine the contribution of dark matter annihilation to the total gas pressure. We will first define a canonical model based on observations of the Milky Way and then investigate the effect of each individual component by varying the values of the adopted parameters one by one. In all cases, we calculate the electron-positron spectrum as described in the previous section, and then estimate the dark matter pressure according to expression (1).
3.1 Canonical Milky Way model
Our canonical model assumes a dark matter density profile with (Navarro et al., 1997), kpc and kg m-3, consistent with dynamical models of the Milky Way (Dehnen & Binney, 1998; Klypin et al., 2002, e.g.). The virial mass of the Galaxy is thus M⊙, and the local dark matter density is GeV cm-3. The ISM is mainly composed by neutral hydrogen atoms () with number density cm-3 (Dehnen & Binney, 1998; Ferrière, 2001; Robin et al., 2003), and it is permeated by a uniform, tangled magnetic field whose intensity is G throughout the Galaxy (Ferrière, 2001; Beck, 2001; Ascasibar & Díaz, 2010).

The contribution of the individual loss terms described in Section 2.2 is plotted on the top panel in Figure 2 for a model similar to the canonical one, but with (in order to have a non-zero contribution from Coulomb collisions and bremsstrahlung). ICS and synchrotron emission, being proportional to , dominate at high energies, . Bremsstrahlung is important in the intermediate range , and Coulomb collisions and ionization, roughly independent on , dominate at low energies, . The time taken by the electron-positron population to reach equilibrium is of the same order as the time
| (30) |
that the particles take to loose all their energy, shown on the middle panel in Figure 2 as a function of . Although this time may be larger than the orbital time at pc ( Myr, assuming km s-1) for MeV, a steady state will be reached as long as the conditions (dark matter and gas densities, magnetic field, etc.) evolve on timescales longer than Myr, which is relatively short in astrophysical terms.

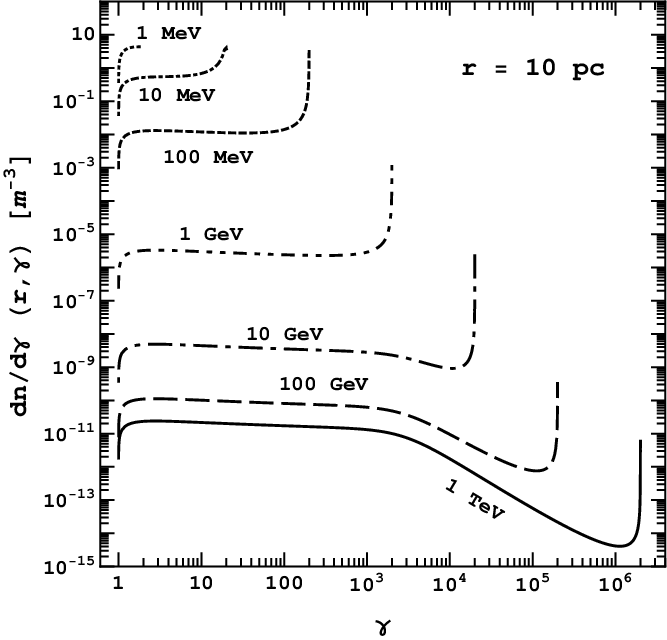


The steady-state electron-positron spectrum at the position of the Sun, , is shown on the left panel in Figure 3 for different values of the initial energy . As stated above, all of the electrons and positrons are generated with the same , according to Table 1. Propagation through the Galaxy and energy losses are accounted for by equation (13). The shape of the resulting spectrum is determined by the value of , the production rate , the loss rates implied by the values of , , and , and the diffusion coefficient . Nevertheless, some insight may be gained by neglecting diffusion. For ,
| (31) |
the electron-positron spectrum is almost flat when ionization dominates the energy losses, and there is a transition at ( GeV) to the ICS-synchrotron regime, where . For low injection energies (1 MeV to 100 MeV), the normalizations of the spectra are identical because the value of is only constrained by the INTEGRAL data, whereas other constraints impose lower values at higher energies (see Figure 1). In all cases, the spectra are cut at the injection energy since no acceleration mechanism is included in our model.
The electron-positron spectrum closer to the centre of the Galaxy ( pc) is shown on the right panel in Figure 3. In general terms, the overall normalizations are higher than at the position of the Sun because of the higher dark matter density, and there is a sharp spectral feature near . The characteristic diffusion scale plays an important role in both cases. As can be seen on the bottom panel of Figure 2, depends on the Lorentz factor of the electrons and positrons. It is zero at the injection value, and it rapidly increases for lower energies until it saturates at a maximum value that depends on . The spectrum at a given probes the effective value of the production rate , averaged over the diffusion scale. This is not very relevant at the position of the Sun because the dark matter density does not vary much on kpc scales, but it becomes more important as one moves towards the central density cusp. For , , and thus the effective production rate, is independent on . The larger , the larger the smoothing scale, and therefore the smaller the average density and the contrast with respect to the normalization at 8.5 kpc. As long as is constant, the shape of the spectrum remains the same, flat for low Lorentz factors and proportional to in the inverse Compton regime. Near the injection energy, becomes very small, the effective production rate approaches the local source term , much higher than the smoothed value, and the spectrum rises steeply just before the cutoff.


Finally, the contribution of dark matter annihilations to the gas pressure at a given radius can be obtained by substituting the electron-positron spectrum in equation (1). Results for different values of compared with gas and magnetic pressure in the galaxy are presented in Figure 4, compared to the thermal pressure of the gas (where cm-3 is the gas density, is the Boltzmann constant, and we have assumed a temperature , appropriate for the neutral gas in the Galactic disk) and the magnetic pressure , with G.
For low injection energies, the pressure decreases sharply with distance from the Galactic centre. For GeV, diffusion keeps the electron-positron spectrum (and the ensuing pressure) roughly constant within a radius of a few kpc. The highest values of the dark matter pressure are found for an initial energy . Although the spectrum for and 10 MeV is similar (approximately constant up to the cutoff at , because it dominated by ionization losses) and even has a higher normalization near the centre, the smaller upper limit of the integral in (1) yields significantly lower pressures. At high ( GeV) injection energies, the dark matter pressure is also lower, due to the smaller number density of dark matter particles. Most of the dark matter pressure for an initial energy , except , are higher than the pressure from the gas in the galaxy and for , the dark matter pressure is significantly higher than the pressure from magnetic fields.
3.2 Astrophysical parameters
We will now discuss the effect of the various astrophysical parameters that enter our calculation of the dark matter pressure, namely the intensity of the magnetic field, the density and ionization fraction of the ISM gas, and the inner slope of the dark matter density profile. As we did for the canonical model, we will compare the results obtained for different initial energies from MeV to 1 TeV and vary each of the astrophysical parameters in turn in order to assess how much they influence the results.
Magnetic fields affect the high-energy () tail of the electron-positron spectrum by setting the energy losses due to synchrotron radiation. As can be seen in Figure 2, in our canonical model with G, the synchrotron term (16) is responsible for about 50 per cent of the energy loss at high energies, with ICS being responsible for most of the other 50 per cent. At low energies, energy losses are dominated by ionization of neutral hydrogen, and the contribution of synchrotron emission is negligible. The effect of varying from 1 to 10 G is plotted on the left panel in Figure 5. Not surprisingly, the results for an initial energy are largely unaffected. At higher energies, the pressure at large radii decreases with the magnetic field intensity because of the more rapid energy losses. However, the diffusion length becomes shorter, increasing the effective production rate and yielding a larger pressure near the centre of the Galaxy.


| [GeV cm-3] | [kpc] | |
|---|---|---|
| 1.0 | 0.3483 | 16.68 |
| 1.2 | 0.1975 | 20.34 |
| 1.4 | 0.09946 | 25.88 |
| 1.5 | 0.06658 | 29.81 |
| 1.7 | 0.02469 | 42.46 |
| 1.9 | 0.00615 | 70.30 |


As explained in Section 2.2, the density of the ISM gas and the ionization fraction regulate the energy losses by Coulomb interactions, bremsstrahlung, and ionization. For (our canonical model), the ISM gas is entirely composed of neutral hydrogen atoms, and the energy loss of the electrons and positrons with is dominated by the ionization process. At the other extreme, , the ISM is already fully ionized, and the relevant energy losses are Coulomb collisions and bremsstrahlung. Since the total loss by these processes is higher than the loss by ionization, the maximum pressure happens when (mid panel of Figure 5). The effect of changing the gas density from to is shown on the right panel. Higher densities yield lower dark matter pressures, simply because the energy losses are faster.
Finally, we calculate the dependence of dark matter pressure on the inner logarithmic slope of the dark matter density profile. When varying , we also modify the characteristic density and radius in expression (25) so that the dark matter density at the solar radius is equal to 0.3 GeV cm-3 and the virial mass of the Galaxy is M⊙. The appropriate values of and are quoted in Table 2 for several values of the inner slope. For , the production rate in equation (24) diverges rapidly at , so we add a cutoff based on the local annihilation rate ,
| (32) |
where Gyr is the age of the universe and .
The dark matter pressure profiles obtained for , 1.2, 1.4, 1.5, 1.7 and 1.9 are compared in Figure 6. Since the central dark matter density increases dramatically with the value of the inner logarithmic slope, this is, by far, the most relevant astrophysical parameter, only second in importance to the injection energy related to the mass (and the precise nature) of the dark matter particle.


4 Rotation curves
The gradient of the dark matter pressure induces an acceleration on the baryonic component that opposes the gravitational force. This acceleration, given by expression (2), is plotted in Figure 7 for all the injection energies considered in this work and compared to the gravitational acceleration (represented by a thick solid black line). Each panel corresponds to a different value of the inner logarithmic slope of the dark matter density profile. For our canonical model with , m s-1 in the innermost regions, whereas in the general case described by equation (25) gravity scales as for .
| Name | [GeV cm-3] | [kpc] | |||||
|---|---|---|---|---|---|---|---|
| UGC 1230 | 15.152 | 0.723 | 0.713 | 0.720 | 49.825 | 0.430 | |
| UGC 5005 | 4206.9 | 0.521 | 0.520 | 0.521 | 4.726 | 0.488 | |
| LSBC F563-01 | 188.61 | 0.383 | 0.381 | 0.383 | 27.368 | 0.345 | |
| UGC 4173 | 1765.8 | 0.225 | 0.225 | 0.225 | 1.223 | 0.214 | |
| UGC 3371 | 7302.7 | 0.387 | 0.383 | 0.386 | 17.775 | 0.273 | |
| NGC 1560 | 7131.5 | 8.914 | 9.183 | 8.896 | 659.459 | 8.720 | |
| DDO 189 | 135.71 | 0.173 | 0.171 | 0.173 | 40.124 | 0.135 | |
| NGC 4395 | 5.8478 | 0.573 | 1.627 | 0.555 | 743.952 | 14.954 | |
| NGC 3274 | 6.7189 | 1.787 | 7.139 | 1.731 | 2935.570 | 33.516 | |
| NGC 4455 | 8252.1 | 1.428 | 1.694 | 1.419 | 320.260 | 1.643 | |
| NGC 2366 | 2.3734 | 1.246 | 1.209 | 1.245 | 58.692 | 1.204 | |
| UGC 4325 | 23618 | 1.326 | 1.294 | 1.300 | 748.686 | 4.459 | |
| DDO 47 | 14107 | 0.400 | 0.303 | 0.394 | 260.841 | 2.056 | |
| DDO 185 | 5245.2 | 2.036 | 2.024 | 2.026 | 141.203 | 1.896 |
| Name | [GeV cm-3] | [kpc] | |||||
|---|---|---|---|---|---|---|---|
| UGC 1230 | 9.0973 | 1.091 | 1.032 | 1.072 | 257.449 | 5.447 | |
| UGC 5005 | 75.759 | 0.175 | 0.172 | 0.174 | 18.571 | 0.102 | |
| LSBC F563-01 | 20.850 | 0.370 | 0.355 | 0.367 | 155.857 | 1.492 | |
| UGC 4173 | 2413.7 | 0.124 | 0.123 | 0.124 | 3.687 | 0.110 | |
| UGC 3371 | 10073 | 0.280 | 0.273 | 0.278 | 36.263 | 0.118 | |
| NGC 1560 | 166.59 | 2.330 | 3.810 | 2.315 | 1905.660 | 17.378 | |
| DDO 189 | 7.4629 | 0.109 | 0.088 | 0.105 | 273.964 | 5.120 | |
| NGC 4395 | 6.3057 | 0.644 | 2.476 | 0.613 | 1149.580 | 30.584 | |
| NGC 3274 | 2.9131 | 0.941 | 29.406 | 0.808 | 9205.720 | 371.555 | |
| NGC 4455 | 9702.7 | 0.614 | 1.078 | 0.605 | 466.972 | 2.482 | |
| NGC 2366 | 4.1902 | 1.935 | 2.222 | 1.900 | 950.701 | 16.488 | |
| UGC 4325 | 36371 | 1.096 | 1.081 | 1.047 | 1737.360 | 34.844 | |
| DDO 47 | 16137 | 0.272 | 0.180 | 0.265 | 344.709 | 3.186 | |
| DDO 185 | 7876.7 | 2.162 | 2.333 | 2.138 | 366.502 | 3.996 |


Depending on the model parameters, the acceleration caused by the electron-positron gas may be comparable to (or even higher than) the gravitational one in the central parts of the halo. For our canonical model (left panel of Figure 7), the pressure gradient is strong enough to overcome gravity for GeV, and the radius at which both forces balance each other is of the order of 100 pc. The effect of dark matter annihilation is weaker, but perhaps still measurable, for GeV. It would be extremely difficult to detect at 10 GeV, and completely negligible for larger particle masses. These conclusions are very robust with respect to variations in the ionization fraction of the gas or the intensity of the magnetic field. The exact density of the interstellar medium has a somewhat larger influence on the results, partly because of its effect on the dark matter pressure (see Figure 5) and partly through the presence of the gas density in equation (2). For the extreme case MeV and cm-3, dark matter pressure is able to prevent gravitational collapse within the inner 2 kpc, compared to 100 pc for a density of 10 cm-3. However, the qualitative picture is not changed. For GeV, the gravitational acceleration dominates by several orders of magnitude at all radii, even for the most dilute gas.
As shown in the previous section, the logarithmic slope of the density profile plays a critical role on the pressure profile. The accelerations for and 1.9 are shown on the centre and right panels of Figure 7, respectively. When , the radius at which the relativistic pressure balances gravity ranges from a few tens of parsec up to several kpc, and a sizable effect on the rotation curve of the Galaxy is expected for any value of the injection energy TeV.
Figure 8 shows the modified circular velocity profiles, according to expression (3), for different values of and . In our canonical model, the rotation curve of the Galaxy changes significantly for MeV, it is slightly modified for MeV and almost imperceptibly for GeV. For higher values of the inner logarithmic slope, as those predicted, for instance, in the adiabatic contraction scenario (Blumenthal et al., 1986), it is more likely that the annihilation of dark matter particles leaves a clearly detectable imprint on the observed rotation curve. The scales on which such a signal would be visible, of the order of kpc in some cases, subtend several degrees on the sky for the Milky way, and may be observable as well in other nearby galaxies.
In other to quantify the effect on the rotation curves of low surface brightness galaxies, we compute the model predictions for the objects compiled by de Blok & Bosma (2002). Since it is not our aim to fit the data (which would require more careful modelling, beyond the scope of the present work), we simply take the observed rotation curves, as well as the quoted decomposition into stellar disk, gaseous disk, and dark matter halo. We consider their constant mass-to-light ratio and maximum disk models, adopting the corresponding best-fitting values of and (de Blok & Bosma, 2002, Table 4 in). Values of and for the maximum disk and constant mass-to-light ratio cases are given in Tables 3 and 4, respectively.
Figures 9 and 10 show the predicted rotation curves for ( MeV) and ( GeV) with and all other parameters set to our canonical values. Since these rotation curves have been computed (at least, in the innermost regions) from the H line, we also plot the results obtained for a gas density cm-3 and , appropriate for the hot, diffuse component responsible for the emission line. The original model of de Blok & Bosma (2002) without dark matter annihilation is shown for the sake of comparison, and the reduced values associated to each model are listed in Tables 3 and 4.
In general, the effect is not very significant for cm-3 (not even for MeV, except for a few exceptional cases, such as NGC 3274). For the adopted value of the logarithmic slope of the dark matter density profile near the centre, , and the extremely low values of the characteristic density reported by de Blok & Bosma (2002), the circular velocity at the innermost point becomes reduced by an amount that is typically much smaller than the observational error bars. A more noticeable effect would be obtained for steeper profiles (see Figure 8), but also if one considers the typical density of the hot, ionized medium where the H line originates. Using cm-3, the rotation curves of all galaxies would be dramatically affected on kpc scales for and GeV, both for the constant and maximum disk models.
These results represent a double-edged sword for dark matter annihilation models. On the one hand, it might be possible to find a particular dark matter candidate that is able to explain the rotation curve data with a cuspy density profile. On the other hand, we also predict that, in that case, one should observe prominent differences in the kinematics of the stellar, neutral, and ionized components due to their different densities. The observed rotation curves provide thus an additional tool (complementary to radio and gamma-ray constraints) to rule out a broad class of models and hopefully help to identify the physical properties of dark matter particles.
5 Conclusions
In this paper, we have investigated the contribution to the total gas pressure arising from relativistic electrons and positrons produced in dark matter annihilations. The propagation of these particles through the ISM is determined by the diffusion-loss equation. We assume a uniform diffusion coefficient and consider inverse Compton scattering, synchrotron radiation, Coulomb collisions, bremsstrahlung and ionization of neutral hydrogen atoms as the main energy loss mechanisms. All the electrons and positrons are injected with an initial energy between 1 MeV and 1 TeV, and the injection rate is constrained by different Galactic observations.
We have evaluated the effect of this “dark matter pressure” for astrophysical conditions representative of the Milky Way and varied the adopted values of each parameter (intensity of the magnetic field, density and ionization fraction of the ISM gas, inner logarithmic slope of the dark matter density profile and the virial mass of the galaxy) to verify that our results hold in the general case. Our main conclusions can be summarized as follows:
- 1.
For the canonical Milky Way model, the dark matter pressure gradient is able to offset the gravitational acceleration within the central pc as long as the injection energy is lower than 1 GeV. There would be an extremely weak signature if GeV, and the effect would be completely negligible for larger values of .
- 2.
The ionization fraction of the ISM and the intensity of the magnetic field determine the energy losses and the shape of the electron-positron spectrum at low and high values of the Lorentz factor, respectively. Although these details may have a strong impact on other observables, such as the emission at different wavelengths, they do not affect the rotation curve significantly. The precise value of the gas density plays a more important role, and it changes the results at the quantitative level.
- 3.
Steep logarithmic slopes of the dark matter density profile yield much higher pressures in the central regions. For , a clear signature of dark matter annihilation on the observed rotation curve is expected even for TeV.
- 4.
Comparison with publicly-available observational data shows that, while dark matter pressure may bring the predicted rotation curves into better agreement with observations, it is arguably more likely that this effect is more useful as a constraint on the annihilation cross-section as a function of dark matter particle mass.
Acknowledgments
M. Wechakama would like to thank V. Müller and the members of the cosmology group at the AIP for useful discussions, as well as F. Breitling for his help with programming questions and S. White for English corrections. This work has been funded by DFG Research Grant AS 312/1-1 (Germany). Y. Ascasibar also acknowledges support from project AYA 2007-67965-C03-03 (MEC, Spain). We would also like to thank the referee for a very helpful report.
References
- Abdo et al. (2009) Abdo A. A., Ackermann M., Ajello M., et al. [Fermi collaboration] ., 2009, Physical Review Letters, 102, 181101
- Adriani et al. (2009a) Adriani O., Barbarino G. C., Bazilevskaya G. A., et al. [PAMELA collaboration] ., 2009a, Nature, 458, 607
- Adriani et al. (2009b) Adriani O., Barbarino G. C., Bazilevskaya G. A., et al. [PAMELA collaboration] ., 2009b, Physical Review Letters, 102, 051101
- Aharonian et al. (2008) Aharonian F., Akhperjanian A. G., Barres de Almeida U., et al. [HESS collaboration] ., 2008, Physical Review Letters, 101, 261104
- Aharonian et al. (2006) Aharonian F., Akhperjanian A. G., Bazer-Bachi A. R., et al. [HESS collaboration] ., 2006, Physical Review Letters, 97, 221102
- Ascasibar (2007) Ascasibar Y., 2007, A&A, 462, L65
- Ascasibar & Díaz (2010) Ascasibar Y., Díaz A. I., 2010, MNRAS, 404, 275
- Ascasibar & Gottlöber (2008) Ascasibar Y., Gottlöber S., 2008, MNRAS, 386, 2022
- Ascasibar et al. (2006) Ascasibar Y., Jean P., Bœhm C., Knödlseder J., 2006, MNRAS, 368, 1695
- Ascasibar et al. (2004) Ascasibar Y., Yepes G., Gottlöber S., Müller V., 2004, MNRAS, 352, 1109
- Baltz & Edsjö (1999) Baltz E. A., Edsjö J., 1999, Phys. Rev. D, 59, 023511
- Beck (2001) Beck R., 2001, Space Science Reviews, 99, 243
- Bergström et al. (2009) Bergström L., Bertone G., Bringmann T., Edsjö J., Taoso M., 2009, Phys. Rev. D, 79, 081303
- Bergström et al. (1998) Bergström L., Ullio P., Buckley J. H., 1998, Astroparticle Physics, 9, 137
- Bernal & Palomares-Ruiz (2010) Bernal N., Palomares-Ruiz S., 2010, ArXiv1006.0477
- Bertone et al. (2005) Bertone G., Hooper D., Silk J., 2005, Physics Reports, 405, 279
- Blumenthal et al. (1986) Blumenthal G. R., Faber S. M., Flores R., Primack J. R., 1986, ApJ, 301, 27
- Blumenthal & Gould (1970) Blumenthal G. R., Gould R. J., 1970, Reviews of Modern Physics, 42, 237
- Borriello & Salucci (2001) Borriello A., Salucci P., 2001, MNRAS, 323, 285
- Burkert (1995) Burkert A., 1995, ApJ, 447, L25+
- Cen (2001) Cen R., 2001, ApJ, 546, L77
- Cesarini et al. (2004) Cesarini A., Fucito F., Lionetto A., Morselli A., Ullio P., 2004, Astroparticle Physics, 21, 267
- Chen & Kamionkowski (2004) Chen X., Kamionkowski M., 2004, Phys. Rev. D, 70, 043502
- Cholis et al. (2009) Cholis I., Goodenough L., Hooper D., Simet M., Weiner N., 2009, Phys. Rev. D, 80, 123511
- Chuzhoy (2008) Chuzhoy L., 2008, ApJ, 679, L65
- Cirelli et al. (2009) Cirelli M., Iocco F., Panci P., 2009, Journal of Cosmology and Astro-Particle Physics, 10, 9
- Cirelli & Panci (2009) Cirelli M., Panci P., 2009, Nuclear Physics B, 821, 399
- Colafrancesco (2004) Colafrancesco S., 2004, A&A, 422, L23
- Colafrancesco & Mele (2001) Colafrancesco S., Mele B., 2001, ApJ, 562, 24
- Colín et al. (2000) Colín P., Avila-Reese V., Valenzuela O., 2000, ApJ, 542, 622
- Crocker et al. (2010) Crocker R. M., Bell N. F., Balázs C., Jones D. I., 2010, Phys. Rev. D, 81, 063516
- Cumberbatch et al. (2009) Cumberbatch D. T., Zuntz J., Kamfjord Eriksen H. K., Silk J., 2009, ArXiv0902.0039
- Davé et al. (2001) Davé R., Spergel D. N., Steinhardt P. J., Wandelt B. D., 2001, ApJ, 547, 574
- de Blok (2010) de Blok W. J. G., 2010, Advances in Astronomy, 2010
- de Blok & Bosma (2002) de Blok W. J. G., Bosma A., 2002, A&A, 385, 816
- de Blok et al. (2001) de Blok W. J. G., McGaugh S. S., Bosma A., Rubin V. C., 2001, ApJ, 552, L23
- de Blok et al. (2008) de Blok W. J. G., Walter F., Brinks E., Trachternach C., Oh S., Kennicutt R. C., 2008, AJ, 136, 2648
- Dehnen & Binney (1998) Dehnen W., Binney J., 1998, MNRAS, 294, 429
- Delahaye et al. (2009) Delahaye T., Lineros R., Donato F., Fornengo N., Lavalle J., Salati P., Taillet R., 2009, A&A, 501, 821
- Diemand et al. (2008) Diemand J., Kuhlen M., Madau P., Zemp M., Moore B., Potter D., Stadel J., 2008, Nature, 454, 735
- Diemand et al. (2005) Diemand J., Zemp M., Moore B., Stadel J., Carollo C. M., 2005, MNRAS, 364, 665
- Donato et al. (2004) Donato F., Fornengo N., Maurin D., Salati P., Taillet R., 2004, Phys. Rev. D, 69, 063501
- Donato et al. (2004) Donato F., Gentile G., Salucci P., 2004, MNRAS, 353, L17
- Dubinski & Carlberg (1991) Dubinski J., Carlberg R. G., 1991, ApJ, 378, 496
- El-Zant et al. (2001) El-Zant A., Shlosman I., Hoffman Y., 2001, ApJ, 560, 636
- Ferrière (2001) Ferrière K. M., 2001, Reviews of Modern Physics, 73, 1031
- Flores & Primack (1994) Flores R. A., Primack J. R., 1994, ApJ, 427, L1
- Fornasa et al. (2009) Fornasa M., Pieri L., Bertone G., Branchini E., 2009, Phys. Rev. D, 80, 023518
- Fukushige et al. (2004) Fukushige T., Kawai A., Makino J., 2004, ApJ, 606, 625
- Fukushige & Makino (1997) Fukushige T., Makino J., 1997, ApJ, 477, L9+
- Fukushige & Makino (2001) Fukushige T., Makino J., 2001, ApJ, 557, 533
- Furlanetto et al. (2006) Furlanetto S. R., Oh S. P., Pierpaoli E., 2006, Phys. Rev. D, 74, 103502
- Galli et al. (2009) Galli S., Iocco F., Bertone G., Melchiorri A., 2009, Phys. Rev. D, 80, 023505
- Gao et al. (2008) Gao L., Navarro J. F., Cole S., Frenk C. S., White S. D. M., Springel V., Jenkins A., Neto A. F., 2008, MNRAS, 387, 536
- Gentile et al. (2010) Gentile G., Famaey B., de Blok W. J. G., 2010, ArXiv e-prints
- Gentile et al. (2004) Gentile G., Salucci P., Klein U., Vergani D., Kalberla P., 2004, MNRAS, 351, 903
- Ghigna et al. (1998) Ghigna S., Moore B., Governato F., Lake G., Quinn T., Stadel J., 1998, MNRAS, 300, 146
- Ghigna et al. (2000) Ghigna S., Moore B., Governato F., Lake G., Quinn T., Stadel J., 2000, ApJ, 544, 616
- Gondolo & Silk (1999) Gondolo P., Silk J., 1999, Physical Review Letters, 83, 1719
- Goodman (2000) Goodman J., 2000, New Astronomy, 5, 103
- Hayashi et al. (2004) Hayashi E., Navarro J. F., Power C., Jenkins A., Frenk C. S., White S. D. M., Springel V., Stadel J., Quinn T. R., 2004, MNRAS, 355, 794
- Hooper et al. (2007) Hooper D., Finkbeiner D. P., Dobler G., 2007, Phys. Rev. D, 76, 083012
- Hu et al. (2000) Hu W., Barkana R., Gruzinov A., 2000, Physical Review Letters, 85, 1158
- Iocco et al. (2008) Iocco F., Bressan A., Ripamonti E., Schneider R., Ferrara A., Marigo P., 2008, MNRAS, 390, 1655
- Jing & Suto (2000) Jing Y. P., Suto Y., 2000, ApJ, 529, L69
- Kanzaki et al. (2010) Kanzaki T., Kawasaki M., Nakayama K., 2010, Progress of Theoretical Physics, 123, 853
- Kaplinghat et al. (2000) Kaplinghat M., Knox L., Turner M. S., 2000, Physical Review Letters, 85, 3335
- Klypin et al. (2001) Klypin A., Kravtsov A. V., Bullock J. S., Primack J. R., 2001, ApJ, 554, 903
- Klypin et al. (2002) Klypin A., Zhao H., Somerville R. S., 2002, ApJ, 573, 597
- Kravtsov et al. (1998) Kravtsov A. V., Klypin A. A., Bullock J. S., Primack J. R., 1998, ApJ, 502, 48
- Kuzio de Naray et al. (2008) Kuzio de Naray R., McGaugh S. S., de Blok W. J. G., 2008, ApJ, 676, 920
- Longair (1981) Longair M. S., 1981, High energy astrophysics. an informal introduction for students of physics and astronomy
- Mapelli et al. (2006) Mapelli M., Ferrara A., Pierpaoli E., 2006, MNRAS, 369, 1719
- Marchesini et al. (2002) Marchesini D., D’Onghia E., Chincarini G., Firmani C., Conconi P., Molinari E., Zacchei A., 2002, ApJ, 575, 801
- Mashchenko et al. (2006) Mashchenko S., Couchman H. M. P., Wadsley J., 2006, Nature, 442, 539
- McGaugh & de Blok (1998) McGaugh S. S., de Blok W. J. G., 1998, ApJ, 499, 41
- Moore (1994) Moore B., 1994, Nature, 370, 629
- Moore et al. (1998) Moore B., Governato F., Quinn T., Stadel J., Lake G., 1998, ApJ, 499, L5+
- Moore et al. (1999) Moore B., Quinn T., Governato F., Stadel J., Lake G., 1999, MNRAS, 310, 1147
- Morselli et al. (2002) Morselli A., Lionetto A., Cesarini A., Fucito F., Ullio P., 2002, Nuclear Physics B Proceedings Supplements, 113, 213
- Natarajan et al. (2009) Natarajan A., Tan J. C., O’Shea B. W., 2009, ApJ, 692, 574
- Natarajan et al. (2008) Natarajan P., Croton D., Bertone G., 2008, MNRAS, 388, 1652
- Navarro et al. (1996) Navarro J. F., Frenk C. S., White S. D. M., 1996, ApJ, 462, 563
- Navarro et al. (1997) Navarro J. F., Frenk C. S., White S. D. M., 1997, ApJ, 490, 493
- Navarro et al. (2004) Navarro J. F., Hayashi E., Power C., Jenkins A. R., Frenk C. S., White S. D. M., Springel V., Stadel J., Quinn T. R., 2004, MNRAS, 349, 1039
- Navarro et al. (2010) Navarro J. F., Ludlow A., Springel V., Wang J., Vogelsberger M., White S. D. M., Jenkins A., Frenk C. S., Helmi A., 2010, MNRAS, 402, 21
- Oh et al. (2010) Oh S., Brook C., Governato F., Brinks E., Mayer L., de Blok W. J. G., Brooks A., Walter F., 2010, ArXiv e-prints
- Oh et al. (2010) Oh S., de Blok W. J. G., Brinks E., Walter F., Kennicutt Jr R. C., 2010, ArXiv e-prints
- Padmanabhan & Finkbeiner (2005) Padmanabhan N., Finkbeiner D. P., 2005, Phys. Rev. D, 72, 023508
- Pato et al. (2009) Pato M., Pieri L., Bertone G., 2009, Phys. Rev. D, 80, 103510
- Peebles (2000) Peebles P. J. E., 2000, ApJ, 534, L127
- Porter & Moskalenko (2005) Porter T. A., Moskalenko I. V., 2005, in International Cosmic Ray Conference Vol. 4 of International Cosmic Ray Conference, A new estimate of the Galactic interstellar radiation field between 0.1um and 1000um. pp 77–+
- Power et al. (2003) Power C., Navarro J. F., Jenkins A., Frenk C. S., White S. D. M., Springel V., Stadel J., Quinn T., 2003, MNRAS, 338, 14
- Prada et al. (2004) Prada F., Klypin A., Flix J., Martínez M., Simonneau E., 2004, Physical Review Letters, 93, 241301
- Profumo & Ullio (2010) Profumo S., Ullio P., 2010, ArXiv1001.4086
- Reed et al. (2005) Reed D., Governato F., Verde L., Gardner J., Quinn T., Stadel J., Merritt D., Lake G., 2005, MNRAS, 357, 82
- Regis (2008) Regis M., 2008, Physics Letters B, 663, 250
- Regis & Ullio (2008) Regis M., Ullio P., 2008, Phys. Rev. D, 78, 043505
- Rephaeli (1979) Rephaeli Y., 1979, ApJ, 227, 364
- Ripamonti et al. (2010) Ripamonti E., Iocco F., Ferrara A., Schneider R., Bressan A., Marigo P., 2010, MNRAS, pp 883–+
- Ripamonti et al. (2007) Ripamonti E., Mapelli M., Ferrara A., 2007, MNRAS, 375, 1399
- Robin et al. (2003) Robin A. C., Reylé C., Derrière S., Picaud S., 2003, A&A, 409, 523
- Sanders & McGaugh (2002) Sanders R. H., McGaugh S. S., 2002, ARA&A, 40, 263
- Sarazin (1999) Sarazin C. L., 1999, ApJ, 520, 529
- Sofue & Rubin (2001) Sofue Y., Rubin V., 2001, ARA&A, 39, 137
- Sommer-Larsen & Dolgov (2001) Sommer-Larsen J., Dolgov A., 2001, ApJ, 551, 608
- Spano et al. (2008) Spano M., Marcelin M., Amram P., Carignan C., Epinat B., Hernandez O., 2008, MNRAS, 383, 297
- Spergel & Steinhardt (2000) Spergel D. N., Steinhardt P. J., 2000, Physical Review Letters, 84, 3760
- Spolyar et al. (2008) Spolyar D., Freese K., Gondolo P., 2008, Physical Review Letters, 100, 051101
- Springel et al. (2008) Springel V., White S. D. M., Frenk C. S., Navarro J. F., Jenkins A., Vogelsberger M., Wang J., Ludlow A., Helmi A., 2008, Nature, 456, 73
- Stoehr et al. (2003) Stoehr F., White S. D. M., Springel V., Tormen G., Yoshida N., 2003, MNRAS, 345, 1313
- Ullio et al. (2002) Ullio P., Bergström L., Edsjö J., Lacey C., 2002, Phys. Rev. D, 66, 123502
- Valdés et al. (2007) Valdés M., Ferrara A., Mapelli M., Ripamonti E., 2007, MNRAS, 377, 245
- Yoshida et al. (2000) Yoshida N., Springel V., White S. D. M., Tormen G., 2000, ApJ, 544, L87
- Zhang et al. (2007) Zhang L., Chen X., Kamionkowski M., Si Z., Zheng Z., 2007, Phys. Rev. D, 76, 061301
- Zhang et al. (2006) Zhang L., Chen X., Lei Y., Si Z., 2006, Phys. Rev. D, 74, 103519