Post-outburst Observations of the Magnetically Active Pulsar J18460258. a new braking index, increased timing noise, and radiative recovery
Abstract
The 800-year old pulsar J18460258 is a unique transition object between rotation-powered pulsars and magnetars: though behaving like a rotation-powered pulsar most of the time, in 2006 it exhibited a distinctly magnetar-like outburst accompanied by a large glitch. Here we present X-ray timing observations taken with the Rossi X-ray Timing Explorer over a 2.2 year period after the X-ray outburst and glitch had recovered. We observe that the braking index of the pulsar, previously measured to be , is now , a decrease of . We also note a persistent increase in the timing noise relative to the pre-outburst level. Despite the timing changes, a 2009 Chandra X-ray Observatory observation shows that the X-ray flux and spectrum of the pulsar and its wind nebula are consistent with the quiescent levels observed in 2000.
Subject headings
pulsars: general—pulsars: individual (PSR J18460258 (catalog ))—supernovae: individual (Kes 75 (catalog ))—X-rays: starsI. Introduction
PSR J18460258 (catalog PSR J1846-0258) is the very young (800 year) X-ray pulsar at the center of the supernova remnant Kes 75 (catalog ) [21]. The pulsar has a spin period of 326-ms and usually exhibits properties common to those of rotation-powered pulsars (RPPs), including powering a bright pulsar wind nebula (PWN). This pulsar is notable for having an unusually high spin-down-inferred magnetic field ( G), and is one of the few with a measured braking index [38, , where is the spin-frequency, and and are its derivatives;]. Measured braking indices fall in the range [42, 41, 35, 37, 38, 50], all less than the canonical value of predicted for magnetic dipole radiation in a vacuum [22, e.g.,]. Explanations for include an increasing magnetic moment [9, 40, e.g.,] or the effects of magnetospheric plasma on the spin-down torque [23, 31, e.g.,].
Against expectations, PSR J18460258 exhibited distinctly magnetar-like behavior in 2006 May-July, when it showed several X-ray bursts, an X-ray flux increase [19], a sizable rotational glitch with remarkable “overshoot” recovery [36, 32], as well as spectral changes [33, 19, 44]. This pulsar, evidently an RPP/magnetar transition object, presents a unique opportunity of exploring the long-term relationship between magnetic activity and neutron star spin-down.
Bursts of X-rays and variable X-ray flux, as observed in most magnetars and PSR J18460258, are proposed to originate from small- or large-scale reorganizations of the magnetic field [47, e.g.,]. As the magnetic field is intimately connected with the temporal evolution of pulsars, comparing timing behavior before and after an episode of magnetic activity in a neutron star could provide important insight into the physics of neutron star magnetospheres. None of the magnetars have measured braking indices, despite their young ages ( kyr)11 1 See http://www.physics.mcgill.ca/pulsar/magnetar/main.html for a catalog of known magnetars.. This is because of a significant level of low-frequency timing noise [20] and in several cases, large glitches [14, and references therein], which prevent a measurement of in every known magnetar. By contrast, PSR J18460258 rotates relatively steadily, allowing for a measurement of with regular monitoring observations with the Rossi X-ray Timing Explorer (RXTE). Between its discovery in 1999 [21] and the outburst and glitch in 2006, it experienced a level of timing noise typical of young RPPs along with one small glitch ( near MJD 52210) and one small candidate glitch ( near MJD 52910).
Also available from regular RXTE monitoring is the pulsed flux of PSR J18460258. As reported by Gavriil et al. [19], the pulsed flux had returned to its quiescent value roughly two months after the 2006 May outburst and no further flux variations have been observed [36]. However, because RXTE is a non-focusing X-ray telescope, no information about the total flux or the phase-averaged spectrum are available from these data. To measure these quantities and to confirm the RXTE results, a focusing X-ray instrument like the Chandra X-ray Observatory is required.
Indeed, Chandra observations of the pulsar and PWN revealed flux and spectral changes at the time of the 2006 outburst [19, 33, 44]. The pulsar’s total flux rose considerably, but equally as interesting was its change in spectrum. The quiescent spectrum of PSR J18460258 is much like that of other young, high spin-down luminosity RPPs: a simple power law. Chandra observations showed that while in outburst, the spectrum softened significantly such that it became reminiscent of those observed from Anomalous X-ray Pulsars (AXPs), namely, well described by a power law with an additional thermal component. In addition, the superior angular resolution of Chandra allowed detailed observations of the PWN, showing that a marginal increase in flux may have occurred between 2000 and immediately post-outburst [33]. The effect of magnetar-like outbursts on PWNe is an open question, as none of the bona fide magnetars power nebulae (although see Vink & Bomba [49] and Tiengo et al. [48] for discussion of a possible PWN surrounding the AXP 1E 1547.05408). Kumar & Safi-Harb [33] suggested a causal relation between a possible increase in the PWN flux observed in 2006 and this or past magnetar-like outbursts of the pulsar, while Kargaltsev & Pavlov [28] suggested that the PWN was over-luminous compared to those of other young pulsars, perhaps owing to previous, unseen magnetar outbursts. However, a revised distance estimate of 6-kpc [34], rather than the previously claimed 19 kpc [5], reduces the implied nebular X-ray efficiency to . While this is still large, it is similar to that observed from the Crab, hence need not be powered by previous outbursts. Thus any long-term effect of the 2006 outburst on the PWN could help clarify this point.
In this paper, we report on 2.2 year of RXTE timing observations of PSR J18460258 in the post-magnetic activity, post-glitch recovery period. We perform phase-coherent and partially phase-coherent timing analyses after the 2006 glitch had largely recovered, and report a post-burst measurement of , smaller than the pre-outburst value at the 3.8 level. We also quantify the increase of the timing noise observed over the bursting episode and discuss the implications of these observations. In addition, we report on 2009 Chandra observations of the pulsar and associated PWN which show that the pulsar and PWN flux and spectra are consistent with their pre-outburst values.
II. RXTE Observations and Analysis
RXTE observations of PSR J18460258 were made using the Proportional Counter Array [27, 26, PCA;]. The PCA consists of an array of five collimated xenon/methane multi-anode proportional counter units (PCUs) operating in the 2 – 60 keV range, with a total effective area of approximately and a field of view of FWHM.
The RXTE data of PSR J18460258 are unevenly spaced over 11 years from 1999 April 18 through 2010 April 22 (MJD 51286 – 55308). Observations taken between 1999 April 18 and 21 (MJD 51286 – 51289) are excluded because they cannot be unambiguously phase connected with the rest of the data. Data from 2000 January 31 to 2008 December 10 (MJD 51574 – 54810) were reduced and analyzed previously and details can be found in Livingstone et al. [38] and Livingstone et al. [36]. Data taken between 2009 January 27 and 2010 April 22 (MJD 54858 – 55308) are described here for the first time.
Data were collected in “GoodXenon” mode, which records the arrival time (with 1-s resolution) and energy (256 channel resolution) of every unrejected event. Typically, two to three PCUs were operational during an observation. We used the first Xenon layer of each operational PCU and extracted events in channels 4 – 48 (approximately 2 – 20 keV), as this produces good quality profiles for individual observations.
Observations were downloaded from the HEASARC archive22 2 http://heasarc.gsfc.nasa.gov/docs/archive.html and data from each active PCU were merged and binned at (1/1024) s resolution. Photon arrival times were converted to barycentric dynamical time (TDB) at the solar system barycenter using the J2000 source position R.A. = , decl. [24] and the JPL DE200 solar system ephemeris.
The phase-coherent ephemeris from Livingstone et al. [36] was used to fold the time series for each new observation with 16 phase bins. Resulting profiles were cross-correlated with a high significance template profile, producing a single Time-Of-Arrival (TOA) for each observation. This process produced 265 TOAs between MJD 51574 and 55308 with a typical uncertainty of ms (3% of the pulse period). The TOAs were fitted to a timing model using the pulsar timing software package TEMPO33 3 http://www.atnf.csiro.au/research/pulsar/tempo/. Further details of the timing analysis are given in Livingstone et al. [38].
III. Timing Analysis and Results
III.1. Phase-coherent Timing Analysis
In order to make a significant measurement of a deterministic value of and thus , we restricted our phase-coherent timing analysis to MJD 54492 – 55308 (2008 January 27 – 2010 April 22), because earlier observations are highly contaminated by glitch recovery and timing noise, as discussed in Livingstone et al. [36].
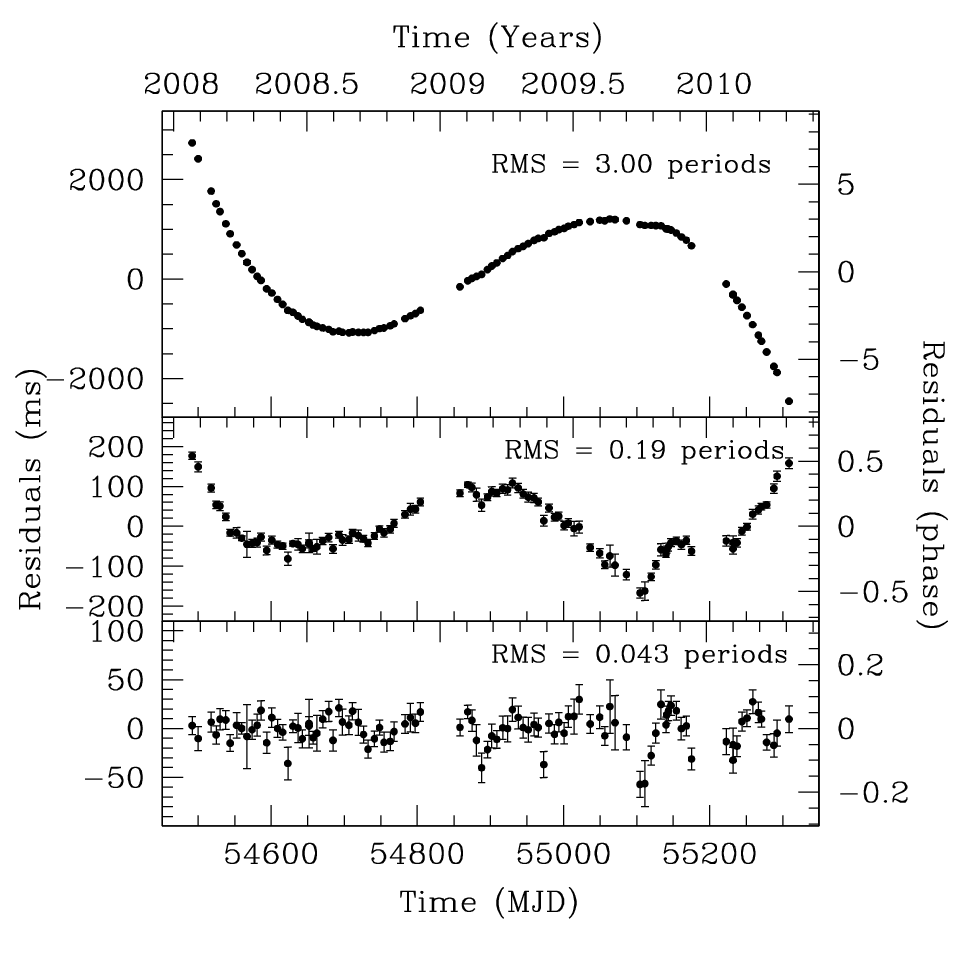
We obtained a single phase-coherent timing solution (with no phase ambiguities) fitting only and for the 100 TOAs during this time period, shown in the top panel of Figure 1. The residuals show a very significant phase contribution from a second frequency derivative (i.e., 15 phase turns over roughly 2 years). We therefore added to our phase-coherent fit, and the resulting residuals are shown in the middle panel of the figure. The fitted corresponds to a braking index of . As visible in the middle panel of Figure 1, significant timing noise remains in the data; the timing residuals are not Gaussian distributed. As a result, the formal 1 uncertainty on from this global phase-coherent fit underestimates the true uncertainty. Spin parameters from this fit are given in Table 1.
We fitted higher order frequency derivatives to “whiten” the phase residuals, a common procedure to lessen the contaminating effect of timing noise on fitted parameters [30, e.g.,]. Fitting 12 frequency derivatives (the maximum possible given the current machine precision) removes the majority of the timing noise, though does not render the phase residuals entirely Gaussian, as shown in the bottom panel of Figure 1. Table 2 shows the variation of as derivatives are fitted, as well as . The value of varies between 1.89 and 2.95 as higher order derivatives are fitted, without converging to a single value, rendering the true value of ambiguous from this analysis. Nevertheless, the range of measured values from this analysis is relatively narrow: the timing noise has increased and clearly contaminates, but does not completely dominate . In cases where a parameter is dominated by a noise process, it can be of several orders of magnitude larger and often of the wrong sign [25, e.g.,], neither of which are seen here. In cases where timing noise contaminates a measurement of a deterministic parameter but may not dominate, as for these PSR J18460258 data, using a partially coherent timing analyis can be useful to find the true value.
III.2. Partially Coherent Timing Analysis
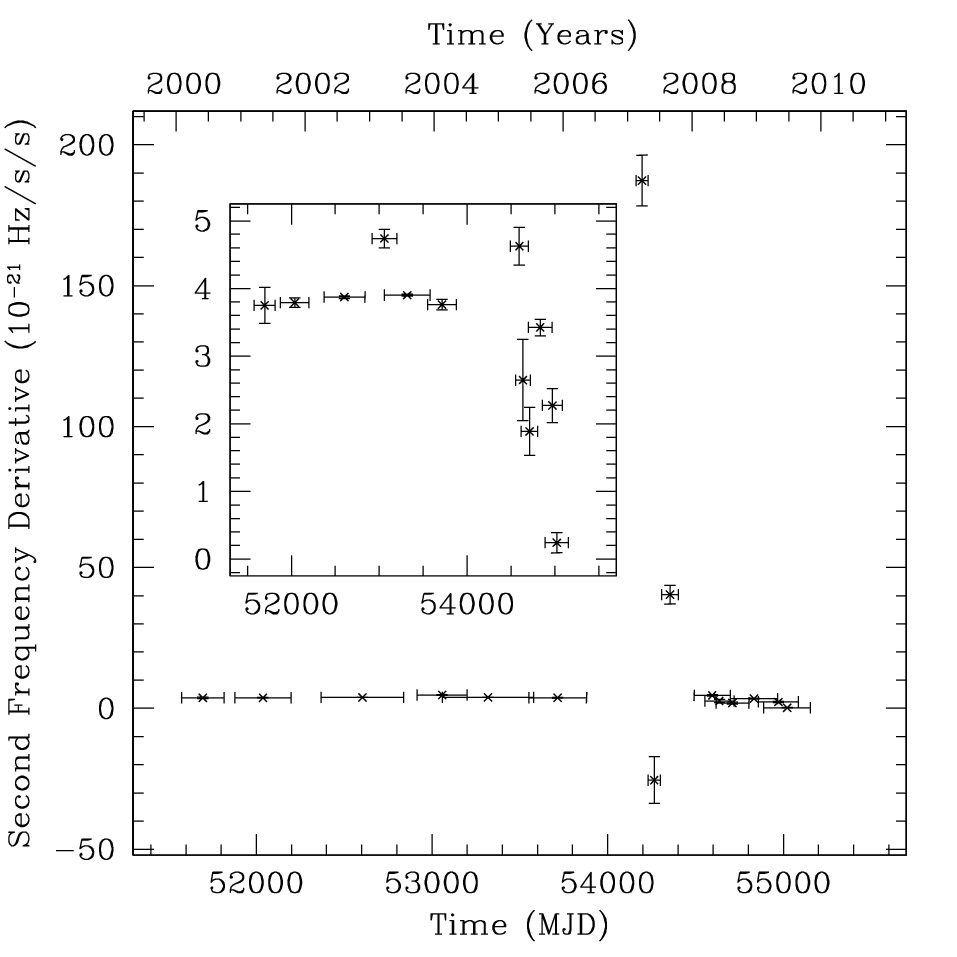
To mitigate the effects of timing noise, we performed a partially coherent timing analysis. We created 48 short phase-coherent timing solutions spanning from 2000 to 2010 (MJDs 51574–55308). For each short timing solution, we fit only and . The time span included in each subset was determined from the requirement that the reduced of the fit was 1, and that no red noise-like structure was visible in the data. In addition, we allowed the data included in each timing solution to overlap by 1/2, where sufficiently dense sampling was available. This improves coverage, which is of particular importance while the timing noise level is very high. Figure 2 shows the resulting measurements spanning from 2000 to 2010. This analysis excludes observations taken between 2006 May 31 and 2007 January 27, when glitch recovery and timing noise prevented a coherent timing solution. As discussed in Livingstone et al. [38] and confirmed by our current analysis, from 2000 – 2006 May, increased very regularly, except at a small glitch in 2001. The steady increase in corresponds to a braking index of , as measured from a phase-coherent analysis of these data. The large glitch (visible as a sudden decrease in by 3% in Figure 2) and the increase in timing noise had largely recovered by the beginning of 2008, as shown in the figure.
To obtain a post-burst measurement of , we ignored all timing data prior to MJD 54492 (2008 January 27), where the aforementioned glitch recovery and timing noise dominate. We performed a weighted least-squares fit to 16 measurements spanning MJDs 54492 – 55308 (2008 January 27 – 2010 April 22, shown in the inset of Figure 2). Given the large scatter in the post-burst measurements, and the known effects of timing noise on these data, it is likely that the formal uncertainties significantly underestimate the true uncertainties. Thus, to better estimate the uncertainty on , we employed a bootstrap error analysis, helpful when formal uncertainties may underestimate the true uncertainties [17], and previously used for this same purpose in Livingstone et al. [35], Livingstone et al. [37]. This results in s-3, corresponding to , where the uncertainty from the bootstrap estimate is larger than the formal uncertainty by a factor of 2.4. This new measurement of is smaller than the pre-outburst value of at the 3.8 level (or 9.1 if only the formal uncertainties are considered). Thus, the braking index decreased by , following the period of magnetar-like activity in 2006. This is the first observed significant measurement of a change of a braking index.
To further confirm a change in , we performed an identical partially coherent timing analysis on the pre-outburst measurements of . Because of the small glitch and candidate glitch, the data were separated into three large subsets. The first subset (prior to the small glitch near MJD 52210) contains only three measurements of , resulting in (where uncertainties for this measurement are the formal uncertainties because a bootstrap error analysis cannot be performed with no additional degrees of freedom). The second subset lies between the small glitch and a 78 day gap in the data (containing a candidate glitch). In this data subset, we performed a weighted least squares fit and a bootstrap error analysis on seven measurements of . This resulted in . We repeated this analysis for the eight measurements of prior to the magnetar-like outburst, resulting in . The three values of are in agreement with each other and with the value obtained from a fully phase-coherent timing analysis [38, ;]. All pre-outburst measurements of are systematically larger than that measured post-outburst. Note that the uncertainties on the two measurements of from partially coherent analyses (with bootstrap uncertainties) to pre-outburst data are smaller than the uncertainty for the post-outburst value of , despite similar data spans fitted in each case. This is indicative of an increase in the timing noise post-outburst, discussed further below.
A complicating factor in timing some magnetically active neutron stars is that pulse profile changes often accompany radiative changes and/or glitches [29, e.g.,]. This can affect measured timing parameters and must therefore be quantified. It has previously been reported that no significant changes in the pulse profile were detected during the outburst [36, 32]. We further verified that the pulse profile in the 2 year period immediately prior to the outburst is not statistically different from the summed profile from the 2 year of data used to measure , shown in Figure 3.
In order to further analyze the timing noise contaminating these data, we performed a second partially coherent timing analysis, this time with each data subset having , , and fitted. The same conditions of and Gaussian-distributed residuals, were applied to determine the length of each subset, and once again, the period between 2006 May 31 and 2007 January 27 was excluded owing to the lack of a coherent timing solution. Six values of were obtained before the outburst, while nine values of were obtained after the outburst, shown in Figure 4. The measurements of before the outburst indicate the regular rotation of the pulsar during this period, while the single value of above the average (visible in the inset) occurs directly after the candidate glitch near MJD 52910, providing the best evidence for a glitch during this period. As visible in the figure, the value of changed dramatically immediately after the outburst, to a maximum of 200 times the quiescent value, as well as varying in sign, indicating a dramatic increase in timing noise during the period of glitch recovery. The magnitude of decays as the glitch recovers during 2007. The inset of Figure 4 shows the variation of on a smaller scale. While the effects of glitch recovery and timing noise have subsided substantially by 2008, the post-outburst variation of remains larger than its pre-outburst behavior.
III.3. Timing Noise
Qualitatively, the timing noise in the 2.2 year period used to obtain the post-burst measurement of is larger than that observed prior to the outburst, though much smaller than in the initial aftermath of the outburst, when no phase-coherent timing solution was possible. One measure of the change in timing noise can be found by comparing the RMS residuals from MJDs 54492 – 55308 with those in a similar time span before the outburst. Fitting , , and phase coherently to the 2.2 year segment of data spanning MJD 53086 – 53879, just before the outburst, results in a timing solution with RMS residuals of 11.4-ms (0.035 periods), a factor of 5.5 smaller than the RMS residuals from MJDs 54492 – 55308, of 63.6 ms (0.19 periods). This shows that the timing noise post-burst is significantly larger than before the magnetar-like outburst. This is reflected in the new measurement of by the increased uncertainty compared to that on the pre-outburst value of for similar measurement baselines.
Another measure of the increase in timing noise is the time span that can be included in each partially coherent measurement of as shown in Figure 2. When the pulsar is less noisy, more data can be included in each short timing solution while satisfying the conditions that and that no red noise-like structure remain in the data. The pulse profile and pulsed flux are steady, important because variability in either could cause changes in TOA uncertainties, and thus affect the time span for each measurement. From 2000 until 2006 May, on average, each measurement of was obtained with data spanning days, while in 2007 (when glitch recovery was still a significant effect), each measurement of spanned an average of days. From 2008 to 2010, the average time span for each measurement was days. Thus, nearly four years post-outburst, the pulsar remains noisier than prior to the outburst.
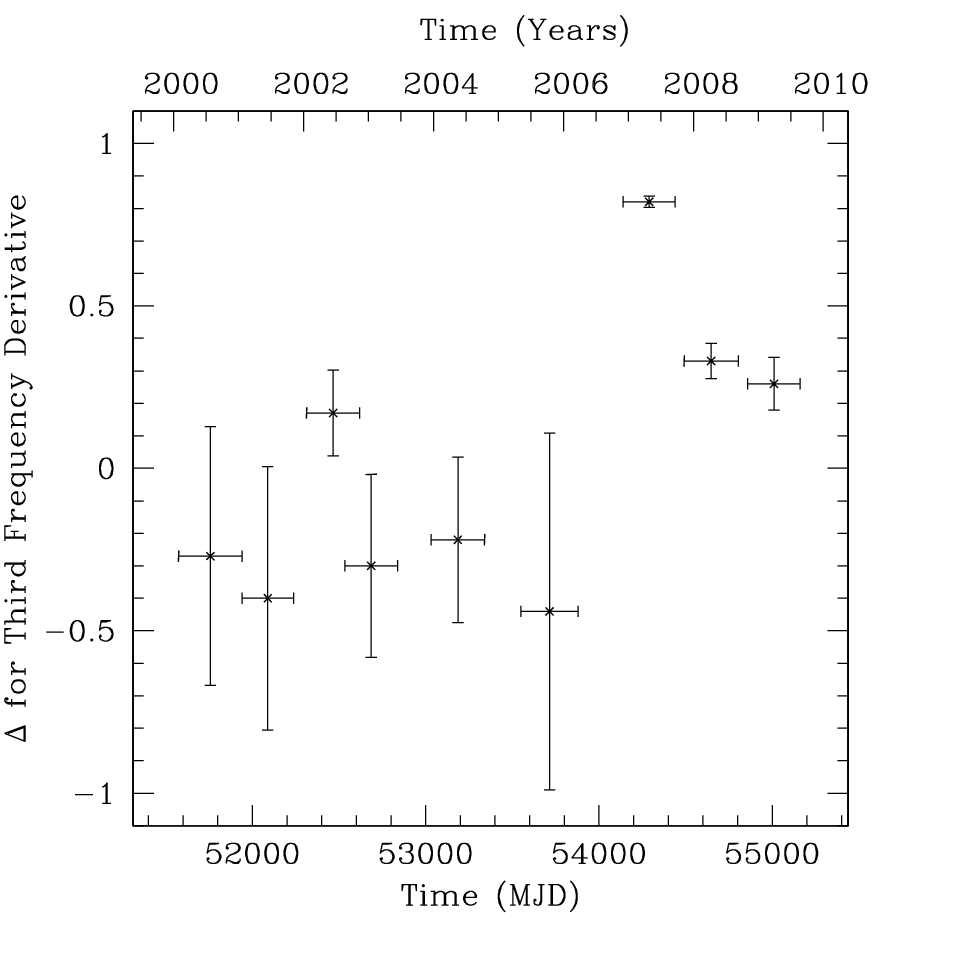
A well known measure of timing noise is the parameter, defined as the contribution to the rotational phase of the pulsar from a measurement of over a period of s assuming that is entirely dominated by timing noise [3]. This parameter is of limited value for a pulsar where is dominated instead by secular spin-down, where most of the phase contribution from is due to magnetic braking or another deterministic spin-down mechanism. To quantify the change in timing noise observed in PSR J18460258, we define a similar parameter which quantifies the contribution to the rotational phase from the measurement of the third frequency derivative, , over a time span of s. The time span is optimized for this particular pulsar, as it is the approximate amount of time required to obtain a significant measurement of , while allowing several measurements to be made given the available data span. Thus, in analogy with the parameter we define:
| (1) |
We measured the parameter for each s segment of data where a phase-coherent timing solution was available, and have shown the results in Figure 5. The value of increases dramatically after the 2006 outburst, after which it decays, but by 2010 has not returned to the pre-outburst quiescent level.
IV. CHANDRA Observations and Analysis
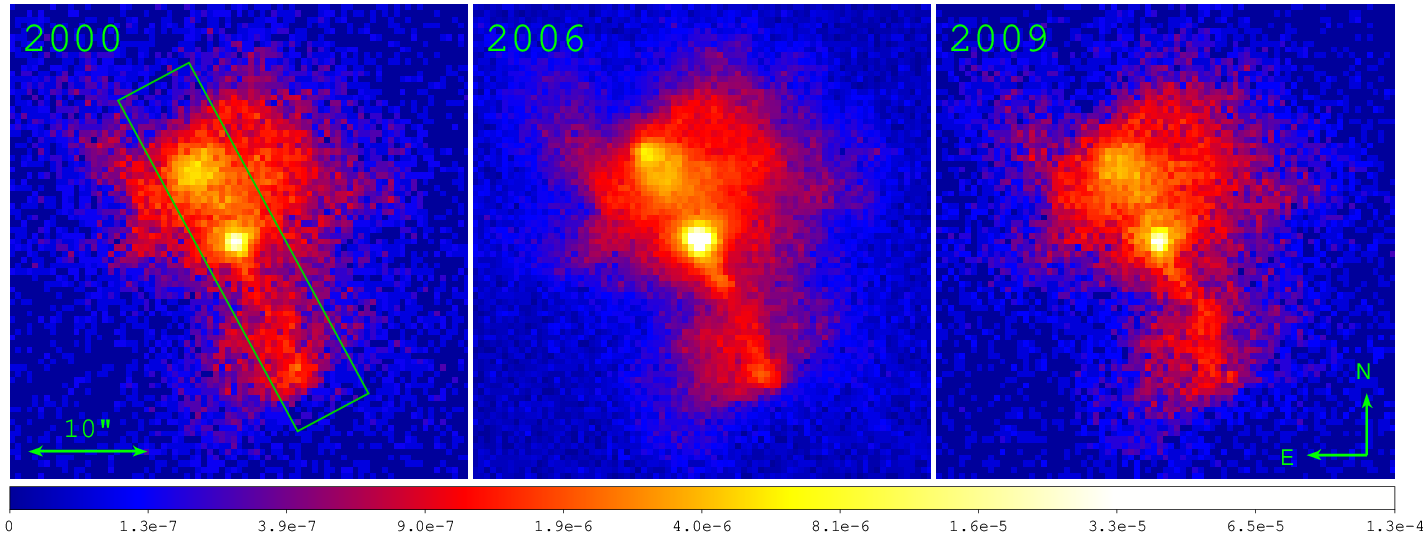
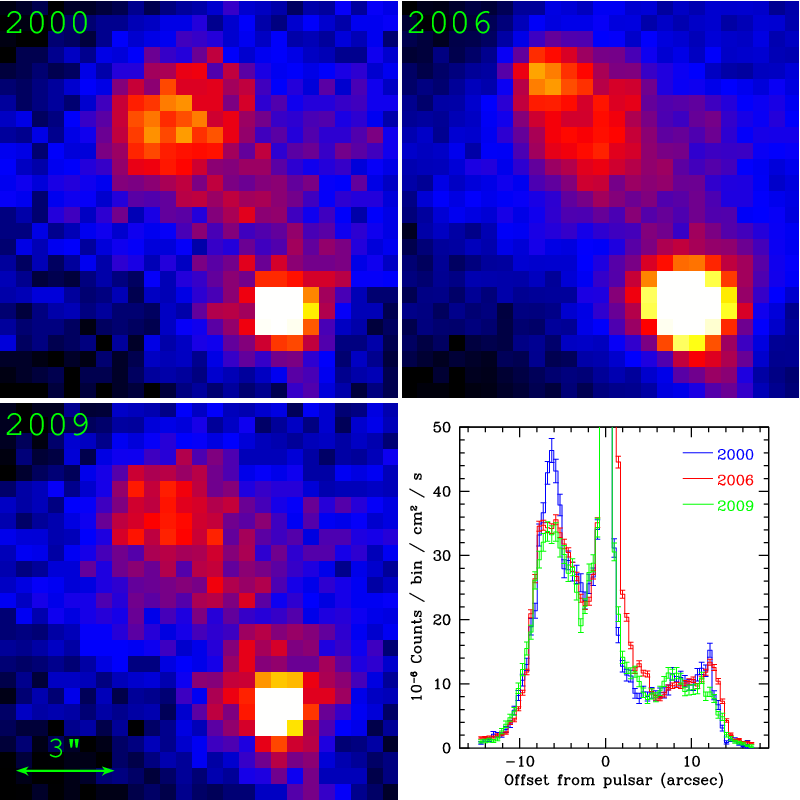
PSR J18460258 was previously observed with the Chandra X-ray Observatory in 2000 and 2006 with 37-ks and 155-ks exposures, respectively. Serendipitously, the latter observation was carried out seven days after the outburst. We obtained a new Chandra imaging observation with a 44.6-ks ACIS-S exposure (ObsID 10938) on MJD 55053 (2009 August 10), over three years after the outburst. The observation was taken in 1/8 subarray mode, which gives a short frame time of 0.4-s, resulting in negligible () pileup of the pulsar counts. All the data reduction and analysis were performed with CIAO 4.144 4 http://cxc.harvard.edu/ciao4.1/. Figure 6 shows the exposure-corrected images of PSR J18460258 and the associated PWN in the 1 – 7 keV energy range. While the PWN exhibits no obvious change in the overall morphology between the three observations, time variabilities are observed in some small-scale features. The most prominent area of variability is the northern clump located northeast of the pulsar. We extracted the count profiles of the clump from the exposure-corrected images using 6 wide boxes (as indicated in Figure 6), and show the results for each epoch in Figure 7. The clump morphology evolved from a single peak in 2000 to a double peak in 2006, and back to a fainter single peak in 2009. However, there is no evidence for bulk motion of the clump, as is visible in the figure.
For the spectral analysis, we extracted the spectrum of the entire PWN excluding the central 3″ radius, and fitted it with an absorbed power-law model. The column density was fixed at cm-2 during the fit, to provide a direct comparison with previous studies [44, 33]. In the 2009 observation, we found a photon index of and an absorbed flux of erg s-1 cm-2 in the 0.5 – 10 keV range (hereafter, quoted uncertainties are 90% confidence levels). This is fully consistent with the PWN spectrum in 2000, which has and erg s-1 cm-2 [44].
For the pulsar itself, counts were extracted from a 2″radius aperture and grouped with 70 counts in each spectral bins. We followed Ng et al. (2008) to account for the nebular contamination using a power-law model with fixed and erg s-1 cm-2. As in previous studies, we started with a power-law plus blackbody model, but found that the latter component is only marginally detected, statistically insignificant. The pulsar spectrum in 2009 is adequately fitted by an absorbed power-law model with , and we derive an upper limit on the blackbody temperature of 0.25 keV at the 90% confidence level, significantly lower than the value 0.90.2 keV measured during the 2006 outburst. Table 3, compares the best-fit spectral parameters among the three epochs, indicating that the pulsar flux in 2009 is at a similar level as in 2000, much lower than that in 2006. For completeness, we also fitted a two blackbody model to the 2009 Chandra observation. While the goodness of fit is statistically similar to that obtained when fitting a power-law model, the two-blackbody model gives an unphysically high temperature of keV for the hotter thermal component. In addition, there is evidence for a continuous power-law component from 1 to 300 keV [32], rendering the two blackbody model of limited interest for this pulsar.
V. Discussion
V.1. Timing Noise and the Braking Index
We have observed a decrease in the braking index of PSR J18460258 from to , corresponding to , or a decrease of . The change in was accompanied by an increase in the timing noise of the pulsar, which remains larger than the pre-outburst level, nearly four years after the glitch and outburst on 2006 May 31. Previous long-term observations of in young pulsars have shown that they are remarkably steady. In PSR B150958, timing observations over 21 years show that varies by only [37], while the Crab pulsar exhibits variations on the order of [42].
There are two possible ways to interpret the measurement of . The first is that the true decreased by a significant amount after the 2006 outburst. The second is that the increased timing noise is causing an apparent decrease in . We discuss each of these interpretations next.
V.1.1 Variable Braking Index
If the true value of the braking index changed permanently at the time of the magnetar-like outburst, what could be the physical cause of such an effect? From the spin-down law derived assuming magnetic dipole braking [22, where is the moment of inertia, is the neutron star radius, and is the angle between the spin and magnetic axes; e.g.,],
| (2) |
we can infer that 55 5 Note that the different relationship between and than for and arises from correctly including the variability of in the spin-down luminosity, , when deriving the above spin-down law. The full form of the spin-down luminosity is , where only the first term is considered if is constant. Using the full form of in the derivation of the spin-down law leads to the dependence of on ., , or will cause .
While it is hard to imagine a physical situation causing an accelerated growth or decay in , varying values of or have been considered in the past. Counter-alignment of the magnetic field (i.e., an increasing ) results in , even if . A sudden increase in the rate of change of would produce . However, this is difficult to invoke for the observations of PSR J18460258 because the pulse profile shows no variation over the relevant time period (e.g., Figure 3). A small change in could still be possible if our line of sight is crossing the center of the pulsar beam, as a large change in the pulse profile may not be required from a small change in field orientation. However, this is hard to reconcile with the lack of detected radio pulsations from the source [2], which is typically interpreted as our line of sight missing the magnetic pole, from where the radio emission is thought to originate, and crossing only the wider X-ray beam. Alternatively, radio emission from PSR J18460258 may be suppressed as a result of its large magnetic field, as suggested for most known magnetars [4], although radio emission has been detected from several pulsars with higher inferred magnetic dipole strengths than observed from PSR J18460258. Nevertheless, if radio emission were suppressed in PSR J18460258, then our line of sight may cross the center of the X-ray beam, allowing for a small change in without accompanying profile changes. This point cannot be resolved, however, without further details of the geometry of the system.
An increase in the magnitude of , without a change in the orientation of the field could also cause a decrease in [9, 8]. Making all the assumptions of perfect dipole spin-down but allowing , a braking index of implies a time scale of growth for the magnetic field of 8000-year, while shortens the growth timescale to 3500-year. The possibility of magnetic field growth is intriguing given the magnetic activity observed prior to the change in . Bhattacharya & Soni [7] suggest that magnetar-strength fields emerge over a period of time, as shielding currents dissipate. If the effective is currently in such a period of growth, the smaller value of could result [40]. However, this picture lacks a description of why the -growth timescale should have increased so rapidly.
The standard spin-down law (Equation 2) is a major idealization even for rotation-powered pulsars; for magnetars, the picture is almost certainly much more complicated. According to one version of the magnetar model, there is a one-to-one relationship between and the large-scale twist angle between the north and south hemispheres of magnetic field, [47]. Here, a decrease in would imply an increase in the twist angle. A braking index of corresponds to a twist angle of rad, while implies a twist angle of rad. If the magnetic field remains approximately constant before and after the outburst, such an increase in the twist angle should be accompanied by an increase in the X-ray luminosity of , whereas no persistent increase in is observed in PSR J18460258 as evidenced by the consistent flux value measured with Chandra in 2000 and 2009. Furthermore, while the above model assumes a global magnetic field twist, Beloborodov [6] argues that such global self-similar twists do not present a viable explanation for magnetar behavior. Instead, he suggests that magnetospheric currents are confined to narrow regions on the most extended field lines, which are not responsible for the bulk of magnetar X-ray emission. If this picture is correct, the spin-down of the star can vary without accompanying changes in X-ray luminosity. In addition, this model predicts that an increase in spin-down torque (though not necessarily monotonic) should occur sometime after a radiative event, and should eventually return to the pre-outburst torque value. Qualitatively, this seems to present an explanation of the observed timing variability in PSR J18460258; however, it provides no quantitative prediction for . A variable provides an unambiguous test of the theory of spin-down presented by Melatos [43]. He posits that the radius relevant to neutron star spin-down is not the point-like neutron star radius, but a somewhat larger “vacuum radius” where field aligned flow breaks down. This radius is large enough that the system can no longer be treated as a point dipole, resulting in modifications to the standard spin-down predictions. In the context of this model, a measurement of , , and uniquely predicts . While there is no estimate of for PSR J18460258, there are now two measurements of so that the theory can be tested. Given the observed change in , and assuming that is stable over the magnetar-like outburst, this theory predicts that the magnetic field should have increased by a factor of 6. This is not observed, however, as the magnetic field estimate has increased by just 0.3% compared with the pre-outburst value, in contradiction to this theory. Alternatively, if is roughly constant as observed, and instead were allowed to change at the time of the event, Melatos [43] predicts that the angle between the spin and magnetic axes would have changed from 9∘ to 4∘. Such a change might be visible as differences in the pulse profile for some lines of sight, but cannot be excluded given the lack of observed profile changes.
Another possible explanation put forth for a static measurement of is that magnetic field lines are deformed due to plasma in the magnetosphere [9]. A sudden increase in the amount of plasma in the magnetosphere of PSR J18460258, perhaps injected at the time of the magnetar-like outburst, could cause to decrease. The best evidence for a plasma-filled magnetosphere affecting pulsar spin-down is found from the “intermittent” radio pulsar, PSR B1931+24, which has dramatic, quasi-periodic changes in correlated with radio pulsations which turn on and off [31]. [23] propose that spin down can arise from a combination of magnetic dipole radiation and wind losses. An increase in losses from the wind relative to dipole radiation will manifest as a smaller value of . The spin-down formula given by Harding et al. [23] implies a braking index of
| (3) |
where is the kinematic luminosity of the wind, which can, in turn, be estimated with a measurement of . For PSR J18460258, a change in from 2.65 to 2.16 corresponds to nearly an order of magnitude increase in the persistent particle luminosity from erg s-1 to erg s-1. Because the outflowing particles travel near the speed of light, the additional particles would populate the PWN and be observable as a factor of 6 increase in the PWN flux in the 2009 Chandra observation as compared to the observation in 2000. However, no such flux increase is detected (see Section 4). The lack of a PWN flux increase seems to refute the idea that an increase in wind losses is responsible for , however, a more rigorous derivation of the relationship between wind losses and spin down may provide further insight into this issue.
Interestingly, because a change in the plasma conditions in the magnetosphere might also affect magnetospheric torques, this could possibly explain an increase in timing noise [11, e.g.,]. As shown by Lyne et al. [39], timing noise in some pulsars can be traced to magnetospheric fluctuations. For these radio pulsars, there is a correlation between torque variations and pulse shape changes. This is difficult to apply in the case of PSR J18460258 because no radio pulsations have been detected [2], and there is no evidence for profile variability in the X-ray band (see Figure 3).
Contopoulos & Spitkovsky [12] note that if the co-rotation radius of the magnetosphere, , is less than the light cylinder radius, , owing to imperfect reconnection within the magnetosphere, will result. If the co-rotation radius decreased at the time of the magnetar-like outburst from magnetic field lines opening, would also decrease. They parameterize the relationship between and as
| (4) |
If the initial spin-period of PSR J18460258 was ms, the implied co-rotation radius prior to outburst was when , and would have decreased to 0.09 post-outburst when . Changes to the extent of the co-rotation region of the magnetosphere might be visible as changes in the pulse profile; however, no such changes have been observed from PSR J18460258. In the context of this model, however, it is impossible to rule out changes to the extent of the magnetosphere as no independent estimate of the initial spin period is available. In the context of this model, taking ms as the lower limit on the birth spin period for PSR J18460258, provides a lower limit on the co-rotation radius for any measured value of . Furthermore, ms provides an upper limit on the change in co-rotation radius at the two epochs, since this quantity decreases with slower birth spin periods.
V.1.2 Timing Noise
The second possible interpretation of is that the true is constant but remains masked by the high timing noise. The increase in timing noise could arise as a result of changes to the superfluid interior brought on by the unusual 2006 glitch or changes in the magnetosphere after the outburst. Though a bootstrap error analysis was employed in order to better account for the effect of the increase in timing noise, a definitive test is not possible. Continued timing observations may be able to solve this issue, if the timing noise level continues to decrease and the new braking index remains steady. However, it is also possible that the increased level of timing noise and the decreased braking index are connected, for example, via an increase in the magnetospheric plasma density. In that case, if the pre-outburst conditions are eventually reobtained, both the timing noise and braking index should relax to their pre-outburst values, rendering a temporary value of ambiguous in nature.
Fluctuation in pinned superfluid in the pulsar interior is one of the possible causes of timing noise [1, e.g.,]. Thus, one possible explanation for the increase in timing noise is that significant changes were imparted to the neutron star interior at the time of the 2006 glitch and outburst. The glitch was followed by an unusual over-shoot recovery ( on a timescale of 127 days) and a permanent increase in the magnitude of [36, with fractional magnitude ;]. This recovery is thus far unique among pulsar glitches and the origin and long-term consequences of such behavior are not well understood. By contrast, the permanent change in following the glitch is not unusual when compared to those measured after other glitches. In addition, we note that the change in is not responsible for the observed decrease in . Because the fractional increase in is three orders of magnitude smaller than the fractional change in , it is the latter effect that dominates the change in .
In addition to the detected glitch recovery and permanent increase in , non-monotonic variations in were observed in the aftermath of the glitch. While glitch recovery (i.e., a temporary increase in ) and discrete jumps in accompanying a glitch are both established phenomena, to our knowledge, no other RPP has experienced changes in timing noise similar to those observed from PSR J18460258. However, variable spin-down torque has been observed in several magnetars. The AXP 1E 1048.15937 twice experienced approximately year-long periods of rapid variations, i.e., sudden, but temporary increases in timing noise [20, 15]. Similar variations in were observed in the transient AXP XTE 1810197 after its 2003 outburst [10]. Thus, the observed change in timing noise in PSR J18460258 can be interpreted as yet another example of magnetar-like properties from this RPP, even if the phenomenon is currently unexplained.
V.2. Phase-averaged pulsar flux and the pulsar wind nebula
The Chandra results show that the phase-averaged pulsar flux and spectrum in 2009 have returned to the quiescent values observed in 2000. This agrees with the pulsed flux history from RXTE, where the initial flux increase in 2006 was observed to decay exponentially with days [19], and has since remained at the quiescent level [36]. Given that the 2009 Chandra data were taken over 1000 days after the 2006 outburst, our findings are not unexpected. The time variability of the small-scale features in the PWN could be attributed to magnetohydrodynamic instabilities in the flow, similar to what has been observed in the PWNe powered by the Vela pulsar and PSR B150958 [46, 13] and is unlikely to be related to a sudden deposition of particles at the time of the outburst. Gavriil et al. [19] reported an energy release of erg (2 – 60 keV) in the 2006 outburst. In comparison, the total energy released in the giant flare from the magnetar SGR 180620 in 2004 is erg [45], of which erg went into particle energy [18]. The resulting ratio between the particle energy and electromagnetic radiation is . If the same ratio holds for PSR J18460258, then the energy of the injected particles would be only erg. With a -field strength of 15 G in the PWN (Djannati-Ataï et al. 2007), the synchrotron cooling timescale of a particle emitting at 5-keV is 300-year. These particles would have induced an X-ray flux enhancement in the PWN of erg s-1 cm-2. This is five orders of magnitude lower than the X-ray flux of the northern clump, and six orders lower than that of the entire PWN, too small to be detected. Moreover, if the particles travel isotropically with a typical post-shock flow speed of , the flux would have already spread over the entire PWN of 10″ radius. Therefore, we do not expect the 2006 outburst to have any observable effects on the PWN.
VI. Conclusions
The observed change in after the magnetar-like outburst in PSR J18460258, if shown to be steady via ongoing timing observations, has important implications for the physics of neutron star spin-down. A decrease in could have several origins, and a detailed theoretical framework is necessary for interpreting this observation.
Most theoretical descriptions of a changing require an accompanying persistent change in radiative behavior of the pulsar, while we observe neither pulse profile variability or persistent flux enhancement. An increase in particle wind losses relative to dipole losses does not provide a good description of for PSR J18460258 because of the lack of a persistent increase in PWN luminosity [23]. However, variability in magnetospheric plasma remains a promising avenue for future consideration, especially considering the recent report of variable spin-down rate correlated with radio pulse shape changes for several pulsars, which confirms a link between torque and emission properties in several pulsars [39]. No variability in the X-ray pulse profile is detected in PSR J18460258; however, small shape changes may be present but not observable in current data. In addition, short time-scale variability would not be detectable in RXTE observations which are typically from 1.5 to 2 hr long.
The timing noise in PSR J18460258 is observed to be of a higher level than prior to the outburst. That is, even four years after the glitch and magnetic activity, the pulsar is rotating less regularly than in its pre-outburst quiescent state. It is interesting to note, however, that the current timing noise in PSR J18460258 would not be unusual if observed in any young pulsar. Rather, it is the sudden change in the level of timing noise in PSR J18460258 that is noteworthy. Since the timing noise is simply of a higher level and not otherwise different from that observed in other pulsars, the phenomenon cannot be used as a diagnostic of previous unseen magnetic activity in other pulsars.
The observed decrease in and increase in timing noise reported here may or may not be permanent. Regular monitoring observations beyond the RXTE era may help to answer this question, as well as to search for future magnetar-like X-ray outbursts and glitches from PSR J18460258.
The 2009 Chandra observations of PSR J18460258 show that the total flux and spectrum are consistent with the quiescent values observed in 2000. No significant variability was detected in the PWN that can be associated with the 2006 outburst, nor, given the energetics of the outburst, would any be expected. The variability of the PWN observed in the 2006 Chandra observation is most likely unrelated to the outburst, and is probably similar in origin to the variation in small-scale features seen in other PWNe.
References
- [1] Alpar, M. A., Nandkumar, R., & Pines, D. 1986, ApJ, 311, 197
- [2] Archibald, A. M., Kaspi, V. M., Livingstone, M. A., & McLaughlin, M. A. 2008, ApJ, 688, 550
- [3] Arzoumanian, Z., Nice, D. J., Taylor, J. H., & Thorsett, S. E. 1994, ApJ, 422, 671
- [4] Baring, M. G. & Harding, A. K. 1998, ApJ, 507, L55
- [5] Becker, R. H. & Helfand, D. J. 1984, ApJ, 283, 154
- [6] Beloborodov, A. M. 2009, ApJ, 703, 1044
- [7] Bhattacharya, D. & Soni, V. 2007, arXiv:0705.0592
- [8] Blandford, R. D., Applegate, J. H., & Hernquist, L. 1983, MNRAS, 204, 1025
- [9] Blandford, R. D. & Romani, R. W. 1988, MNRAS, 234, 57P
- [10] Camilo, F., et al. 2007, ApJ, 669, 561
- [11] Cheng, K. S. 1987, ApJ, 321, 799
- [12] Contopoulos, I. & Spitkovsky, A. 2006, ApJ, 643, 1139
- [13] DeLaney, T., Gaensler, B. M., Arons, J., & Pivovaroff, M. J. 2006, ApJ, 640, 929
- [14] Dib, R., Kaspi, V. M., & Gavriil, F. P. 2008, ApJ, 673, 1044
- [15] —. 2009, ApJ, 702, 614
- [16] Djannati-Ataï, A., De Jager, O. C., Terrier, R., Gallant, Y. A., & Hoppe, S. 2008, in Proc. 30th Int. Cosmic Ray Conf. 2, ed R. Caballero, J. C. D’Olivo, G. Medina-Tanco, L. Nellen, F. A. Sánchez, & J. F. Valdés-Galicia, (Merida: Mexico City, Mexico), 823
- [17] Efron, B. 1979, The Annals of Statistics, 7, 1
- [18] Gaensler, B. M., Kouveliotou, C., Gelfand, J. D., Taylor, G. B., Eichler, D., Wijers, R. A. M. J., Granot, J., Ramirez-Ruiz, E., Lyubarsky, Y. E., Hunstead, R. W., Campbell-Wilson, D., van der Horst, A. J., McLaughlin, M. A., Fender, R. P., Garrett, M. A., Newton-McGee, K. J., Palmer, D. M., Gehrels, N., & Woods, P. M. 2005, Nature, 434, 1104
- [19] Gavriil, F. P., Gonzalez, M. E., Gotthelf, E. V., Kaspi, V. M., Livingstone, M. A., & Woods, P. M. 2008, Science, 319, 1802
- [20] Gavriil, F. P. & Kaspi, V. M. 2004, ApJ, 609, L67
- [21] Gotthelf, E. V., Vasisht, G., Boylan-Kolchin, M., & Torii, K. 2000, ApJ, 542, L37
- [22] Gunn, J. E. & Ostriker, J. P. 1969, Nature, 221, 454
- [23] Harding, A. K., Contopoulos, I., & Kazanas, D. 1999, ApJ, 525, L125
- [24] Helfand, D. J., Collins, B. F., & Gotthelf, E. V. 2003, ApJ, 582, 783
- [25] Hobbs, G., Lyne, A. G., & Kramer, M. 2010, MNRAS, 402, 1027
- [26] Jahoda, K., Markwardt, C. B., Radeva, Y., Rots, A. H., Stark, M. J., Swank, J. H., Strohmayer, T. E., & Zhang, W. 2006, ApJS, 163, 401
- [27] Jahoda, K., Swank, J. H., Giles, A. B., Stark, M. J., Strohmayer, T., Zhang, W., & Morgan, E. H. 1996, Proc. SPIE, 2808, 59
- [28] Kargaltsev, O. & Pavlov, G. G. 2008, in AIP Conf. Ser. 983, 40 Years of Pulsars: Millisecond Pulsars, Magnetars and More, ed. C. Bassa, Z. Wang, A. Cumming, & V. M. Kaspi, (Melville, NY:AIP), 171
- [29] Kaspi, V. M., Gavriil, F. P., Woods, P. M., Jensen, J. B., Roberts, M. S. E., & Chakrabarty, D. 2003, ApJ, 588, L93
- [30] Kaspi, V. M., Manchester, R. N., Siegman, B., Johnston, S., & Lyne, A. G. 1994, ApJ, 422, L83
- [31] Kramer, M., Lyne, A. G., O’Brien, J. T., Jordan, C. A., & Lorimer, D. R. 2006, Science, 312, 549
- [32] Kuiper, L. & Hermsen, W. 2009, A & A, 501, 1031
- [33] Kumar, H. S. & Safi-Harb, S. 2008, ApJ, 678, L43
- [34] Leahy, D. A. & Tian, W. W. 2008, A&A, 480, L25
- [35] Livingstone, M. A., Kaspi, V. M., & Gavriil, F. P. 2005a, ApJ, 633, 1095
- [36] —. 2010, ApJ, 710, 1710
- [37] Livingstone, M. A., Kaspi, V. M., Gavriil, F. P., & Manchester, R. N. 2005b, ApJ, 619, 1046
- [38] Livingstone, M. A., Kaspi, V. M., Gotthelf, E. V., & Kuiper, L. 2006, ApJ, 647, 1286
- [39] Lyne, A., Hobbs, G., Kramer, M., Stairs, I., & Stappers, B. 2010, Science, 329, 408
- [40] Lyne, A. G. 2004, in IAU Symp. 218. Young Neutron Stars and Their Environments, ed. F. Camilo & B. M. Gaensler (San Francisco, CA: ASP), 257
- [41] Lyne, A. G., Pritchard, R. S., Graham-Smith, F., & Camilo, F. 1996, Nature, 381, 497
- [42] Lyne, A. G., Pritchard, R. S., & Smith, F. G. 1993, MNRAS, 265, 1003
- [43] Melatos, A. 1997, MNRAS, 288, 1049
- [44] Ng, C.-Y., Slane, P. O., Gaensler, B. M., & Hughes, J. P. 2008, ApJ, 686, 508
- [45] Palmer, D. M., et al. 2005, Nature,434, 1107
- [46] Pavlov, G. G., Teter, M. A., Kargaltsev, O., & Sanwal, D. 2003, ApJ, 591, 1157
- [47] Thompson, C., Lyutikov, M., & Kulkarni, S. R. 2002, ApJ, 574, 332
- [48] Tiengo, A., et al. 2010, ApJ, 710, 227
- [49] Vink, J. & Bamba, A., 2009, ApJ, 707, L148
- [50] Weltevrede, P., Johnston, S., & Espinoza, C. M. 2010, arXiv:1010.0857


| Phase-coherent timing analysis | |
|---|---|
| Date range (Modified Julian Day) | 54492.089 – 55308.598 |
| Date range (Years) | 2008 Jan 27 – 2010 Apr 22 |
| Number of TOAs | 100 |
| Epoch (Year) | 2009 Mar 1 |
| Epoch (MJD) | 54834.0 |
| (Hz) | 3.0621185502(4) |
| ( s-2) | 6.664350(2) |
| ( s-3) | 2.725(3) |
| Number of derivatives fitted | 2 |
| RMS residuals (ms) | 63.6 |
| Partially phase-coherent timing analysis | |
| ( s-3) | 3.13(19) |
| Braking index () | 2.16(13) |
Quoted uncertainties are the formal
uncertainties as repored by
TEMPO
for the fully phase-coherent timing analysis.
Details about the uncertainty on and
for
the partially coherent timing solution are from a bootstrap
analysis, as explained
in the text (see Section 3.1).
| Derivatives | Braking Index | |
|---|---|---|
| fitted | ||
| 2 | 1.888(2) | 39.71 |
| 3 | 2.010(3) | 6.12 |
| 4 | 1.980(8) | 6.00 |
| 5 | 2.05(1) | 5.48 |
| 6 | 2.08(2) | 5.50 |
| 7 | 2.51(4) | 3.51 |
| 8 | 2.60(4) | 3.26 |
| 9 | 2.95(7) | 2.93 |
| 10 | 2.91(7) | 2.73 |
| 11 | 2.1(1) | 2.12 |
| 12 | 2.1(1) | 2.14 |
Braking index variation with number
of fitted derivatives. The number
of degrees of
freedom for two fitted
derivatives is 96. Uncertainties are the
formal
1 uncertainties
returned by TEMPO for the timing solution
spanning
MJD 54492 – 55308.
| Epoch | T | /dof | ||||||
|---|---|---|---|---|---|---|---|---|
| ( cm-2) | ( erg | ( erg | (keV) | ( erg | ( erg | |||
| cm-2 s-1) | cm-2 s-1) | cm-2 s-1) | cm-2 s-1) | |||||
| 2000 | 0.94/38 | |||||||
| 2006 | 0.99/134 | |||||||
| 2009 | 0.84/72 |
† – held fixed in the fit.
The uncertainties quoted are 90% confidence intervals
and upper limits are at the 90% confidence level.
The 2000 and 2006 results are from Ng et al. (2008).