Fermi surfaces and quasi-particle band dispersions of the iron pnictides superconductor KFe2As2 observed by angle-resolved photoemission spectroscopy
Abstract
We have performed an angle-resolved photoemission study of the iron pnictide superconductor KFe2As2 with 4 K. Most of the observed Fermi surfaces show almost two-dimensional shapes, while one of the quasi-particle bands near the Fermi level has a strong dispersion along the direction, consistent with the result of a band-structure calculation. However, hole Fermi surfaces and are smaller than those predicted by the calculation while other Fermi surfaces are larger. These observations are consistent with the result of a de Haas-van Alphen study and a theoretical prediction on inter-band scattering, possibly indicating many body effects on the electronic structure.
Keywords:
Electronic structure, Angle resolved photoemission spectroscopy, iron pnictide superconductorPACS
63.22.+m , 61.46.Bw , 78.30.Bj1 Introduction

The discovery of the iron pnictides superconductors [1] has provided a new direction in the studies of high- superconductors. Similar to the high- cuprates superconductors, introducing charge carriers (electrons or holes) into the parent antiferromagnetic material causes superconductivity. Thus, comparison of the phase diagram of the iron pnictides with that of the high- cuprates is necessary for understanding the mechanism of the superconductivity in the pnictides and the cuprates. In the hole-doped system Ba1-xKxFe2As2 (Ba122), when the FeAs plane has as many holes as 0.2 per Fe atom, does not disappear, different from the high- cuprate. The end member of the Ba122 system KFe2As2, which has 0.5 hole per Fe site, shows 4 K [2]. Interestingly, 75As nuclear quadrupole resonance (NQR) and specific heat studies of KFe2As2 have suggested the existence of multiple nodal superconducting gaps rather than a full gap. Also, the electronic specific heat coefficient is as large as 70 mJ/K2mol [3], indicating electron mass renormalization by electron correlation. In order to study the relationship between the electron correlation strength and superconductivity, it has been desired to reveal electron energy band dispersions and Fermi surfaces (FSs) in KFe2As2. A previous angle-resolved photoemission study (ARPES) has revealed that there are hole Fermi surfaces ( and ) around the zone center while the electron pockets around the zone corner disappear and change to small hole pockets () due to the heavy hole doping [4]. However, three hole Fermi surfaces around the zone center predicted by the band-structure calculation has not been resolved. Recently, a de Haas-van Alphen (dHvA) study has revealed that the sheet which has a similar size to the sheet exists around the zone center [5]. Furthermore, the dHvA study has pointed out the shrinkage of the and sheets and the enhancement of electron mass compared to those predicted by the band-structure calculation. In the present study, in order to reveal the shapes of the FSs more precisely in the three-dimensional momentum space, we have performed an ARPES study of KFe2As2 using high-quality single crystals and various photon energies.
2 Experiment and Calculation
ARPES measurements were performed at beamline 5-4 of Stanford Synchrotron Radiation Laboratory (SSRL) with a normal incidence monochromator and a Scienta SES-R4000 electron analyzer. The typical energy and angular resolutions used for the present measurements were about 10 meV and 0.3 degree, respectively. Single crystals of KFe2As2 were grown from K flux. Samples were cleaved in situ and measured at a temperature of 15 K in a pressure better than Torr. We have performed the measurements at photon energies from =14 to 33 eV. The in-plane (, ) and out-of-plane () momentum are expressed in units of and , respectively, where Å and Å. The electronic band structure of KFe2As2 was calculated within the local density approximation (LDA) by using the full potential LAPW (FLAPW) method. We used the program codes TSPACE [10] and KANSAI-06. The experimental crystal structure [11] including the atomic position of As was used for the calculation.
3 Results and Discussion
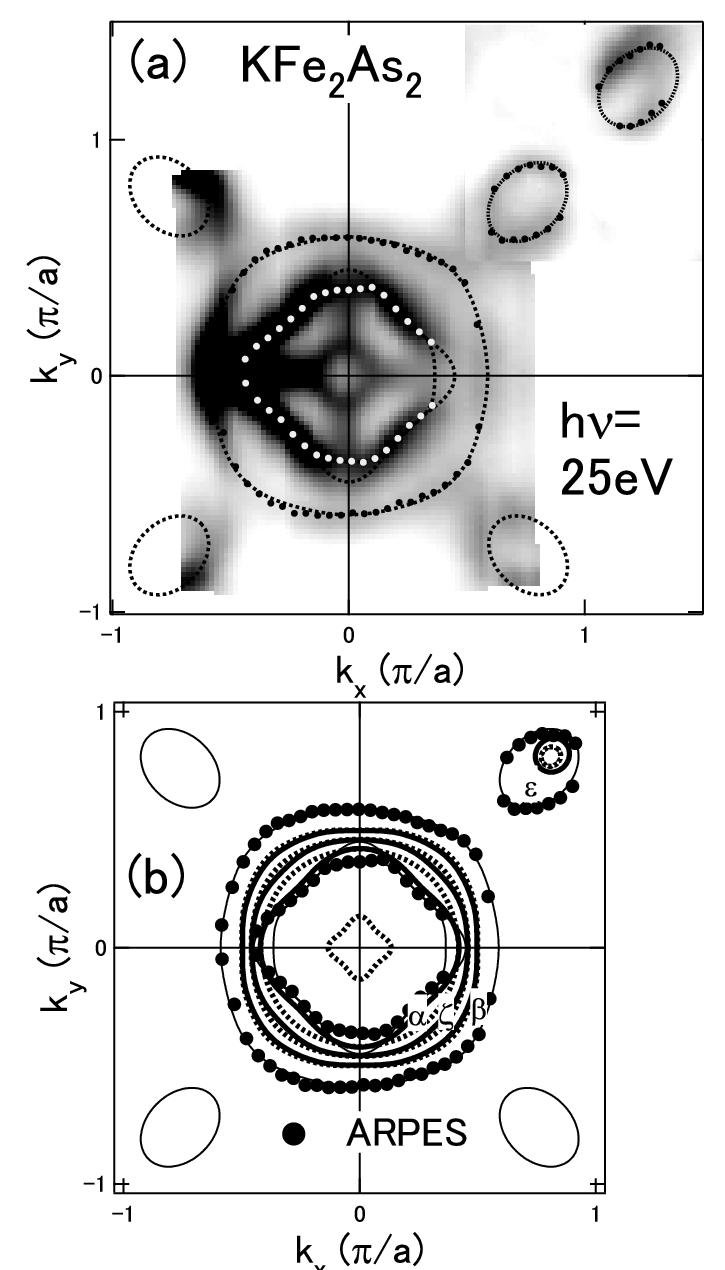
Band dispersions taken with =25 eV are shown in Fig. 1(a). The cut is along the diagonal of the two-dimensional Brillouin zone and the image has been obtained by the second derivative of the energy distribution curves. All the energy bands giving rise to the , , , and FS sheets predicted by the calculation [Fig.1(b)] are observed. Particularly, we have clearly observed the band close to the band near , consistent with the dHvA result [5]. In addition to these bands, we find that another hole-like band exists near the zone center. Since this is not predicted by the bulk band-structure calculation, this band may be due to surface states. By comparing the ARPES band dispersions with the band-structure calculation shown in Fig.1 (b), the enhancement of electron mass of the band is found to be 3. On the other hand, the dispersion of the band strongly deviates from the band-structure calculation, indicating orbital dependent mass renormalization.
Figure 2 (a) shows Fermi surfaces in the - plane of KFe2As2 obtained by ARPES. The overall Fermi surface shapes are nearly consistent with those observed in the previous study [4]. However, several new observations should be remarked. One is the observation of the sheet which has a similar size as the sheet as already pointed out above. Fermi momenta ’s obtained by the MDC peak positions show different values between the and the direction. This can be explained by existence of the two Fermi surfaces ( and ) with different matrix element effects. According to the dHvA result [5], the larger hole Fermi surface is ascribed to the Fermi surface. Another point is that a small Fermi surface around the zone center has been observed. Since this FS is not predicted by the band-structure calculation and has nearly two-dimensional dispersions as indicated below, it can be ascribed to surface states.
Here, we compare the FSs obtained by ARPES with those predicted by the band-structure calculation in Fig.2 (b). The Fermi surface areas are estimated to be 10.1, 11.8, 28.5 and 2.1 % of the Brillouin zone for , , , and , respectively, in good agreement with the results of dHvA [5]. Note that the and Fermi surfaces are smaller than those in the band-structure calculation, while the and FSs are larger. This trend may be explained by a theoretical prediction based on inter-band interaction [12].
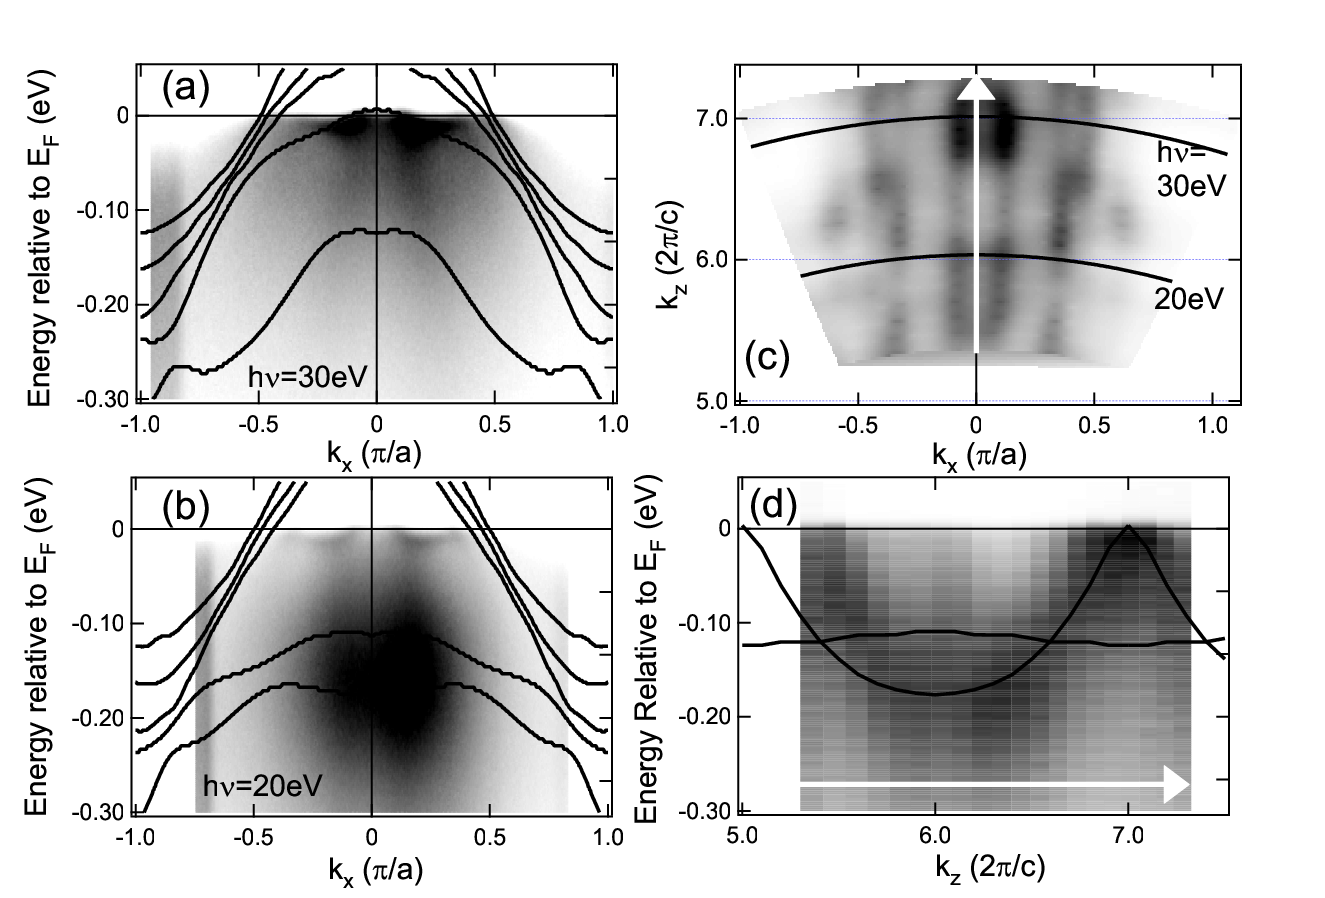
Since the Ba122 system has three dimensional FSs which are predicted by band-structure calculations [7] and confirmed by ARPES [9, 8], we have investigated the electronic band dispersions in the direction by changing the excitation photon energy. Figuer 3(c) shows spectral weight mapping at in the - plane. has been is determined by assuming an inner potential =13eV. ARPES spectra near the zone center taken at = 20 eV and 30 eV, corresponding to the cuts in Fig. 3(c), are shown in Fig. 3 (a) and Fig. 3(b), respectively. From Fig. 3(c), one can see that the observed Fermi surfaces are nearly two-dimensional, consistent with the band-structure calculation. Note that the FS of the surface state near the zone center has also two-dimensional character. From Figs. 3(a) and 3(b), one can see that the structure 0.2 eV below observed for h=20 eV moves towards for h=30 eV, indicating that the this band is dispersive along the direction. In fact, normal emission spectra [Fig.3 (d)] clearly illustrate a parabolic dispersion along the direction and slightly crosses in the vicinity of the point. From the band-structure calculation, this band can be identified as the band. With a mass enhancement factor 3, this band is also well explained by the band-structure calculation.
4 Conclusion
In summary, we have observed FSs in KFe2As2 in three-dimensional momentum space by using ARPES. All FSs except for the surface states are qualitatively consistent with the band-structure calculation. The sizes of the FSs are quantitatively consistent with the dHvA observation: the and sheets are smaller than those in the band-structure calculation while the and sheets are larger, which may be attributed to electron correlation effects.
Acknowledgement
We are grateful to H. Fukazawa, T. Terashima and M. Kimata for enlightening discussions. This work was supported by Transformative Research-Project on Iron Pnictides (TRIP) from the Japan Science and Technology Agency, and the Japan-China-Korea A3 Foresight Program from the Japan Society for the Promotion of Science. SSRL is operated by the US DOE Office of Basic Energy Science Divisions of Chemical Sciences and Material Sciences.
References
- [1] Y. Kamihara, T. Watanabe, M. Hirano, and H. Hosono, J. Am. Chem. Soc. 130, (2008) 3296.
- [2] T. Terashima, M. Kimata, H. Satsukawa, A. Harada, K. Hazama, S. Uji, H. Harima, G. F. Chen, J. L. Luo, and N. L. Wang, J. Phys. Soc. Jpn., 78, (2009) 063702.
- [3] H. Fukazawa, Y. Yamada, K. Kondo, T. Saito, Y. Kohori, K. Kuga, Y. Matsumoto, S. Nakatsuji, H. Kito, P. M. Shirage, K. Kihou, N. Takeshita, C. H. Lee, A. Iyo, and H. Eisaki, J. Phys. Soc. Jpn., 78, (2009) 083712.
- [4] T. Sato, K. Nakayama, Y. Sekiba, P. Richard, Y.-M. Xu, S. Souma, T. Takahashi, G. F. Chen, J. L. Luo, N. L. Wang, and H. Ding, Phys. Rev. Lett. 103, (2009) 047002.
- [5] T. Terashima, M. Kimata, N. Kurita, H. Satsukawa, A. Harada, K. Hazama, M. Imai, A. Sato, K. Kihou, C. H. Lee, H. Kito, H. Eisaki, A. Iyo, T. Saito, H. Fukazawa, Y. Kohori, H. Harima, and S. Uji, J. Phys. Soc. Jpn. 79 (2010) 053702.
- [6] H. Ding, P. Richard, K. Nakayama, K. Sugawara, T. Arakane, Y. Sekiba, A. Takayama, S. Souma, T. Sato, T. Takahashi, Z. Wang, X. Dai, Z. Fang, G. F. Chen, J. L. Luo, and N. L. Wang, Europhys. Lett. 83, 47001 (2008).
- [7] D. J. Singh, Phys. Rev. B 78, (2008) 094511.
- [8] P. Vilmercati, A. Fedorov, I. Vobornik, U. Manju, G. Panaccione, A. Goldoni, A. S. Sefat, M. A. McGuire, B. C. Sales, R. Jin, D. Mandrus, D. J. Singh, and N. Mannella, Phys. Rev. B 79, (2009) 220503.
- [9] W. Malaeb, T. Yoshida, A. Fujimori, M. Kubota, K. Ono, K. Kihou, P. M. Shirage, H. Kito, A. Iyo, H. Eisaki, Y. Nakajima, T. Tamegai, and R. Arita, J. Phys. Soc. Jpn. 78, (2009) 123706.
- [10] A. Yanase, FORTRAN Program for Space Group, 1st ed.,(Shokabo, Tokyo, 1985) [in Japanese].
- [11] S. Rozsa and H. U. Schuster, Z. Naturforsch. B 36, (1981) 1668.
- [12] L. Ortenzi, E. Cappelluti, L. Benfatto, and L. Pietronero, Phys. Rev. Lett. 103, (2009) 046404.