Pre-transitional disk nature of the AB Aur disk Alternate Affiliation: Based on data collected at Subaru Telescope, which is operated by the National Astronomical Observatory of Japan.
Abstract
The disk around AB Aur was imaged and resolved at 24.6 m using the Cooled Mid-Infrared Camera and Spectrometer on the 8.2m Subaru Telescope. The gaussian full-width at half-maximum of the source size is estimated to be 90 6 AU, indicating that the disk extends further out at 24.6 m than at shorter wavelengths. In order to interpret the extended 24.6 m image, we consider a disk with a reduced surface density within a boundary radius , which is motivated by radio observations that suggest a reduced inner region within about 100 AU from the star. Introducing the surface density reduction factor for the inner disk, we determine that the best match with the observed radial intensity profile at 24.6 m is achieved with =88 AU and =0.01. We suggest that the extended emission at 24.6 m is due to the enhanced emission from a wall-like structure at the boundary radius (the inner edge of the outer disk), which is caused by a jump in the surface density at . Such reduced inner disk and geometrically thick outer disk structure can also explain the more point-like nature at shorter wavelengths. We also note that this disk geometry is qualitatively similar to a pre-transitional disk, suggesting that the AB Aur disk is in a pre-transitional disk phase.
Keywords:
protoplanetary disks — circumstellar matter — stars: pre-main sequenceI Introduction
The evolution of protoplanetary disks has attracted attention because it is presumably a site of the on-going planet formation. Mostly by analyzing spectral energy distributions (SEDs), many transitional disks whose inner region is devoid of small dust grains have been detected. Recently, [16] introduced a new sub-class called pre-transitional disks with definite near-infrared (NIR) excesses that indicate the presence of an inner disk separated from an optically thick outer disk. They suggested that such a disk is forming a gap and when the inner disk dissipates, it will become a transitional disk with an inner cavity. In both cases, the presence of a wall-like structure on the inner edge of the outer disk can explain the excess mid-infrared (MIR) emission seen in the SED. For intermediate-mass young stars such as Herbig Ae/Be stars, some objects such as HD 135344B [21] and HD 100546 [3] are thought to be in the pre-transitional or transitional disk phase.
AB Aur (d=144pc; A0 Ve, [45]) has been regarded as a prototypical Herbig Ae/Be star and is one of the best-studied Herbig Ae stars, with a mass of 2.40.2 M⊙ and an age of 41 Myr [10]. Previous observations at various wavelengths revealed complex circumstellar structures at various scales. Optical and NIR coronagraphic direct images showed an extended circumstellar nebulosity of the envelope and spiral structures in the disk in scattered light [20, 18]. Recent coronagraphic polarimetric imaging observations revealed a dust annulus at a radius of 100AU [37, 39, 23] with a possible fluctuation in the azimuthal direction. Millimeter and sub-mm interferometric observations showed that the gas and dust have been depleted in the central region ( 100 AU) of the disk [40, 28].
At MIR wavelengths, many direct imaging and interferometric studies have been performed toward AB Aur. [8] imaged AB Aur at 11.7 and 18.7 m using the Keck I telescope, and resolved it at 18.7 m. They found that models with a disk surrounded by an envelope fit their data better than flared disk models. Applying a deconvolution technique to the 20.5 m data obtained at the 3.6 m Canada-France-Hawaii-Telescope (CFHT), [38] discovered a ring-like structure at 280 AU. [31] presented 11.6 and 18.5 m images using the Gemini North telescope; however, they could not find the ringlike structure reported by [38]. They derived the intrinsic source full-width half-maximum (FWHM) to be 174 AU at 11.6 m and 225 AU at 18.5 m, assuming a gaussian brightness distribution. [29, 30] also resolved the disk at 10.3 m by nulling interferometric observations and derived the diameter of the disk to be 24-30 AU.
In this paper, we present results of the first imaging observations of AB Aur at 24.6 m using the 8.2m Subaru telescope. At 24.6 m, the point-spread function (PSF) is stable compared to that at shorter wavelengths because of the larger Fried length, which enables us to observe small extended structures with high reliability. In addition, it allows us to trace the cooler part of the disk. By constructing a simple model, we discuss the disk structure of AB Aur as well as implications for the nature of the AB Aur disk.
II Observations and Data Reduction
We made imaging observations with the Cooled Mid-Infrared Camera and Spectrometer [26, 36, 41, COMICS;] on the 8.2 m Subaru Telescope on Mauna Kea, Hawaii on 2003 October 12. AB Aur was observed using the Q24.5-OLD filter (=24.6 m, =1.9 m). The plate-scale of COMICS is 0.13 arcsec per pixel. The chopping throw was 10 arcsec and the position angle (PA) of the chopping direction was 30 degree. The chopping frequency was 0.45 Hz, and the total integration time was 2005 s. Just before and after AB Aur observations, we observed Tau as the PSF reference and photometric standard star. The total integration times were 401 s and 251 s, respectively.
For data reduction, we employed a shift-and-add method to improve the spatial resolution. The imaging data consist of 0.983 s on-source integration frames. First, the thermal background and the dark current signals were removed through the subtraction of the chopped pair frames. The object was sufficiently bright to be recognized even in 0.983 s integration chop-subtracted frames, so we searched for the peak position by fitting a Gaussian with the source profile. Then we shifted the frames (in order to align the peak position) and summed them, but we excluded the frames whose gaussian FWHM deviated more than 1 from the mean value. This rejection of lower quality data resulted in an effective integration time of 1333 s for AB Aur. The same procedure was applied to the data of Tau taken before and after AB Aur observations, and the effective integration times were reduced to 327 s and 209 s, respectively. Flux calibration was performed using the Tau template spectrum provided by [15]. Standard aperture photometry was performed and the resultant flux density of AB Aur was 43.0 3.4 Jy.
III Results
III.1 Source size of AB Aur at 24.6 m
The 24.6 m images of AB Aur and Tau are shown in Fig.1. It is clear that AB Aur is extended beyond the PSF at this wavelength. The disk emission appears symmetric and we could not find clear evidence of the radial profile depending on the azimuthal angle within the uncertainty. This is probably because the disk around AB Aur is nearly face-on [18, inclination 30∘; ]. The FWHMs of shift-and-added images of AB Aur, as well as Tau before and after observations of AB Aur were 0.82”0.03”, 0.647”0.007” and 0.644”0.004”, respectively. This error is the standard deviation of the selected frames. The FWHM of the PSF reference ( Tau) is comparable to the predicted value of the diffraction-limited performance of the telescope at 24.6 m. We estimate a rough source size of AB Aur by comparing the observed AB Aur image with a circular gaussian image convolved with the observed PSF image. The best-match gaussian FWHM is 906 AU. This value is larger than that at shorter wavelengths, since the gaussian FWHMs of the AB Aur disk are repoted to be 174 AU at 11.6 m and 225 AU at 18.5 m [31].
III.2 Comparison with a simple model
Gaussian brightness distributions are used for the sake of simplicity and they are not a good representation of the true intrinsic radial brightness profile of the disk. Thus, it would be useful to compare the observed AB Aur image with a disk model for the investigation of physical properties of the disk. We can calculate the model brightness distribution of a disk if the temperature and density structure of the disk is given. Here we derive the disk structure based on a 1+1D radiative transfer model similar to that in [13]; the stellar radiation transfer is solved by the so-called grazing angle approximation, but the radiative transfer of the dust thermal radiation is solved exactly along the disk vertical axis with a variable Eddington factor method. The dust and gas are assumed to be thermally and dynamically coupled, and the vertical density structure is determined by the hydrostatic equilibrium that is maintained consistent with the temperature structure. Scattering is not taken into account. When the disk is optically thick, the model predicts a flared geometry and reproduces the spectrum of protoplanetary disks. When the disk becomes optically thin, the grazing angle approximation does not work. In such cases, we treat the stellar radiation transfer by a 2D ray-tracing method. This modification is found to work in the present calculation. We assume dust consisting of spherical astronomical silicate grains [12] and the dust size distribution given by , where is the grain radius [32]. As [39] discussed that the maximum grain size is about 1 m, we set the minimum and maximum grain sizes to be 0.005 m and 2.5 m, respectively. The stellar parameters used are: the effective temperature T∗ = 9,500 K, the radius R∗ = 2.5 R⊙, and the mass M∗ = 2.4 M⊙ [44]. We assume a power-law surface density between and , where p=1 [22], g cm-2, AU and AU. The surface density is the total (gas + dust) one and we also assume a gas-to-dust mass ratio of 100. We chose and so as to reproduce the observed far-infrared to sub-mm/mm flux densities and is the radius where the dust temperature becomes about 1,400 K. In addition, we introduce the boundary radius that separates the inner and outer regions of the disk because the inner region (within AU of the central star) is reported to show a deficiency in the mm/sub-mm dust continuum emission [40, 28], which is attributed to a decrease in the surface density of dust grains smaller than mm-size in the inner region. To account for this information in our disk modeling, we consider that the surface density is reduced by a scaling factor of 0.1, 0.01, and 0.001 for compared to the power-law surface density of the outer disk. The explored parameter space is summarized in Table 1. This reduction of the inner surface density makes the inner region much thinner than the outer disk, and as a result, a wall-like structure appears at the boundary radius. The upper part of the wall is directly illuminated by the central star; thus its temperature is enhanced like a surface super-heated layer [6]. On the other hand, the lower part of the wall remains cool because it is shadowed by the inner region [34]. In practice, we calculate the disk structures of the inner and outer regions separately, and connect them at the boundary radius . The temperature of the illuminated upper part of the wall (i.e. inner edge of the outer region) is set to be the same as the surface layer at the wall. In addition, the same treatment is adopted at the most inner edge of the disk which is also directly illuminated by the central star. We need 2D radiative transfer calculations to be self-consistent [34], which will be done in the future.
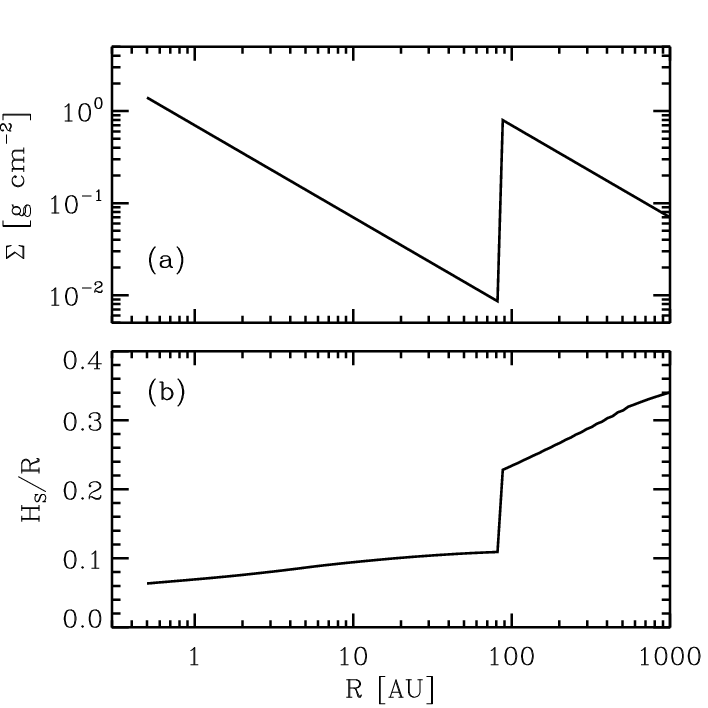
On the basis of the derived disk structure, we calculate the model brightness distribution for various wavelengths and spectrum by a ray-tracing method along the observer’s line of sight. The inclination angle is assumed to be 30∘ [18]. To compare the model brightness distribution with our observation, we create a model image where the model brightness distribution is convolved with the observed PSF image shown in Fig. 1. Finally, we find that the best match with the observed radial profile is obtained with the scaling factor of the inner disk and the boundary radius AU. This is comparable to the inner radius derived by [40] (110 AU for dust and 70 AU for CO). Fig. 2 shows the best-fit model brightness distribution at 25 m, the model image for Subaru/COMICS and its peak-normalized radial profile. Structural parameters of the best-fit model such as the radial distributions of the surface density and height, are shown in Fig. 3. The surface height was determined by the height where the stellar Planck mean opacity became unity towards the central star. The spectrum of the best-fit model also matches with that of AB Aur from 10 m to mm [24, 33, 1, and references therein] as shown in Fig. 4. For wavelengths shorter than 10 m, our model spectrum underestimates the observed spectrum of AB Aur. This may be due to the emission from the inner-most gas disk [43] or from the puffed-up inner rim [35], neither of which is considered in our model. The contribution of these inner structures to the 25 m flux density is negligible; the spectrum at 1–8 m can be well fitted by an additional blackbody of temperature 1,400 K (the upper solid line) and this blackbody component emits 1.4 Jy at 25 m, only 3% of the 25 m Infrared Astronomical Satellite (IRAS) flux density of 48 Jy (see Fig. 4).
IV Discussion
IV.1 Comparison with other observations and validity of the wall-like structure
A reduction of the surface density inside the boundary radius ( AU) and the resultant wall-like structure at can explain the extended emission we observed at 24.6 m. Additionally, this interpretation is consistent with the mm/sub-mm interferometric observations of AB Aur. Furthermore, it can explain the properties of the AB Aur disk that appear more point-like at shorter MIR wavelengths. In order to determine the extent of the AB Aur disk at these shorter MIR wavelengths from our best-fit model, we calculated 11.4 and 18 m model brightness distributions of this model, and convolved them with a gaussian model PSF comparable to the diffraction limit of an 8.2m telescope. Then we measured FWHMs of the PSF convolved model images and derived gaussian FWHMs of 8 AU at 11.4 m and 21 AU at 18 m by using the quadratic subtraction method. The value at 18 m is consistent with previous observational results by [31] and that at 11.4 m is slightly narrower than the observations [31], but the general trend is fine. The more compact nature of the AB Aur disk at the shorter MIR wavelengths relative to 25 m is due to not only the radial temperature distribution but also the temperature of the wall-like structure (96 K). This temperature is too low for dust to radiate efficiently at shorter wavelengths, resulting in little change of the appearance of the disk at shorter wavelengths. A similar situation is also seen in another Herbig Ae/Be star HD 142527, which is only marginally extended at 10 m, but clearly extended at 24.5 m [17].
Another piece of collateral evidence for the wall-like structure at AU is the agreement between the temperature (93K) of the blackbody component derived from the spectrum of AB Aur [33] and the temperature (96K) of the wall at 88 AU in our best-fit disk model. [33] suggested that this temperature might reflect the dust temperature at the onset of disk flaring. Their suggestion is qualitatively similar to ours in the sense that the wall in our model can be interpreted as the onset of the outer disk flaring.
Furthermore, the annulus of dust at 100 AU is observed in the NIR polarimetric coronagraphic images [37, 39, 23]. Inside the dust annulus of the NIR scattered light, the gap is reported at a radius of 0.5”0.6” [23, 7286AU;]. This also supports the onset of the disk flaring and the presence of a wall-like structure at 88 AU in the AB Aur disk.
IV.2 The AB Aur disk: a pre-transitional disk?
Combined with the relatively young age of the central star and the pristine environment as indicated by the global envelope structure, AB Aur has been thought to be a prototypical example of newly formed Herbig Ae/Be star [20, e.g.]. However, the inner region of the AB Aur disk possesses little gas and dust as revealed by mm/sub-mm interferometric observations [40, 28], indicating the evolved nature of the disk. Such an apparently paradoxical situation may have led to the difficulty faced by [8] in explaining the AB Aur properties with a simple flared disk model. A reduction in the inner disk surface density such as that used in our model can solve this problem. This situation is qualitatively similar to pre-transitional disks introduced for some T Tauri stars [16] in the sense that an inner disk separated from the optically thick outer disk is present. We propose that the AB Aur disk is also a pre-transitional disk.
Various mechanisms for the clearing of the inner region have been suggested such as dust coagulation [14, e.g.], inside-out evacuation by the magnetrotational instability [7, 42, e.g.], photoevaporation [2, e.g.], dynamical effects of companions [46, 47, e.g.], and so on. In the case of AB Aur, it is not clear which mechanism is the most plausible; however, the presence of planetary companions has been suggested, which may have caused the inner hole [40, 25, 23, e.g.]. The pre-transitional disk nature of the AB Aur disk may reflect ongoing planet formation.
References
- [1] Acke, B., van den Ancker, M. E., Dullemond, C. P., van Boekel, R., & Waters, L. B. F. M. 2004, A&A, 422, 621
- [2] Alexander, R. D., Clarke, C. J., & Pringle, J. E. 2006, MNRAS, 369, 229
- [3] Benisty, M., Tatulli, E., Ménard, F., & Swain, M. R. 2010, A&A, 511, A75
- [4] Bouwman, J., de Koter, A., Dominik, C., & Waters, L. B. F. M. 2003, A&A, 401, 577
- [5] Cardelli, J. A., Clayton, G. C., & Mathis, J. S. 1989, ApJ, 345, 245
- [6] Chiang, E. I., & Goldreich, P. 1997, ApJ, 490, 368
- [7] Chiang, E., & Murray-Clay, R. 2007, Nature Physics, 3, 604
- [8] Chen, C. H., & Jura, M. 2003, ApJ, 591, 267
- [9] Corder, S., Eisner, J., & Sargent, A. 2005, ApJ, 622, L133
- [10] DeWarf, L. E., Sepinsky, J. F., Guinan, E. F., Ribas, I., & Nadalin, I. 2003, ApJ, 590, 357
- [11] Dominik, C., Dullemond, C. P., Waters, L. B. F. M., & Walch, S. 2003, A&A, 398, 607
- [12] Draine, B. T., & Lee, H. M. 1984, ApJ, 285, 89
- [13] Dullemond, C. P., van Zadelhoff, G. J., & Natta, A. 2002, A&A, 389, 464
- [14] Dullemond, C. P., & Dominik, C. 2005, A&A, 434, 971
- [15] Engelke, C. W., Price, S. D., & Kraemer, K. E. 2006, AJ, 132, 1445
- [16] Espaillat, C., Calvet, N., D’Alessio, P., Hernández, J., Qi, C., Hartmann, L., Furlan, E., & Watson, D. M. 2007, ApJ, 670, L135
- [17] Fujiwara, H., et al. 2006, ApJ, 644, L133
- [18] Fukagawa, M., et al. 2004, ApJ, 605, L53
- [19] Fukagawa, M., Tamura, M., Itoh, Y., Kudo, T., Imaeda, Y., Oasa, Y., Hayashi, S. S., & Hayashi, M. 2006, ApJ, 636, L153
- [20] Grady, C. A., Woodgate, B., Bruhweiler, F. C., Boggess, A., Plait, P., Lindler, D. J., Clampin, M., & Kalas, P. 1999, ApJ, 523, L151
- [21] Grady, C. A., et al. 2009, ApJ, 699, 1822
- [22] Hartmann, L., Calvet, N., Gullbring, E., & D’Alessio, P. 1998, ApJ, 495, 385
- [23] Hashimoto, J., et al. 2010, in preparation
- [24] Helou, G., & Walker, D. W. 1988, Infrared astronomical satellite (IRAS) catalogs and atlases. Volume 7, p.1-265, 7,
- [25] Jang-Condell, H., & Kuchner, M. J. 2010, ApJ, 714, L142
- [26] Kataza, H., Okamoto, Y., Takubo, S., Onaka, T., Sako, S., Nakamura, K., Miyata, T., & Yamashita, T. 2000, Proc. SPIE, 4008, 1144
- [27] Leinert, C., et al. 2004, A&A, 423, 537
- [28] Lin, S.-Y., Ohashi, N., Lim, J., Ho, P. T. P., Fukagawa, M., & Tamura, M. 2006, ApJ, 645, 1297
- [29] Liu, W. M., Hinz, P. M., Hoffmann, W. F., Brusa, G., Miller, D., & Kenworthy, M. A. 2005, ApJ, 618, L133
- [30] Liu, W. M., Hinz, P. M., Meyer, M. R., Mamajek, E. E., Hoffmann, W. F., Brusa, G., Miller, D., & Kenworthy, M. A. 2007, ApJ, 658, 1164
- [31] Mariñas, N., Telesco, C. M., Fisher, R. S., Packham, C., & Radomski, J. T. 2006, ApJ, 653, 1353
- [32] Mathis, J. S., Rumpl, W., & Nordsieck, K. H. 1977, ApJ, 217, 425
- [33] Meeus, G., Waters, L. B. F. M., Bouwman, J., van den Ancker, M. E., Waelkens, C., & Malfait, K. 2001, A&A, 365, 476
- [34] Mulders, G. D., Dominik, C., & Min, M. 2010, arXiv:1001.2146
- [35] Natta, A., Prusti, T., Neri, R., Wooden, D., Grinin, V. P., & Mannings, V. 2001, A&A, 371, 186
- [36] Okamoto, Y. K., Kataza, H., Yamashita, T., Miyata, T., Sako, S., Takubo, S., Honda, M., & Onaka, T. 2003, Proc. SPIE, 4841, 169
- [37] Oppenheimer, B. R., et al. 2008, ApJ, 679, 1574
- [38] Pantin, E., Bouwman, J., & Lagage, P. O. 2005, A&A, 437, 525
- [39] Perrin, M. D., Schneider, G., Duchene, G., Pinte, C., Grady, C. A., Wisniewski, J. P., & Hines, D. C. 2009, ApJ, 707, L132
- [40] Piétu, V., Guilloteau, S., & Dutrey, A. 2005, A&A, 443, 945
- [41] Sako, S., et al. 2003, PASP, 115, 1407
- [42] Suzuki, T. K., Muto, T., & Inutsuka, S.-i. 2009, arXiv:0911.0311
- [43] Tannirkulam, A., et al. 2008, ApJ, 689, 513
- [44] van Boekel, R., Min, M., Waters, L. B. F. M., de Koter, A., Dominik, C., van den Ancker, M. E., & Bouwman, J. 2005, A&A, 437, 189
- [45] van den Ancker, M. E., The, P. S., Tjin A Djie, H. R. E., Catala, C., de Winter, D., Blondel, P. F. C., & Waters, L. B. F. M. 1997, A&A, 324, L33
- [46] Varnière, P., Bjorkman, J. E., Frank, A., Quillen, A. C., Carciofi, A. C., Whitney, B. A., & Wood, K. 2006, ApJ, 637, L125
- [47] Varnière, P., Blackman, E. G., Frank, A., & Quillen, A. C. 2006, ApJ, 640, 1110
| scaling factor | Boundary radius [AU] |
|---|---|
| 0.1 | 75, 81, 88, 95, 102, 110, 119, 128 |
| 0.01 | 65, 70, 75, 81, 88, 95, 102, 110, 119 |
| 0.001 | 33, 38, 44, 52, 60, 65, 70, 75, 81, 88, 95, 102 |