The Nuclear Outflow in NGC 2110
Abstract
We present a HST/STIS spectroscopic and optical/radio imaging study of the Seyfert NGC 2110 aiming to measure the dynamics and understand the nature of the nuclear outflow in the galaxy. Previous HST studies have revealed the presence of a linear structure in the Narrow-Line Region (NLR) aligned with the radio jet. We show that this structure is strongly accelerated, probably by the jet, but is unlikely to be entrained in the jet flow. The ionisation properties of this structure are consistent with photoionisation of dusty, dense gas by the active nucleus. We present a plausible geometrical model for the NLR, bringing together various components of the nuclear environment of the galaxy. We highlight the importance of the circum-nuclear disc in determining the appearance of the emission line gas and the morphology of the jet. From the dynamics of the emission line gas, we place constraints on the accelerating mechanism of the outflow and discuss the relative importance of radio source synchrotron pressure, radio jet ram pressure and nuclear radiation pressure in accelerating the gas. While all three mechanisms can account for the energetics of the emission line gas, gravitational arguments support radio jet ram pressure as the most likely source of the outflow.
Keywords:
galaxies: Individual: NGC 2110 — galaxies: Seyfert — galaxies: jets — galaxies: kinematics and dynamics — line: profiles1 Introduction
Most Active galactic nuclei (AGN) are radio-quiet, i.e, their nuclear radio emission accounts for less than about % of the bolometric luminosity of the accreting nucleus. However, many are still associated with non-thermal radio sources and, in some cases, these sources can be extended on scales of hundreds of parsecs and show collimated bi-polar jet morphologies reminiscent of the jets seen in the more powerful class of Radio Galaxies. (Nagar et al., 1999, e.g.). Among Seyfert galaxies, those that exhibit extended radio sources frequently display accelerated emission line kinematics (Whittle, 1992), which is usually interpreted as the influence of the fast moving jet outflow on the ionised gas in the Narrow-Line Region (NLR) (Whittle et al., 1988; Capetti et al., 1996; Falcke, Wilson & Simpson, 1998; Cooke et al., 2000; Cecil et al., 2002; Whittle & Wilson, 2004, e.g.,).
Ionisation studies of Seyferts generally support nuclear UV and X-ray radiation as the principal cause of NLR ionisation, even in strongly jetted Seyferts (Whittle et al., 2005, e.g., Mkn 78 - ). Models of NLR clouds with dust suggest that radiation pressure from the accreting nuclear source plays a major part in altering the pressure equilibrium of such clouds and determining their ionisation conditions (Groves et al., 2004). In addition, the energy and momentum deposited into the NLR from the nuclear radiation field can dominate the dynamics of the region and can easily account for the energy and momentum of most outflows. Therefore, a key question in understanding the properties of AGN outflows is the relative importance of radiation force compared to the force from a radio jet or wind. In this paper, we present a detailed analysis of the kinematics and ionisation of a nuclear outflow in the bright local Seyfert NGC 2110 and, using geometrical and dynamical constraints, explore and compare the accelerative capability of nuclear radiation and ram/synchrotron pressure from the jet in this galaxy.
We adopt a systemic velocity of km s-1 for NGC 2110 based on stellar absorption line measurements (Nelson & Whittle, 1995). With H km s-1 Mpc-1, this gives a distance/physical scale for the galaxy of Mpc/ pc arcsec-1.
2 The NLR of NGC 2110: Context and Previous Studies

NGC 2110 is a nearby S0 galaxy (de Vaucouleurs et al., 1991) with a Seyfert 2 AGN (McClintock et al., 1979). Initially discovered as a strong X-ray source (Bradt et al., 1978), further spectroscopic and radio observations (McClintock et al., 1979; Shuder, 1980; Ulvestad & Wilson, 1983) revealed an extended emission line region and radio jet, as well as broadened lines with FWHM up to km s-1 in the vicinity of the nucleus, suggesting a localised jet-ISM interaction.
Compared to other Seyferts, NGC 2110 has a remarkably well-defined and symmetric radio jet, with a projected extent of ( pc). The inner jet is approximately linear on both sides of the nucleus with a north-south (PA ) axis, but bends smoothly by about at a projected distance of , ending in large bright lobe-like structures. High-resolution VLBA imaging shows a parsec-scale feature aligned with the extended inner jet (Mundell et al., 2000).
Optical continuum images show a dusty circum-nuclear gas disk with a well-defined spiral pattern (González Delgado et al., 2002, also see panel 5 in Fig. 3 of this paper). Such disks are quite common in Seyfert galaxies (Regan & Mulchaey, 1999; Pogge & Martini, 2002) and their spiral arms are postulated to be shocks which trigger gas inflow into the active nucleus. As we discuss later, the presence of a circumnuclear gas disk may have important consequences for the morphology of the jet and the extended ionised gas.
Early ground-based studies of emission line kinematics in NGC 2110 (Wilson & Baldwin, 1985; Wilson et al., 1985) found evidence for rotation with the peculiar property that the kinematic centre was offset to the south of the continuum peak by . This apparent paradox has been clarified by more recent observations. Ground-based integral-field spectroscopy across the central (González Delgado et al., 2002; Ferruit et al., 2004)) has shown that the stellar velocity field is rotationally symmetric about the optical continuum peak (the true nucleus). The gas kinematics, however, is confirmed to be asymmetric, though the origin of this asymmetry is still unclear. Ferruit et al. (2004) argue that the gas in the northern ELR is disturbed by the jet outflow, suppressing and lowering its average rotational velocity.
Our study concentrates on the central (300 pc) and uses high spatial and spectral resolution data to probe the properties of the inner NLR which, as we show in §4, is most influenced by the outflow. In §7.5, we discuss our results in the context of the gas flows on kpc-scales.
3 Datasets: Reductions and Measurements
| Grating | G430M | ||
| range (Å) : | 48185104 | ||
| Aperture | (Å pix-1) : | 0.277 | |
| cz (km s-1 pix-1) : | 17 (@ ) | ||
| NGC 2110 A | Ap= | Dataset : | O5G401010 |
| PA=-36.202∘ | Date : | 24/12/2000 | |
| Offset=, | Exposure time : | 1522 | |
| NGC 2110 B | Ap= | Dataset : | O5G401020 |
| PA=-36.202∘ | Date : | 24/12/2000 | |
| Offset=, | Exposure time : | 600 |
3.1 STIS spectroscopy
Two high S/N STIS long-slit spectra were taken at nuclear and off-nuclear positions in order to cover as much of the central emission line region as possible. We used the G430M grating to the [OIII] doublet and H at a velocity resolution of FWHM km s-1. See Table 1 for details. The [OIII] line tracks the kinematic properties of the emission line gas, while the [OIII]/H ratio is sensitive to its ionisation state, relatively free of reddening. Henceforth, we will use the labels Slit A and Slit B for the nuclear and off-nuclear slit respectively.
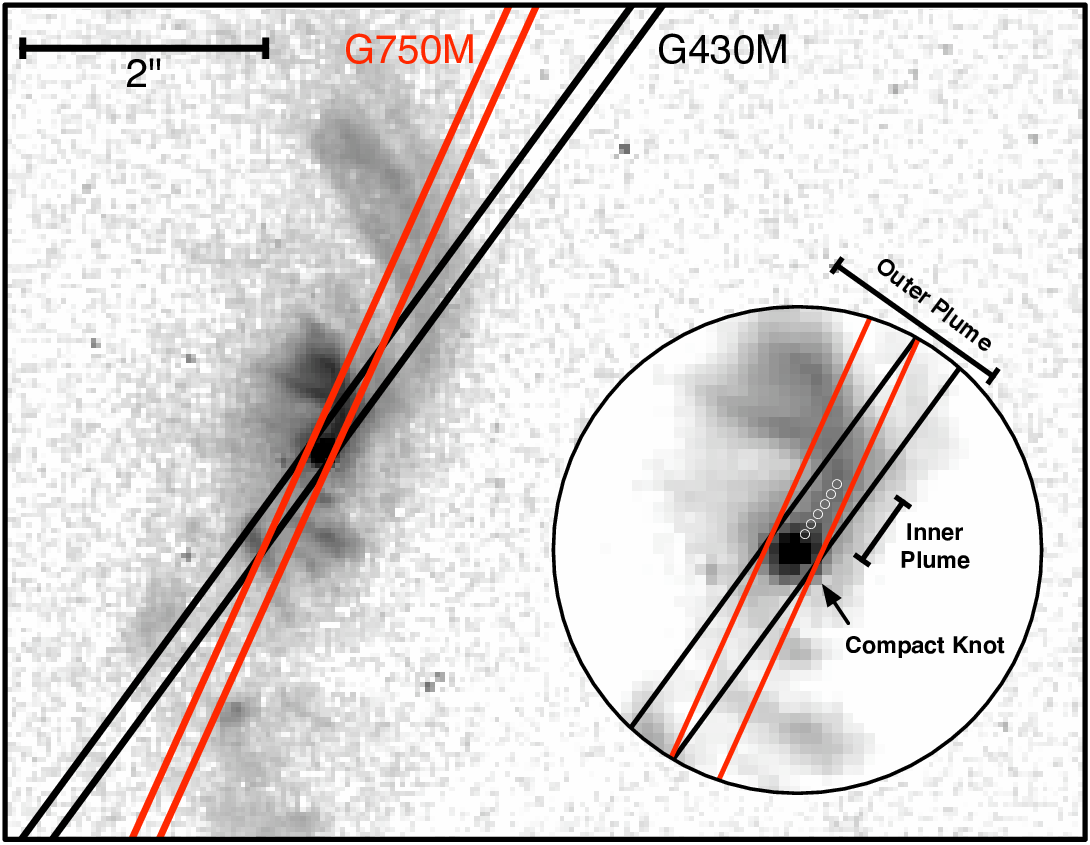
We also use an archival STIS G750M (red) spectrum, first presented in Ferruit et al. (2004), which covers the lines of [OI], H, [NII] and [SII]. Like our nuclear G430M spectrum, the slit was centred on the continuum peak of the galaxy, though along a PA of . Fig. 2 compares the nuclear slit positions of the G430M and G750M datasets. The angular difference of between the slits ensures sufficient overlap of the apertures across the central one arcsecond of the NLR to allow a direct comparison of line measurements from the red and green spectra in the inner NLR.
For all the STIS data, spectrophotometric calibration was done using the CALSTIS pipeline and any remaining hot pixels were cleaned using the IRAF ‘COSMICRAYS’ task.
Emission line properties were measured from one-dimensional extractions of the two-dimensional STIS spectrum. The extraction widths were from one to several spatial increments and were designed to maximise the S/N in the emission lines, while isolating regions with coherent kinematic behaviour. For each 1-D spectrum, we fitted a smooth polynomial to the underlying continuum subtracted it to obtain a pure emission line spectrum. The emission line strengths were not corrected for any underlying absorption, which is negligible given the very high equivalent widths of the lines in the spectra ( across the entire NLR).
We measured line kinematics from the [OIII] line in the G430M spectra, while emission line ratios were estimated using the [OIII] line as a scalable template. Our complete methodology is essentially the same as that applied to a similar dataset for Mkn 78 (Whittle et al., 2005) and we refer the reader to this paper for further details.
3.2 HST and Radio Images
Two emission line maps of NGC 2110 were prepared from archival HST imaging datasets. The first is a map of the [OIII]+H lines constructed from WF/PC-1 narrow/medium-band images (Program: GO 3724, PI: Wilson). The details of the instrument configurations, image reduction and analysis are described in Mulchaey et al. (1994). In brief, following basic calibration with the WFPC Pipeline, both sets of images were deconvolved with a model TINY TIM PSF using a Lucy-Richardson algorithm to remove the effects of the spherical aberration of HST. Nearby medium-band continuum images, also appropriately deconvolved, were then subtracted to get the final pure emission line images. The plate scale of the images is mas/pixel.
A second emission line map, in H[NII], was constructed from archival HST images in the FR680P15 linear ramp filter (‘on-band’) and F791W filter (‘off-band’) taken on the WFPC2 PC1 camera. Calibration and reduction details can be found in Ferruit et al. (2004). This map has significantly better S/N than the WF/PC-1 map and reveals faint extended features in the Extended Emission Line Region (EELR). In addition, the F791W (approx. I-band) image provides an emission-line free view of the dust and stellar continuum geometry around the nucleus.
For brevity, we will refer to the [OIII]+H map simply as the ‘[O III]’ map in the rest of this paper. Similarly, the H[NII] map will be shortened to the ‘H’ map.
A VLA X-band radio map of NGC 2110 at 8.4 GHz (3.6 cm), first presented in Nagar et al. (1999), was kindly re-reduced for our purposes by N. Nagar. The maps were constructed with uniform weighting and self-calibrated with a robustness parameter of 2, giving the best compromise between spatial resolution and S/N.
3.3 Registration and Astrometry
Accurate spatial registration of the images, radio maps and STIS slit positions is essential for this study. The high spatial resolution of HST warrants absolute positional accuracies on the scale of tens of milliarcseconds. This cannot be achieved from the HST astrometric header information alone, since typical absolute astrometric uncertainties in the HST focal plane are . Instead, we employ a number of techniques to register the various datasets to each other and then anchor them all to the astrometric frame of the radio maps, which is accurate to mas.
Each STIS spectroscopic observing sequence starts with an acquisition image, which, for our purposes, was taken through the F28X50LP (long-pass) filter. The relative registration between the slit position and the peak-up centroid of the acquisition image is better than 5 mas or 0.1 STIS pixels. The S/N of these images is sufficient for them to be cross-correlated with the WFPC2 F791W images, allowing us to match the STIS and H datasets together.
We assumed that the nuclear position corresponds to the peak of the optical emission in the STIS acquisition images. We independently verified this assumption by fitting a gaussian to the spatial profile of the stellar continuum in our spectra. In all cases, the peak of the continuum profile matched the center of the reference pixel along the cross-dispersion axis of the STIS spectra, as expected for a slit over the peak-up centroid during the target acquisition stage of the STIS observations.
To tie the STIS spectra to the WF/PC-1 images, we developed a routine that extracted, for each STIS slit, a model slit from the [OIII] image and optimised its position and PA to match its flux profile to a gaussian-smoothed version of the [OIII] flux profile from the STIS spectra. The optimisation was performed by minimising the difference between the extracted and real profiles, using a robust Downhill Simplex algorithm. With a careful choice of initial parameters to prevent the routine from settling into local minima, we achieved a relative registration of the imaging and spectroscopic datasets to better than 10 mas.
In order to tie the HST datasets to the radio astrometric frame, we registered the centroid of the acquisition image to the co-ordinates of the nuclear point source in the corresponding radio map, available from the literature. This approach is justified by the result from Ferruit et al. (2004) that the kinematic center of the stellar velocity field is the peak in the optical light distribution.
4 Heuristic Description

4.1 Emission Line and Radio Morphology
The main datasets of NGC 2110 are plotted together in Fig. 3. Here, we describe the principal features visible in the data and discuss the relationships between various identifiable components. In what follows, we use the term ‘NLR’ to describe the entire emission line region, while the term EELR refers only to the outer NLR, beyond a projected nuclear radius of (150 pc) and out to its largest extent of about 4” (600 pc) from the nucleus.
The STIS spectra are sensitive enough to clearly detect the [O III] line within a nuclear radius of . Earlier studies have found that the kinematics of the [O III]-emitting gas within the inner of the NLR are quite disturbed and turbulent, while the motion on larger scales is basically dominated by the gravitational potential of the galaxy (González Delgado et al., 2002; Ferruit et al., 2004). Therefore, probing these very central regions in detail gives us the best insight into the nuclear outflow.
Within , both the H morphology (Panel 1 in Fig. 3) and [O III] morphology (Panel 2 in Fig. 3) share some common features. The line-emitting gas in both images forms NNW a linear structure which curves over in the same direction as the radio jet and the dust lanes of the circumnuclear disk (see below). The H image also contains a great deal of extended emission which is not seen in the [O III] image. This is primarily due to the lower S/N of the [OIII] image, though some of the difference is a result of the strong extinction towards the inner NLR south of the nucleus from dust in the circumnuclear disk. Ferruit et al. (2004) show that the high ionisation state of this extended gas is indicative of AGN ionisation and not distributed star formation in the disk.
We turn now to the curved structure discussed above. Previous studies have referred to this as an emission-line “jet”, paralleling the structure of the radio jet. The STIS spectra of this feature show very strong blue-shifts and complex velocity structure, which supports the notion that it is interacting with, or originating in, the jet. However, the inner emission line “jet” has a position angle that is offset by from the PA of the main radio jet. In fact, given that the radio jet preserves its N-S direction down to parsec scales (Mundell et al., 2000), the emission line feature probably skirts the main radio jet, rather than being fully cospatial with it. At this juncture, we choose not to assume that the emission line material is accelerated by the radio jet. As we discuss in §8, other mechanisms may also be playing an important role.
To avoid confusion with the radio jet flow, we will henceforth refer to this inner emission line structure as a “plume” rather than a “jet”. For descriptive purposes, we further consider the plume to have two sections: an inner and outer plume. The inner plume is the linear high surface brightness structure that extends from the nucleus. The outer plume continues from the inner plume and curves to the NE. The motivation for separating the inner from the outer plume is based on their differing kinematics (§4.1).
In order to understand the relationship between the radio and line-emitting components, it is important to ascertain the role played by dust in modifying the appearance of the emission line region. At first sight, there is a marked north-south asymmetry in the emission line distribution with significantly more emission to the north. However, Fig. 3, dust lanes are apparent in the red continuum image just south of the nucleus and suggest extinction may play a role in creating this asymmetry. To constrain the level of extinction, we measure the Balmer decrement south of the nucleus. Despite the misalignment between the G430M and G750M slits, there is sufficient overlap within of the nucleus to allow a reliable estimate of Balmer decrement. Across this region, we measure , with large uncertainty due to the faintness of line emission in this region. Assuming a Case B value of 3.1, typical of AGN emission line regions, we estimate a V band extinction of A magnitudes, assuming the dust is distributed as a uniform screen. Using this AV to correct the faint [O III] emission south of the nucleus yields a surface brightness comparable to the northern plume, suggesting that the north and south inner NLR have intrinsically similar surface brightness. In reality, both the radio and emission line regions may have a north-south symmetry.
Beyond the bright plume [nuclear radii 1” (150 pc)], the H map shows curving arcs of ionised gas to the north and south, which are, for the most part, associated with dusty spiral arms visible in the continuum images. This EELR is significantly extended along PA , close to that of the disk major axis (and the line of nodes, assuming a circular disk). The kinematics of this extended emission is primarily rotational (Ferruit et al., 2004). Therefore, this larger-scale ionised material is probably disk gas illuminated by the radiation field of the central AGN, with dust and higher gas concentrations in the spiral arms modulating the appearance of the extended line emission. While the width of the structure is slightly narrower at the nucleus than at its outer extremes, its geometry does not obviously resemble a canonical double-sided ionisation cone found in many bright Seyfert 2s (Falcke, Wilson & Simpson, 1998). This is not necessarily unusual, since the illumination pattern of Seyfert nuclei are not always very clear. In §6, we propose a simple model which unifies the geometry of the EELR and the radio jet, and reconciles the illumination pattern with a bi-cone.
4.2 Emission Line Kinematics

In Fig. 4, we plot peak velocity with respect to systemic (Panel 1) and FWHM (Panel 2) measured from the [O III] line, as a function of nuclear distance along both slits. When comparing these measurements to the panels of Fig. 3, clear relationships can be seen between the kinematics of the line-emitting gas and its spatial structure. A compact knot of gas surrounds the nucleus in both [O III] and H maps, resolved with HST, but only marginally resolved by the STIS spectrograph due to the slitwidth. This emission line knot displays extremely broad lines (FWHM of km s-1), a median blueshift of km s-1 and a predominantly blue wing. In addition, in spatial increments south of the nucleus, a substantial red wing to the [O III] profile becomes evident. This is consistent with an unresolved bipolar nuclear outflow with a dust-extincted red component, smeared out by the instrumental PSF.
What might be the origin of the very broad central component? Moran et al. (2007) estimate a central supermassive black hole mass in NGC 2110 of M M⊙ from its central velocity dispersion of km s-1 (Nelson & Whittle, 1995), using the relationship from Tremaine et al. (2002). The radius of gravitational influence for a black hole of this mass given by:
| (1) |
which is 18 pc, or 2.4 STIS spatial increments. While approximate and dependent on the shape of the potential, this estimate of closely matches the size of the nuclear compact knot. It is quite possible that some of the high velocities measured in this knot can be attributed to gas within a few parsecs of the black hole. On the other hand, there appears to be a continuity in the bulk velocity of the gas across the transition between the compact knot and the rest of the inner plume, implying that the plume is the resolved extension of the same bipolar outflow that extends down into the knot. Also, as discussed in §5.3, the ionisation properties of the knot are similar to that of the inner plume. Therefore, the knot probably contains gas in rotation around the black hole as well as an outflowing component. We discuss the outflow and its accelerating mechanism in §7.
Beyond the core, the blueshifted gas extends along the entire length of the inner plume, decelerating with nuclear distance. The FWHM of the gas drops from about km s-1within to systemic at the end of the plume where the bulk blue shift drops to zero. Past the end of the inner plume, the linewidths rapidly become narrow and the gas returns to a quiescent state, consistent with almost normal rotation in the circumnuclear disk. This velocity pattern suggests that the inner plume is a site of strongly outflowing gas. Note that the inner plume lies well outside the sphere of the influence of the black hole, so its rapid deceleration should not be interpreted as a Keplerian drop-off.
What about the outer plume? Does it inherit the disturbed motion of the inner plume? Slit B samples the outer plume as it intersects the central axis of the radio jet. This is, in fact, the only part of the plume structure that appears, in projection, entirely within the confines of the radio jet. Surprisingly, the ionised material here has narrow linewidths and appears to be quiescent and rotational, similar to the gas beyond the plume in Slit A. In contrast to the inner plume, the outer plume is likely to be an AGN-illuminated nuclear spiral arm, lying either in front or behind the jet. The continuum image (Panel 5 in Fig. 3) supports this idea: unlike the inner plume, the outer plume is associated with a similarly shaped dust feature. As we discuss in §6, an investigation into the relative geometry of the NLR and the radio jet provides further evidence that the jet is viewed in projection against the outer plume.
Our preliminary analysis of the interaction indicates that the inner plume is highly disturbed and directly accelerated by the nuclear outflow. In the next section, we consider the physical nature and excitation of the ionised gas in the nuclear knot and the inner plume.
5 Ionisation Conditions

5.1 Ionisation models
A knowledge of the ionisation conditions of the emission line gas helps to set the stage for a study of the energetics of the inner NLR. The radiation field of the central AGN is often a major source of thermal and kinetic energy, through photoionisation heating and radiation pressure. In addition, strong shocks, driven into the NLR clouds by interactions with the radio jet or outflow, can also be a significant source of ionising photons (Viegas-Aldrovandi & Gruenwald, 1988; Dopita & Sutherland, 1996; Allen et al., 2008) and, under certain conditions, this can dominate over nuclear photoionisation. Since shocks are sinks of the jet kinetic energy flux, constraints from shock ionisation can be used to determine jet energies. In addition, variations in ionisation state can arise from changes in gas density and Lyman continuum optical depth. A comparison of line strengths with the predictions of models can throw light on the micro-scale nature of NLR gas, which then feeds into a dynamical analysis and estimates of jet properties.
We employ two grids of ionisation models applicable to AGN emission line regions. The first considers the photoionisation of dusty, optically-thick gas by the EUV and X-ray continuum of the nuclear source. These models were presented in Groves et al. (2004) and span a range in NLR metallicity, mean ionisation parameter , gas density and ionising continuum slope. We call these the models. The second set of models are those of autoionising radiative shocks, i.e, shocks that ionise an optically thin precursor region of unshocked gas, as presented and discussed in Allen et al. (2008). These models extend the work of Dopita & Sutherland (1996), spanning a greater range of shock velocity, gas density, gas metallicity and magnetic compression parameter. Our approach is to compare measured line ratios with the predictions of both of these models, in terms of their location on line ratio-ratio diagrams and, since we have spatially resolved the inner NLR, trends in the measurements. A comparison of several different diagrams can allow an assessment of the importance of these two very different ionisation mechanisms.
| Nuc. Dist. | All fluxes are in units of erg s-1 cm-2 arcsec-2 | |||||
|---|---|---|---|---|---|---|
| (arcsec) | H | [O III] | [O I] | H | [N II] | [S II] |
| 0.08 | ||||||
| 0.13 | ||||||
| 0.18 | ||||||
| 0.23 | ||||||
| 0.28 | ||||||
| 0.33 | ||||||
5.2 Line ratio-ratio diagrams
Fig. 5 plots combinations of optical emission line ratios measured for the inner plume. It is worth recalling that these diagrams compare line ratios from two different STIS datasets, though any given ratio is constructed from lines measured in a single dataset (G430M or G750M). The misaligned slits (angular offset of about ) sample slightly different parts of the inner plume, from almost full overlap at the nucleus, to approximately 25% overlap at the edge of the plume (Fig. 2). Our approach will be valid as long as there are no strong ionisation gradient perpendicular to the plume, which seems very unlikely.
Line ratios, calculated from the flux measurements in Table 2, are plotted in Fig. 5 as filled circles with error bars. In what follows, we exclude the set of STIS spatial increments on or immediately adjacent to the nucleus to avoid complications from the smearing of the nuclear point source due to the width of the slit. The approximate central locations of these increments are plotted in Fig. 2. As a guide to the reader, the data points with lowest [OIII]/H are the closest to the nucleus.
We have compared the full space of parameters from both and shock models against many combinations of line ratios. Fig. 5 is a distillation of a set of 4 line ratio diagrams and a small subset of model tracks that bring out our main results. Plotted using dashed lines, the representative models feature a power-law ionising spectrum in frequency, with a spectral index of (typical of Seyferts), illuminating gas clouds with an electron density of cm-3, with tracks in ionisation parameter spanning and metallicities of twice and four times solar. Representative pure shock and shock+precursor models are plotted as solid lines, with pre-shock densities of 1 cm-3 and shock velocities between 400 and 1000 km s-1 as well as high magnetic fields 10 mG (highly magnetised shocks). We find that in order to match the strengths of the [S II] and [N II] lines, we require super solar abundances in both model sets. These models were chosen to span the measured line ratios, while fixing parameters that have a minor influence on the position of the model tracks on these diagrams. We refer the reader to the original papers for a full description of the parameter space covered by the models.
A examination of the line ratio-ratio diagrams yields the following conclusions:
a.) A gradient in the ionisation sensitive line ratio [O III]/H is observed, towards lower ionisation at smaller radii. The low ionisation ratios of [N II] and [S II] with H show no trend and indeed, the entire plume occupies a very small region of the diagram that involves combinations of these three lines (Fig. 5b). The [O I]/H line ratio exhibits an anti-correlation with [O III]/H, which, interestingly, is not mirrored by any of the model tracks.
b.) Considering the shock models, the low ionisation points prefer pure shocks with shock velocities around 700 km s-1 while the high ionisation points match shock+precursor models with higher velocities. The tracks for unmagnetised shocks do not span the range of line ratios as well - weakly magnetic pure shocks produce too weak [O III]/H, while weakly magnetic shock+precursor models produce low values of [S II], [N II] and [O I] relative to H. Note that the transition from having a significant precursor contribution near the nucleus to pure shocks at larger radii is required to match the trends in the measurements. Neither a full set of pure shock or shock+precursor models actually spans the gap between low and high ionisation points. Models with higher abundances, while not explicitly modeled by Allen et al. (2008), are unlikely to improve the match to the measurements, as they will move the [O III] strengths higher in the shock+precursor models and away from the measurements.
c) On the other hand, the dusty photoionisation models can consistently reproduce the measured ratios with and abundances about solar. There may be a preference for a harder ionising power-law than we have adopted, which will boost [S II] and [N II] relative to H, yielding a better fit in Fig. 5b. A harder ionising continuum will also lead to a better match to the [O I] strengths in Fig. 5d. However, Groves et al. (2004) do not consider power-law indices smaller than and modelling this scenario is beyond the scope of this paper. In the context of the photoionisation, the gradient in [O III]/H implies lower ionisation parameters at smaller nuclear distances. Since the ionising field is expected to decrease with distance, due to geometric dilution and increasing net optical depth, the gradient implies that the density of the ionised gas increases sharply towards the nucleus.
For a galaxy with the luminosity of NGC 2110 (M), local metallicity scaling relationships (Salzer et al., 2005, e.g.,) predict oxygen abundances around solar. The inner kpc of NGC 2110 appears to have significantly higher metalllicities than the mean galaxy population, though an excess of 0.5 dex is not much larger than 1 scatter in abundance for galaxies of this luminosity.
d) Unlike the other ratios, [O I]/H is not fully consistent with the best parameters for the sequences (Fig. 5d). Shocks give a somewhat better match, though, as before, the gradient supports a switch from pure shocks to shock+precursor emission over the length of the plume. However, [O I] is a very difficult line to model because its relative strength is influenced considerably by the high energy (soft X-ray) contribution to the ionising spectrum, which produce the partially ionised zones needed to excite neutral oxygen significantly. NGC 2110 has an extended soft X-ray excess compared to normal Seyferts (Weaver et al., 1995; Evans et al., 2006) and this may explain why [O I] is stronger than predicted by the photoionisation models.
5.3 Global Constraints
A simple check on the feasibility of nuclear photoionisation can be made by comparing the mid/far IR luminosity of the galaxy with the ionising luminosity necessary to power the observed line emission. Seyferts are known to be powerful IR sources with particularly warm colours (Rieke, 1978; Pérez-García & Rodríguez-Espinosa, 2001). Most of the IR emission is believed to come from the AGN’s optical–UV–X-ray output that is intercepted and reprocessed by warm dust near the nucleus and in the torus. Since NGC 2110 does not show any signs of strong star formation, either circumnuclear or in the large-scale galaxy disk, its IR luminosity (m) should be dominated by the output of the AGN. Using the calibrations of Sanders & Mirabel (1996):
| (2) |
where , , and , all in Jy, are the fluxes of NGC 2110 in the four IRAS bands and cm is the distance to the galaxy. This gives us erg s-1. Assuming that most of the AGN’s radiation comes out at UV to X-ray wavelengths and is reprocessed, its bolometric luminosity . This estimate is consistent with results from spectral fitting of the nuclear X-ray emission, appropriately scaled using a bolometric correction (Evans et al., 2006; Moran et al., 2007).
One can estimate the total ionising luminosity using the total H flux of the Seyfert. Assuming a power-law AGN spectrum of the form (), a dust absorption cut-off at and a covering factor for the ionised gas:
| (3) | |||||
where and are the H and total case B recombination coefficients for hydrogen at K, and is the average energy of an H photon.
is the fraction of steradians intercepted by line emitting gas. In §7, we calculate the intrinsic cloud covering factor . Taking the ionising cone half-angle to be (based on estimates in ), we calculate . With canonical values of , and using our estimates of and , erg s-1. Despite the uncertainties in this approach, this estimate compares very well with the total extinction-corrected H luminosity of erg s-1 from Wilson et al. (1985) based on early ground-based long-slit work.
The relative importance of shock ionisation can be tested in a similar fashion. The Extended Emission-Line Region (EELR: nuclear radii ) is undoubtedly ionised by the central AGN, since the undisturbed gas kinematics on these scales cannot sustain the fast shock velocities ( 500 km s-1) needed to produce its high level of excitation.
We concentrate instead on the disturbed inner plume. We can compare the ionising flux experienced by gas in the plume both from shocks and the central source. We can estimate the amount of ionising UV radiation generated per unit shock area, using the following relation from Dopita & Sutherland (1996):
| (4) |
where is the shock velocity in units of km s-1 and is the preshock density in cm-3. For km s-1 and , erg cm-2 s-1.
Taking the photon luminosity of the AGN and a characteristic distance of the inner plume ( pc), we can estimate an ionising photon flux per unit area from the nuclear source at the plume of erg cm-2 s-1, almost 3 orders of magnitude higher than the UV flux from shocks. This suggest that the ionisation of the inner plume is dominated by the photon output of the nucleus. Taken together with the dominance of nuclear photoionisation in the EELR, we conclude that shock ionisation contributes very little to the line emission in NGC 2110.
5.4 Line Profiles
A different handle on the nature of the ionisation comes from a comparison of line profiles in the emission line plume. In Fig. 6 we plot the normalised profiles of [O III] and H integrated over the inner plume, the nuclear knot and the region of weak emission south-east of the nucleus along Slit A. A measure of the ionisation level as a function of velocity is revealed by the relative strengths of [O III] to H across the profiles.
In all three regions, the [O III] line is wider than H. In the nuclear knot and inner plume, this difference in linewidth takes the form of a stronger, more highly ionised blue wing on [O III]. This blue wing in the nuclear knot forms the base of the decelerating inner plume emission and displays a similar line ratio ([O III]/H), implying a continuity between these regions. The line core, with absolute velocities km s-1 around systemic, exhibits a low LINER-like ratio ([O III]/H). In contrast to the inner plume, the red half of the [O III] line in the south-east region may be stronger than H though the low S/N in this region precludes a definite measurement. This suggests that a highly extincted plume-like structure also exists in the inner south-east NLR, consistent with the results of §4.1.
Based on these trends, the following picture presents itself: the low velocity line core is emitted by ionised gas that is relatively undisturbed and might lie in the plane of the circumnuclear disk. The outflow, in contrast, is highly ionised and possibly mass loaded from material accelerated off the low ionisation clouds in the disk. This enhancement of ionisation could be due to a greater fraction of low density, optically thin gas in the outflow. As it expands away from the nucleus, the outflow decelerates rapidly and finally merges with the rest of the disk, losing its distinct identity and kinematics.
To conclude, the line-ratio analysis and the agreement between the line and reprocessed ionising luminosities of the AGN lends some support for widespread nuclear photoionisation. In addition, the presence of strong trends in ionisation across line profiles in the innermost plume allow us to differentiate between an undisturbed, LINER-like disk component photoionised by the AGN, and a more highly ionised outflow component.
6 Description of the Interaction

A geometric and kinematic model for the NLR is necessary for a dynamical analysis of the interaction. To this end, we first introduce various structural components of the NLR and then discuss how they relate to each other.
Based on elliptical isophote fits to the F791W continuum image, González Delgado et al. (2002) estimate a circumnuclear disk inclination of approximately , with the line of nodes aligned along PA . The contrast of the dust lanes indicates that the western side of the disk is inclined towards the line of sight. Combining this information with the direction of rotation of the ionised gas in our spectra (blueshifted to the north and redshifted to the south), we deduce that the spiral arms trail the disk rotation in the normal fashion of large scale galaxy spirals.
From Fig. 3, a comparison of the H map (Panel 1) and the radio map (contours in Panel 2) shows that the major axis of the ionised gas distribution is inclined to the axis of the radio jet by about . At face value, this implies a misalignment between the radio jet ejection axis and the normal to the plane of the putative central molecular torus, which defines the orientation of the ionisation cones. While this can be explained by models with accretion disk precession or warps, we propose the following geometric model to account for the misalignment (see Fig. 7). We begin by assuming that the inner jet is in fact aligned with the axis of an illumination cone. The cone axis is inclined from the normal to the circumnuclear gas disk by an angle . In the assumption that almost all the circumnuclear gas in confined to the disk and that the disk scale-height is small (a thin disk), the emission line distribution is determined by the ionised gas in the disk, which takes the form of a planar section through the illumination cone (a conic, though only approximately, given the inhomogeneity and patchy dust obscuration within the disk). The axis of the EELR is then the projection of the illumination cone axis (i.e., the inner radio jet axis) onto the circumnuclear disk, with the direction of projection along the normal to the disk plane.
We define two mutually rotated reference frames: a) a ‘disk frame’ with the circumnuclear disk in the XY plane and the normal to the disk along the Z-axis, and b) a ‘sky frame’, with the sky in the X’Y’ plane and the line of sight to the nucleus along the Z’-axis. We choose the X and X’ axes to lie along the line of nodes of the disk, making it the common axis of rotation between the two frames. We denote the rotation angle (anti-clockwise looking towards the origin) to be . This angle is the inclination angle of the disk . The jet axis is taken to be a radial vector with an angle from the Z-axis of () and from the line of nodes of () in the disk (sky) frames. Basic rotational transformations between spherical co-ordinate frames gives us relationships between these angles:
| (5) | |||||
| (6) |
Since the axis of the EELR (i.e., the projection of the jet axis onto the XY plane in the disk frame) is essentially aligned with the line of nodes, then (see §4.1). Taking (the inclination of the circumnuclear disk) and (the angle between the radio jet axis and the line of nodes in the sky frame, which is equal to the PA of the line of nodes, since the jet is aligned north-south), we can solve for using Eqns. 5 and 6:
| (7) |
which gives . In other words, the jet axis is inclined to the plane of the disk by Using Eqn. 6, we calculate the angle between the jet axis and line-of-sight .
In the limit of a very thin disk and a well-defined illumination cone, the opening angle of the cone can be estimated from the apparent opening angle of the ionised section of the disk. Taking this to be between to , simple geometric arguments give cone opening angles of around to , typical of Seyfert ionisation cones.
Finally, an estimate can be made of the thickness of the disk. If we assume that the kinematically disturbed inner plume coincides with the projected length of the outflow as it interacts with the disk, then the disk thickness is given by:
| (8) |
with ( pc) and the values of and estimated above. This number is quite plausible, though some caveats must be noted. Real disks are not sharply edged but likely to have an exponential vertical gradient in gas density, while the gas distribution in the disk will be highly clumpy and non-uniform. Both these effects would lead us to underestimate the disk thickness. Another important consideration is that the outflow could disrupt the orderly structure of the cold disk gas.

The nature of the circumnuclear disk has also implications for the radio source morphology as well. Ulvestad & Wilson (1983) consider possible causes for the symmetric bending of the jet in NGC 2110: a) ram pressure forces from the rotating ISM, b) static pressure gradients in the bulge and, c) precession of the jet axis. It is possible to rule out ISM ram pressure as the main cause of the jet bend, since the inferred direction of the disk rotation is opposite to that required to bend the jet to its current shape, except for the unlikely case where the tangent plane to the jet beam sweeps across the LOS plane over the extent of the jet (Fiedler & Henriksen, 1984). While precession cannot be excluded, it seems unlikely given the constant jet alignment down to parsec scales (Mundell et al., 2000). Given the strong gradient in gas density perpendicular to the circumnuclear disk and the fact that the jet bends towards the minor axis of the disk, we propose that the jet bends as a result of refraction in the vertical pressure gradient of the disk.
With this configuration for the jet and the disk, the inner emission line plume marks the location of higher density outflowing gas confined to the disk, ionised mostly by UV radiation from the AGN. We find little evidence for gas entrained into the jet itself: for most of its extent, the jet and its terminal lobes are free of associated high velocity emission line material. This may be compared to the view of the jet interaction in Mkn 78 (Whittle & Wilson, 2004), where large amounts of line-emitting gas are embedded and carried along by the jet flow. With this simple model, we now explore the general energetics of the NLR and radio jet from a dynamical standpoint.
7 Dynamical Study
NGC 2110 hosts a significant radio jet and a relatively luminous AGN, both of which can drive a fast moving outflow, either through the action of relativistic pressure, ram pressure or the momentum imparted by nuclear radiation, i.e, radiation pressure. In this section, we estimate the capacity of each of these mechanisms to provide the total energy and momentum of the ionised outflow, in order to gauge their importance.
7.1 Emission Line Region Properties
If the gas is primarily photoionised (§5), the masses, momenta and energies of the inner plume can be derived from basic nebular photoionisation theory (Osterbrock, 1989). The total flux in H measured from the STIS spectra and corrected for an extinction of magnitudes is erg cm-2 s-1. From this, the mass in emission line gas can be estimated using the following relation:
| (9) |
giving solar masses, where we have adopted a hydrogen number density of cm-3, derived from the ratio of the [S II] doublet (Ferruit et al., 1999). Approximating the plume as a cuboid of volume V arcsec3 (or pc3), we can estimate the filling factor of ionised clouds:
| (10) |
to be , a typical value for NLR clouds. Combining with an estimate for the column density of the NLR clouds cm-2 from X-ray absorption models (Ferruit et al., 1999), we derive typical covering factors of ionised gas in the NLR:
| (11) |
In addition, a simple estimate can be made of the age of the interaction from the approximate time taken by the emission line gas to cross the region of the plume. With a characteristic velocity km s-1, we get a timescale years. This age estimate is essentially an upper limit if the gas in the plume is decelerating with distance from the nucleus - a plausible interpretation of the bulk velocity profile of the plume.
Combining with the kinematics of the [O III] line and accounting for a projection angle to the line of sight of , the total (translational and internal) emission line kinetic energy is erg and a bulk momentum is dyne-s. may be compared to the equipartition energy in the radio source (Ulvestad & Wilson, 1983, erg,) or the integrated energy from nuclear UV radiation over the lifetime of the interaction ( erg). Energetically, both the jet and nuclear radiation are capable of supplying the energy of the outflow, with the nuclear radiation field dominating, by far, the energy budget of the system.
Assuming that the relativistic particles and magnetic fields of the radio-emitting plasma are in equipartition, various physical parameters of the radio jet can be estimated using relations from Miley (1980) and radio measurements from Ulvestad & Wilson (1983). Radio source pressures are modest, with dyne cm-2. These may be compared to the pressures of the emission line gas and the extended hot gas in the NLR responsible for the soft X-ray emission. Using and a temperature K from the [O III] ratio (Ferruit et al., 1999), we determine the ionised gas pressure to be dyne cm-2. Evans et al. (2006) estimate the X-ray emitting gas to be at a pressure of log Both the emission line gas and hot gas appear to be slightly over-pressured with respect to the radio jet plasma, but, given the uncertainties of a few associated with such calculations, this is basically in agreement with the conclusion of Ulvestad & Wilson (1983) that the phases are in rough pressure balance. Note that there is no good evidence that equipartition is a valid condition in such weak Seyfert jets. Studies of FRI jets in radio galaxies suggest that they are particle-dominated, probably due to entrainment of a heavy thermal ions, and quite out of equipartition (McNamara & Nulsen, 2007, see the review by). It is unclear whether this scenario will also apply to small Seyfert jets in gas-rich circumnuclear environments. However, given the similarity of the pressures across phases in NGC 2110, we assume that equipartition is probably valid and proceed accordingly.
7.2 Possible Acceleration Mechanisms
Over the lifetime of the outflow, the forces that accelerate the outflow have to be able to supply the bulk momentum measured in the inner plume. The momentum supplied to the gas per unit time, the momentum flux , must be matched by any relevant accelerating mechanism. From the estimates above, dyne.
A.) Relativistic Pressure
Is the radio source pressure capable of providing the momentum of the emission line gas? We envision the jet pressure acting on a sheath of ionised gas in contact with the jet surface and accelerating the gas outward from the surface. The area of this sheath is approximately the surface area of a cylindrical beam of length and cross-sectional radius of the jet pc, measured from the radio map. The relativistic pressure acting over this area gives a momentum flux of , or dyne. Within the considerable uncertainties, and the relativistic pressure could, in principle, accelerate the emission line gas.
B.) Jet Ram Pressure
The ram pressure of the fast moving jet flow as it propagates from the nucleus will accelerate clouds that lie along its path. While the physics of interactions between a jet and ISM clouds involves complex hydrodynamic processes such as shocks, cloud-breakup and ablation, we take a broader view and ask simply whether a jet with a ram pressure can satisfy the constraints of , where is the jet density and is the jet velocity.
A constraint on these jet parameters comes from the morphology of the jet. We have argued that the most likely explanation for the symmetrical bend in the jet is the action of a disk pressure gradient. Modelling the disk as a slab with a scale height much smaller than the disk plane scale length, we can apply the following condition for significant jet deflection from Henriksen et al. (1981):
| (12) |
where is the disk pressure at the sonic point of the jet and is the polytropic equation of state of the jet material ( for a relativistic gas). Assuming that the line emitting gas is in rough pressure equilibrium with the hot atmosphere of the galaxy, i.e, , we get jet ram pressures of log dyne cm-2. This pressure acting over the area of cross-section of the jet gives a force of or log dyne. Interestingly, requiring the jet to bend in the disk pressure gradient also implies a jet velocity and density that can easily accelerate the outflow by ram pressure.
Taking a fiducial proton number density for the jet of cm-3, we get , which is highly sub-relativistic. In other words, the requirement of substantial buoyant force on the jet material in the galaxy’s atmosphere implies that the jet is either highly underdense or highly subrelativistic.
C.) Radiation Pressure
The emission line gas in the plume is also illuminated by a powerful ionising radiation field from the nucleus. The pressure from this radiation is potentially a major source of momentum to the ionised gas. We estimate its momentum flux from the photon luminosity of the nucleus and the covering factor of the inner plume :
| (13) |
which yields , a little lower than . Within our uncertainties, radiation pressure is also capable of driving the nuclear outflow. However, the ability of radiation pressure to impart momentum to the ionised gas depends on nuclear distance simply because at smaller distances the covering factor is greater.
7.3 The Mass Outflow Rate
The mass outflow rate in the jet is given by:
| (14) |
where we have adopted the value of from the jet bend analysis above.
The Eddington accretion rate for the SMBH in NGC 2110 is , assuming a radiative efficiency of 0.1, while the mass accretion rate for the estimated bolometric luminosity of the AGN () is . Interestingly, the mass accretion rate of the SMBH is close to (possibly even lower than) the mass outflow rate in the jet if we adopt our fiducial value for . As long as the constraint on is valid, this may suggest that the jet carries away a substantial fraction of the mass accreted onto the SMBH. However, it is also possible that the current AGN luminosity may have varied substantially over , since the time of the ejection of the jet, that the jet is highly underdense or modestly relativistic, or that the jet ram pressure estimate is too high. The large number of contributing factors makes the determination of the most likely cause for this discrepancy difficult to ascertain.
7.4 The Role of Gravity
If any of the acceleration mechanisms discussed above are to accelerate gas in an outflow, it must overcome the local gravitational force of the galaxy’s spheroid acting on the gas. The relative strengths of these two opposing forces can be estimated as follows. Consider a spherical optically thick cloud with radius , density , located a distance from the nucleus. The gravitational force on the cloud is:
| (15) |
where is the proton mass, is the spheroid mass within and is the circular velocity corresponding to .
The radiation force acting on this cloud is:
| (16) |
where is the nuclear luminosity and assuming that all nuclear radiation illuminating the cloud is absorbed. The ram pressure force is:
| (17) |
where we used the definition of from above.
The ratio of gravitational force to radiation force on the cloud is:
| (18) |
where we have used the cloud column density . Significant acceleration by radiation pressure can only occur if this ratio is . Taking estimates of and from above, and assuming a constant km s-1 (based on the H rotation curve from Ferruit et al. (2004) as well as our own measurements of the southern NLR’s [O III] velocities), this criterion implies a critical radius of pc beyond which radiation pressure cannot effectively accelerate the gas. The inner plume deprojected size of pc is much larger than this critical radius. This suggests that radiation pressure is not a significant acceleration mechanism for most of the resolved inner NLR.
The ratio of gravitational force to ram pressure force is:
| (19) |
This ratio is inversely proportional to nuclear distance. If is roughly constant over the length of the jet, the ratio drops linearly with , such that ram pressure begins to dominate over gravitational forces above a critical radius of about 20 pc. Unlike radiation pressure, ram pressure of the jet flow may be an important acceleration mechanism in the plume.
A treatment of relativistic pressure in the same fashion is difficult, since it depends critically on physics of the boundary between the relativistic plasma and the ionised gas. Undoubtedly, gravity will have an effect on the displacement of any gaseous component in contact with relativistic plasma, but we forgo a discussion of relativistic pressure effects, since the jet ram pressure is likely to dominate the acceleration of any gas that comes into contact with the jet flow.
7.5 Gas Motions in the EELR
Ferruit et al. (2004) argue that the asymmetry between the velocity profiles of the northern and southern EELR can be explained if the northern part is disturbed by the jet, while the south is in normal rotation in a thin disc. The low S/N of the line emission in our spectra on the scales of the EELR (nuclear radii ) does not allow a full exploration of this phenomenon. We can, however, confirm that an asymmetry does exist between the absolute peak velocity of the narrow emission in the NW and SE EELR along Slit A, measured at and beyond (see Fig. 4). We may speculate on possible causes for the asymmetry. In our model for the NLR, the jet escapes the disk where most of the observed emission line gas is confined and therefore, direct interaction with the jet is unlikely to be the main cause of the asymmetry. This is supported by the fact that the jet is quite symmetric in its structure, which belies the basic symmetry of the gas density gradients that bend the jet. In this light, we propose two alternative hypotheses.
A.) We have shown that radiation pressure probably cannot drive a strong outflow beyond few tens of parsecs. However, it may still be able to influence the gravitational motion of AGN ionised gas on scales of the EELR. There is a strong difference in the mean ionisation between the northern and southern EELR (Wilson & Baldwin, 1985; Ferruit et al., 2004), which implies a difference in the ionising field strength and possibly the contribution of radiation pressure. A detailed study of the conditions of the emission line gas and any ionisation-kinematic trends in the EELR may test this idea, but this is beyond the scope of this work.
B.) The northern EELR has a pronounced dusty spiral arm that has no obvious counterpart in the south. Such structures have been proposed as paths along which gas streams into the nucleus from the outer parts of the galaxy (Maciejewski, 2004; Fathi et al., 2006; Davies et al., 2009) due to spiral shocks. A comparison of the spiral pattern with the kinematic residuals left after accounting for normal disc rotation, such as that presented by González Delgado et al. (2002), may provide evidence for this model.
8 Summary
The circumnuclear environment of NGC 2110 consists of several components which each play a role in shaping the structure and dynamics of the region and the NLR. We explore the outflow using well-resolved kinematics from STIS spectroscopy and constrain the influence of the circumnuclear components using high resolution optical and radio imaging. Summarising our results:
- 1.
A circumnuclear dusty disk plays a major part in shaping the appearance of the NLR. We propose a model that explains the angular offset between the axis of the inner radio jet and the EELR in terms of the biconical illumination of this dusty gaseous disk. We also argue that the strong, symmetric bending of the jet is a consequence of the anisotropic mass and pressure distribution from the disk.
- 2.
A high surface brightness emission line structure, which we call the “inner plume”, is visible within the inner pc of the nucleus. The kinematics of the inner plume reveal it to be accelerated, broadened and disturbed – the site of a localised nuclear outflow. Its geometry indicates that it is not aligned along the radio jet, but possibly skirts the main jet flow. An ionisation analysis indicates that the inner plume is photo-ionised by the central active nucleus. Accounting for dust extinction in the disk, we conclude that the plume is possibly part of a extended symmetric outflow on either side of the nucleus.
- 3.
We explore the ionisation and kinematics of a bright compact nuclear knot, which has a size smaller than 20 pc and is barely resolved, even with HST. The low ionisation state of the knot and its high velocities, which are continuous with those of the inner plume, reveal that the nuclear outflow starts out on these small scales and then expands outwards. We speculate whether some of the kinematic structure in the knot may come from motion around the central black hole.
- 4.
Finally, we explore the dynamics of the outflow. Linking the jet bend to the pressure of the bulge atmosphere leads to constraints on the jet density and velocity. We suggest that this jet is significantly sub-relativistic and has sufficient ram pressure to drive the emission line outflow. Radiation pressure from the active nucleus or radio source pressure can both also account for the energetics of the inner plume, but the increasing influence of the gravitational potential of the galaxy with nuclear distance restricts the importance of radiation pressure in accelerating gas in the resolved inner plume.
9 Acknowledgements
DR acknowledges the support of the National Science Foundation through grants AST-0507483 and AST-0808133. We thank Neil Nagar for providing updated radio maps for this work. Based on observations made with the NASA/ESA Hubble Space Telescope, obtained from the data archive at the Space Telescope Institute. STScI is operated by the association of Universities for Research in Astronomy, Inc. under the NASA contract NAS 5-26555. The National Radio Astronomy Observatory is a facility of the National Science Foundation operated under co-operative agreement by Associated Universities, Inc.
References
- Allen et al. (2008) Allen M.G., Groves B.A., Dopita M.A., Sutherland R.S., Kewley L.J., 2008, ApJS, 178, 20
- Bradt et al. (1978) Bradt H.V., Burke B.F., Canizares C.R., Greenfield P.E., Kelley R.L., McClintock J.E., van Paradijs J., Koski A.T., 1978, ApJL, 226, 111
- Capetti et al. (1996) Capetti A., Axon D.J., Macchetto F., Sparks W.B., Boksenberg A. 1996, ApJ, 469, 554
- Cecil et al. (2002) Cecil G. et al., 2002, ApJ, 568, 627
- Cooke et al. (2000) Cooke A.J. et al., 2000, ApJS, 129, 517
- de Vaucouleurs et al. (1991) de Vaucouleurs G., de Vaucouleurs A., Corwin H.G., Buta R.J., Paturel G., Foque P., 1991, Third Reference Catalog of Bright GalaxiesNew Your: Springer
- Davies et al. (2009) Davies R., Maciejewski W., Hicks E.K.S., Tacconi L. J., Genzel R., Engel H., 2009, ApJ, 702, 114
- Dopita & Sutherland (1995) Dopita M.A., Sutherland R.S., 1995, ApJ, 455, 468
- Dopita & Sutherland (1996) Dopita M.A., & Sutherland R.S., 1996, ApJS, 102, 161
- Evans et al. (2006) Evans D.A., Lee J.C., Kamenetska M., Gallagher S.C, Kraft R.P., Hardcastle M.J., Weaver K.A., 2006, ApJ, 653, 1121
- Falcke, Wilson & Simpson (1998) Falcke H., Wilson A.S., Simpson C., 1998, ApJ, 502, 1999
- Fathi et al. (2006) Fathi K. et al., 2006, ApJL, 641, 25
- Ferruit et al. (1999) Ferruit P., Wilson A.S., Whittle M., Simpson C., Mulchaey J.S., Ferland G.J., 1999, ApJ, 523, 147
- Ferruit et al. (2004) Ferruit P., Mundell C.G., Nagar N.M., Emsellem E., Pécontal E., Wilson A.S., Schinnerer, E., 2004, MNRAS, 352, 1180
- Fiedler & Henriksen (1984) Fiedler R., Henriksen R.N., 1984, ApJ, 281, 554
- González Delgado et al. (2002) González Delgado R. M., Arribas S., Pérez E., Heckman T.M., 2002, ApJ, 579, 188
- Groves et al. (2004) Groves B.A., Dopita M.A, Sutherland R.S., 2004, ApJS, 153, 75
- Heckman et al. (1981) Heckman, T.M., Miley, G.K., van Breugel, W.J.M., & Butcher, H.R. 1981, ApJ, 247, 403
- Henriksen et al. (1981) Henriksen, R.N., Vallée, J.P., & Bridle, A.H. 1981, ApJ, 249, 40
- Maciejewski (2004) Maciejewski W., 2004, MNRAS, 354, 883
- Malkan (1998) Malkan M.A., Gorjian V., Tam R., 1998, ApJS, 117, 25
- McClintock et al. (1979) McClintock J.E., van Paradijs J., Remillard R.A., Canizares C.R., Koski A.T., Véron P., 1979, ApJ, 233, 809
- McNamara & Nulsen (2007) McNamara B.R., Nulsen P.E.J., 2007, ARA&A, 45, 117
- Miley (1980) Miley G.K., 1980, ARA&A, 18, 165
- Moran et al. (2007) Moran E.C, Barth A.J., Eracleous M., Kay L.E., 2007, ApJL, 668, 31
- Mulchaey et al. (1994) Mulchaey J.S., Wilson A.S., Bower G.A., Heckman T.M., Krolik J.H., Miley G.K., 1994, ApJ, 433, 625
- Mundell et al. (2000) Mundell C.G., Wilson A.S, Ulvestad J.S., Roy A.L., 2000, ApJ, 529, 816
- Nagar et al. (1999) Nagar N., Wilson A.S., Mulchaey J.S., Gallimore J.F., 1999, ApJS, 120, 209
- Nelson & Whittle (1995) Nelson C.H., Whittle M., 1995, ApJS, 99, 67
- Osterbrock (1989) Osterbrock D.E., 1989, Astrophysics of Gaseous Nebulae and Active Galactic Nuclei (University Science Books)
- Pérez-García & Rodríguez-Espinosa (2001) Pérez-García A.M., Rodríguez-Espinosa J.M. 2001, ApJ, 557, 39
- Pogge & Martini (2002) Pogge R.W., Martini P., 2002, ApJ, 569, 624
- Regan & Mulchaey (1999) Regan M.W., Mulchaey J.S., 1999, AJ, 117, 2676
- Rieke (1978) Rieke G.H., 1978, ApJ, 226, 550
- Salzer et al. (2005) Salzer J.J., Lee J.C., Melbourne J., Hinz J.L., Alonso-Herrero A., Jangren A., 2005, ApJ, 624, 661
- Sanders & Mirabel (1996) Sanders D.B., Mirabel I.F., 1996, ARA&A, 34, 749
- Shuder (1980) Shuder J.M., 1980, ApJ, 240, 32
- Tremaine et al. (2002) Tremaine S. et al., 2002, ApJ, 574, 740
- Ulvestad & Wilson (1983) Ulvestad J.S., Wilson A.S., 1983, ApJL, 264, 7
- Viegas-Aldrovandi & Gruenwald (1988) Viegas-Aldrovandi S.M., Gruenwald R.B., 1988, ApJ, 324, 683
- Weaver et al. (1995) Weaver K.A, Mushotzky R.F., Serlemitsos P.J., Wilson A.S., Elvis M., Briel U., 1995, ApJ, 442, 597
- Whittle et al. (1988) Whittle M. et al., 1988, ApJ, 326, 125
- Whittle (1992) Whittle M. et al., 1992, ApJ, 387, 109
- Whittle & Wilson (2004) Whittle M., Wilson A.S., 2004, AJ, 127, 606
- Whittle et al. (2005) Whittle M., Rosario D.J., Silverman J.D., Nelson C.H., Wilson A.S., 2005, AJ, 129, 104
- Wilson & Baldwin (1985) Wilson A.S., Baldwin J.A., 1985, ApJ, 289, 124
- Wilson et al. (1985) Wilson A.S., Baldwin J.A., Ulvestad J.S., 1985, ApJ, 291, 627