Physical and magnetic properties of Ba(Fe1-xRux)2As2 single crystals
Abstract
Single crystals of Ba(Fe1-xRux)2As2 , , have been grown and characterized by structural, magnetic and transport measurements. These measurements show that the structural/magnetic phase transition found in pure BaFe2As2 at 134 K is suppressed monotonically by Ru doping, but, unlike doping with TM=Co, Ni, Cu, Rh or Pd, the coupled transition seen in the parent compound does not detectably split into two separate ones. Superconductivity is stabilized at low temperatures for and continues through the highest doping levels we report. The superconducting region is dome like, with maximum Tc ( K) found around . A phase diagram of temperature versus doping, based on electrical transport and magnetization measurements, has been constructed and compared to those of the Ba(Fe1-xTMx)2As2 (TM=Co, Ni, Rh, Pd) series as well as to the temperature-pressure phase diagram for pure BaFe2As2. Suppression of the structural/magnetic phase transition as well as the appearance of superconductivity is much more gradual in Ru doping, as compared to Co, Ni, Rh and Pd doping, and appears to have more in common with BaFe2As2 tuned with pressure; by plotting and as a function of changes in unit cell dimensions, we find that changes in the ratio, rather than changes in , or V, unify the and phase diagrams for BaFe2As2 and Ba(Fe1-xRux)2As2 respectively.
pacs
74.10.+v, 74.25.Dw, 74.62.Bf, 74.62.Dh, 74.70.XaI introduction
The discovery of superconductivity in F-doped LaFeAsO[1] and K-doped BaFe2As2[2] in 2008 led to extensive interest in these families of FeAs-based compounds. The superconducting critical temperature, , has risen as high as 56 K for F doped RFeAsO[3] and as high as 38 K in K and Na doped AEFe2As2 systems (AE=Ba, Sr, Ca)[2]. Superconductivity was also found in Co doped AEFe2As2[4] and RFeAsO[5]. More recently, superconductivity has been found in other 3d, and transition metal, electron doped BaFe2As2 systems[6, 7, 8, 9, 10, 11, 12, 13, 14], as well as SrFe2As2 and CaFe2As2. Although the electron doped AEFe2As2 systems have lower values than the hole doped ones[10, 11, 12, 13, 14], they have been studied extensively because doping is more homogeneous in these systems and single crystals can be more easily and reproduceably grown. In order to understand the conditions for superconductivity in these systems, temperature versus doping phase diagrams must first be constructed. Detailed studies have been made for TM doped BaFe2As2 (TM=Co, Ni, Cu, Rh, Pd, Pt, Ir)[10, 11, 12, 13, 15, 16, 14, 6]. For Co, Ni, Cu, Rh and Pd, temperature vs doping concentration, , and temperature vs electron count, , phase diagrams show similar properties, with the temperature of the structural/magnetic transition, , seen in the parent compound being suppressed and separated in a similar manner with , and evolving in a similar manner with , especially on the overdoped side of the superconducting dome[6, 10, 14, 17]. Although TM doping of the BaFe2As2 system is convenient – providing large homogeneous crystals – it is not unique in tuning and . Pressure can also be used to suppress and stabilize a low temperature superconducting state[18, 19, 20].
In contrast with its 4d neighbors Rh and Pd, Ru doping provides no extra electrons to the bands. However, recent polycrystalline studies in both the SrFe2As2[21, 22] and BaFe2As2[7] systems show that Ru substitition on the Fe site suppresses the structural/magnetic phase transition and leads to superconductivity, indicating that this system may allow a direct comparison of nominally isovalent doping and electron doping TM substitution as well as pressure studies. Isovalent doping induced superconductivity, as pressure before it, indicates that whereas and are important parameters in parameterizing the phase transitions in these systems, changes in the unit cell parameter may be important as well.
Based on this, we have studied Ru doped BaFe2As2 single crystals in order to compare the effects of isoelectronic doping to 3d and 4d transition metal, electron doped compounds. As we wrote this work up, a similar, complimentary, study was posted;[23, 24] comparison to these data will be made as well.
II experimental methods
Single crystals of Ba(Fe1-xRux)2As2 were grown out of self flux using conventional high-temperature solution growth techniques[10, 25]. FeAs and RuAs were synthesized in the same manner as in [10]. Small Ba chunks and FeAs/RuAs powder were mixed together in a ratio of Ba:TMAs=1:4. The mixture was then placed in an alumina crucible with a ”catch” crucible filled with quartz wool placed on top. Both crucibles were sealed in a silica tube under 1/6 atmosphere of Ar gas. The sealed tube was heated up to 1180∘C over 12 hours, held at 1180∘C for 8-12 hours, and then cooled over 45-65 hours. The final temperature varied between 1050∘C and 1100∘C, increasing with the Ru doping level. Once the furnace reached the final temperature, the excess FeAs/RuAs liquid was decanted, leaving the single crystals behind. Unfortunately, this increasing decanting temperature made doping levels above difficult to produce.
Powder x-ray diffraction measurements, with a Si standard, were performed using a Rigaku Miniflex diffractometer with Cu radiation at room temperature. Diffraction patterns were taken on ground single crystals from each batch. Only very small FeAs impurity peaks were found as a secondary phase. The unit cell parameters were refined by ”Rietica” software. Elemental analysis of single crystal samples was used to determine the actual percentage of the dopant in the lattice as opposed to the nominal doping level. This was performed using wavelength dispersive x-ray spectroscopy (WDS) in a JEOL JXA-8200 electron-microprobe. Magnetization data were collected in a Quantum Design (QD) Magnetic Properties Measurement System (MPMS). Temperature-dependent AC electrical resistance data (f=16Hz, I=3mA) was collected using either a QD MPMS with a LR700 resistance bridge or a QD Physical Properties Measurement System (PPMS). Electrical contact was made to the sample using Epotek H20E silver epoxy to attach Pt wires in a four-probe configuration.
III results
A summary of the WDS measurement data is presented in Table 1. For each batch, between 1 and 5 crystal surfaces were measured. The table shows the number of points measured, the nominal value measured, the average value, and two times the standard deviation of the values measured. All values given in this paper are the average values determined by wavelength dispersive x-ray spectroscopy (WDS). Fig. 1 shows the measured vs nominal Ru concentration, as well as the error bars on the measured values. For the variation in Ru content within a batch is small, in the range of of the value. Such variation is similar to what is found for other 3d and 4d doping series[10, 6, 14, 17]. For there is a sudden and rather dramatic increase in the variation of the Ru concentration within a single batch (and even a single sample). It is not clear what the origin of the change in homogeneity is, but it is also noted, in a qualitative manner, in ref.[23] as well.
| Ba(Fe1-xRux)2As2 | |||||||||||
|---|---|---|---|---|---|---|---|---|---|---|---|
| N | 14 | 16 | 12 | 12 | 11 | 19 | 18 | 13 | 14 | 15 | 25 |
| 0.05 | 0.1 | 0.125 | 0.15 | 0.175 | 0.2 | 0.225 | 0.25 | 0.265 | 0.27 | 0.3 | |
| 0.021 | 0.048 | 0.073 | 0.092 | 0.126 | 0.161 | 0.210 | 0.24 | 0.29 | 0.29 | 0.36 | |
| 0.001 | 0.001 | 0.001 | 0.003 | 0.003 | 0.005 | 0.013 | 0.05 | 0.05 | 0.05 | 0.05 | |

Powder x-ray diffraction measurements confirm that Ba(Fe1-xRux)2As2 forms in the I4/mmm, ThCr2Si2 structure and that impurities are minimal (Fig. 2). Rietveld refinement of the XRD data gives the and lattice parameters, which are plotted, along with the unit cell volume, as a function of in Fig. 3.


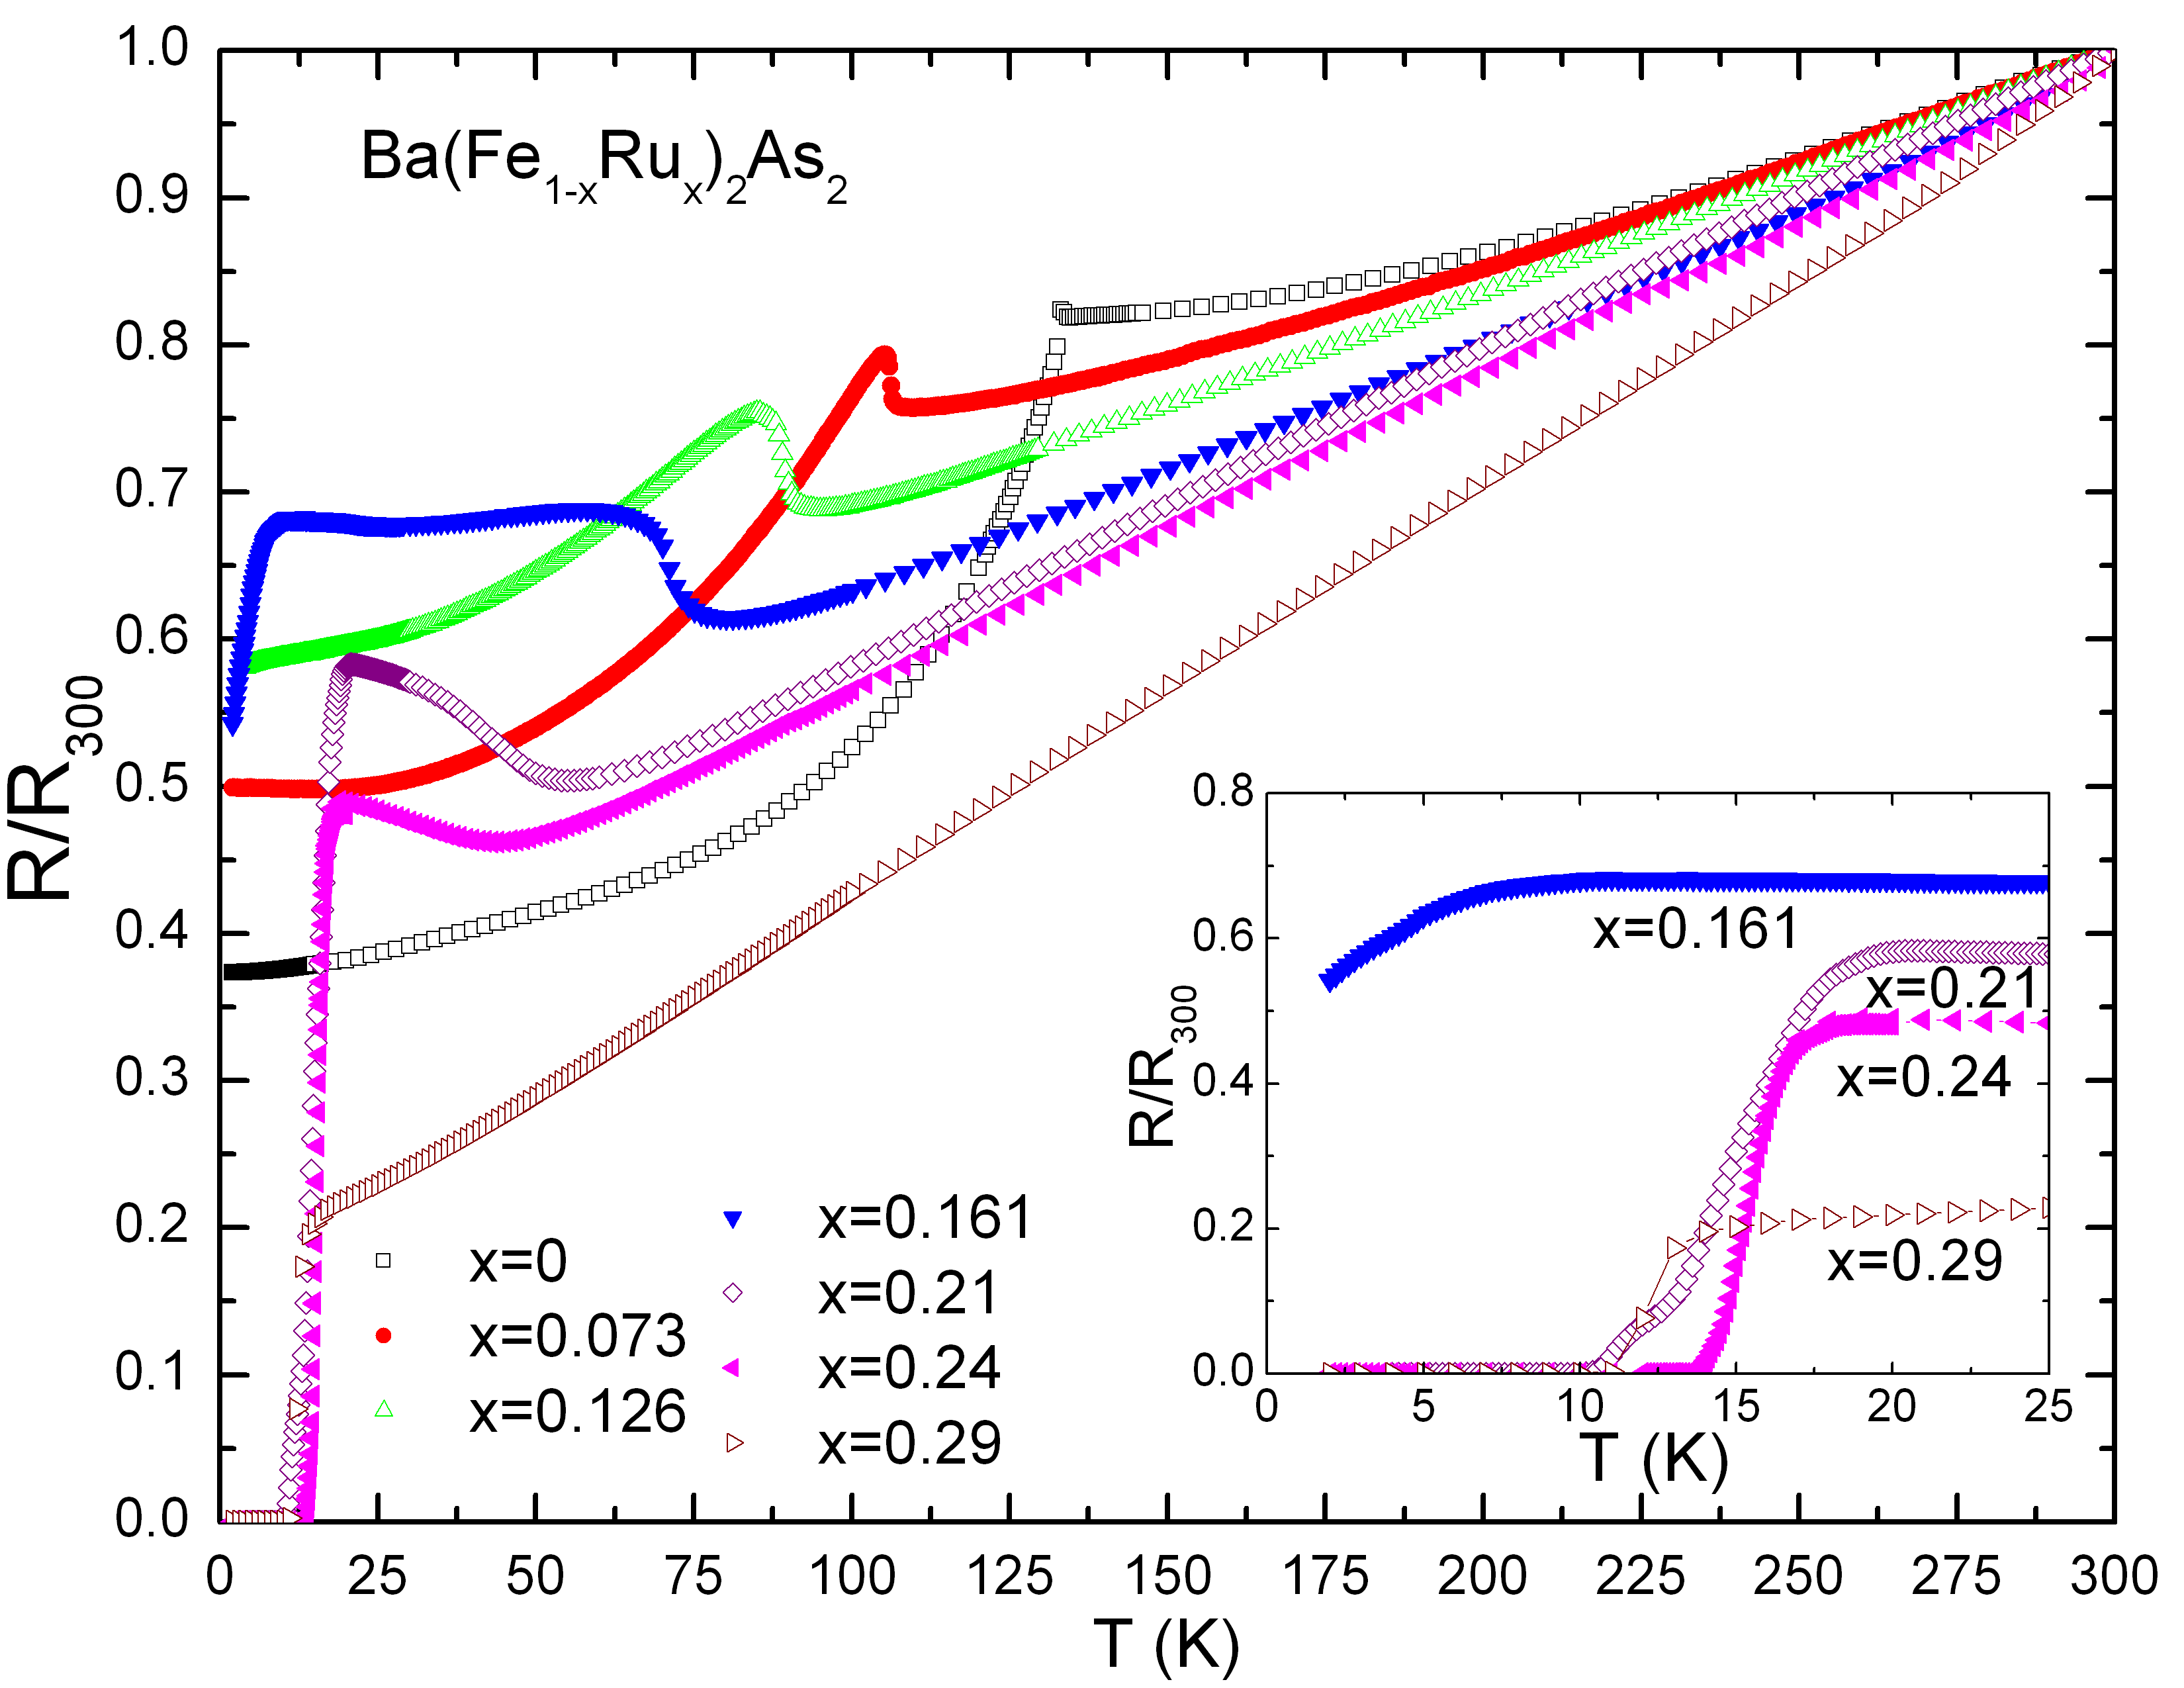
Figure 4 shows the normalized electrical resistance data of the Ba(Fe1-xRux)2As2 series from 5 K to 300 K. Normalized resistance is plotted instead of resistivity because of the tendency of these samples to exfoliate or crack[10, 26, 27]. The anomaly in normalized resistance at 134 K for pure BaFe2As2 is associated with a first order phase transition into an orthorhombic antiferromagnetic state[28]. As in the case of Co, Ni, Cu, Rh and Pd substitution[10, 14, 6, 17], the temperature of the resistive anomaly is suppressed monotonically and the shape is changed from the sharp loss of resistance on cooling through seen in pure BaFe2As2 to a broader increase in resistance on cooling through for intermediate values. For , anomalies associated with are no longer detectable. Superconductivity begins to appear above (resistive onset only) and is fully manifested () by . A maximum of 16.5 K is achieved at . is suppressed for higher values of . The superconducting transition is quite broad compared to other TM dopings: more than 7 K wide for compared with a 3 K width for a Co doping level of [10]. Such a wide transition is more typical of pressure induced superconductivity rather than chemical doping[20].

Figure 5(a) shows high field (H=70 kOe) data for representative members of the Ba(Fe1-xRux)2As2 series. At high temperatures the ratio is roughly linear and decreases with decreasing temperature, with a slope that decreases with increasing Ru doping. As with normalized resistance, the magnetization of the parent compound manifests a clear change at 134 K, correlated with the structural/magnetic phase transition[28]. As is increased up to , this transition is suppressed and broadened without qualitative change. Starting with the transition becomes much flatter and broader, and by it is barely visible. At it has completely vanished.
Figure 5(b) shows the low field (50 Oe) data for the superconducting members of the Ba(Fe1-xRux)2As2 series. These samples show a clear diamagnetic signal in the zero field cooled (ZFC) data, as well as some Meissner expulsion. It is worth noting that whereas the ZFC diamagnetic signal for Co, Ni, Rh, Pd and Cu/Co dopings are all similar and close to [10, 6, 14, 17, 29], the low temperature values for Ru doping (5(b)) are smaller in amplitude and vary more.
IV discussion
Figures 6 and 7 show normalized resistance and magnetization data, along with their derivatives, for and samples respectively. These figures show the criteria used for determining the structural/magnetic phase transition temperatures for these materials.


Figures 6(c) and 7(c) show comparisons of normalized resistance derivatives for Ru, Co and Rh doped BaFe2As2 with similar values. In the Co and Rh series, a clear splitting of the two transitions is visible. (At the same temperatures, the derivatives of magnetization and heat capacity show split features as well[10, 6, 14, 17].) By contrast, we do not see these separated features in the derivatives of the normalized resistance from the Ru system. These features have been shown to correspond to a splitting of the joint transition into two transitions, one structural the other magnetic[6, 14, 16, 17, 30]. Although the authors of ref.[23] claim to see a split transition, it appears to be a subtle feature compared to Co or Rh data. The single feature in the Ru doped series data suggests that either the splitting is much smaller, or absent, in this system or that the resistive feature associated with is much weaker in this system. It is possible that the splitting is caused by the extra electrons provided by other TM doping (eg. Co, Ni, Cu, Rh, Pd).
Onset and offset criteria were used to determine from this resistance data. was determined from the magnetization data by extrapolating the maximum slope of the ZFC data back to the normal state. There is fair agreement between determined from normalized resistance and determined from magnetization. It should be noted, though, that (i) superconductivity primarily occurs in the region where the spread in is large, and (ii) the superconducting transition is broad in and both ZFC and field cooled Meissner data are somewhat lower than for other TM doped series.


Using these criteria, the data presented in Figs. 4 and 5 are summarized in a phase diagram shown in Fig. 8. Overall, the phase diagram for the Ba(Fe1-xRux)2As2 series is qualitatively quite similar to that of the Co, Ni, Rh and Pd diagrams: increasing suppresses the structural/magnetic phase transition, a superconducting dome appears above some critical value, and this dome has a maximum near the point where extrapolates to zero. However, there is a key difference: suppression of is much slower than for other TM dopings (Co, Ni, Cu, Rh, Pd)[10, 6, 14, 17, 29]. In previous comparisons of 3d and 4d TM dopings[6, 14, 17], we showed that suppression of occurs at roughly the same rate regardless of differences in size and electron count between dopants; the suppression of in Ba(Fe1-xRux)2As2 is about three times slower.
As in the case of Rh and Pd doped BaFe2As2[6], with Ru doping the -lattice parameter shrinks compared to the parent BaFe2As2, while the -lattice parameter and the unit cell volume, V, grow. (This is in contrast to the 3d TM dopings, where all three shrink with increasing .) By way of comparison: a Ru doping level of has and and a Rh doping level of has and .[6] Because the crystallographic trends of all three 4d TM dopant series (Ru, Rh and Pd) are similar, the major differences in their phase diagrams suggest that steric effects alone are not enough to explain the differences in behavior of this system with doping (ie. the extra electrons in Rh and Pd are responsible for the much more rapid effects of doping).
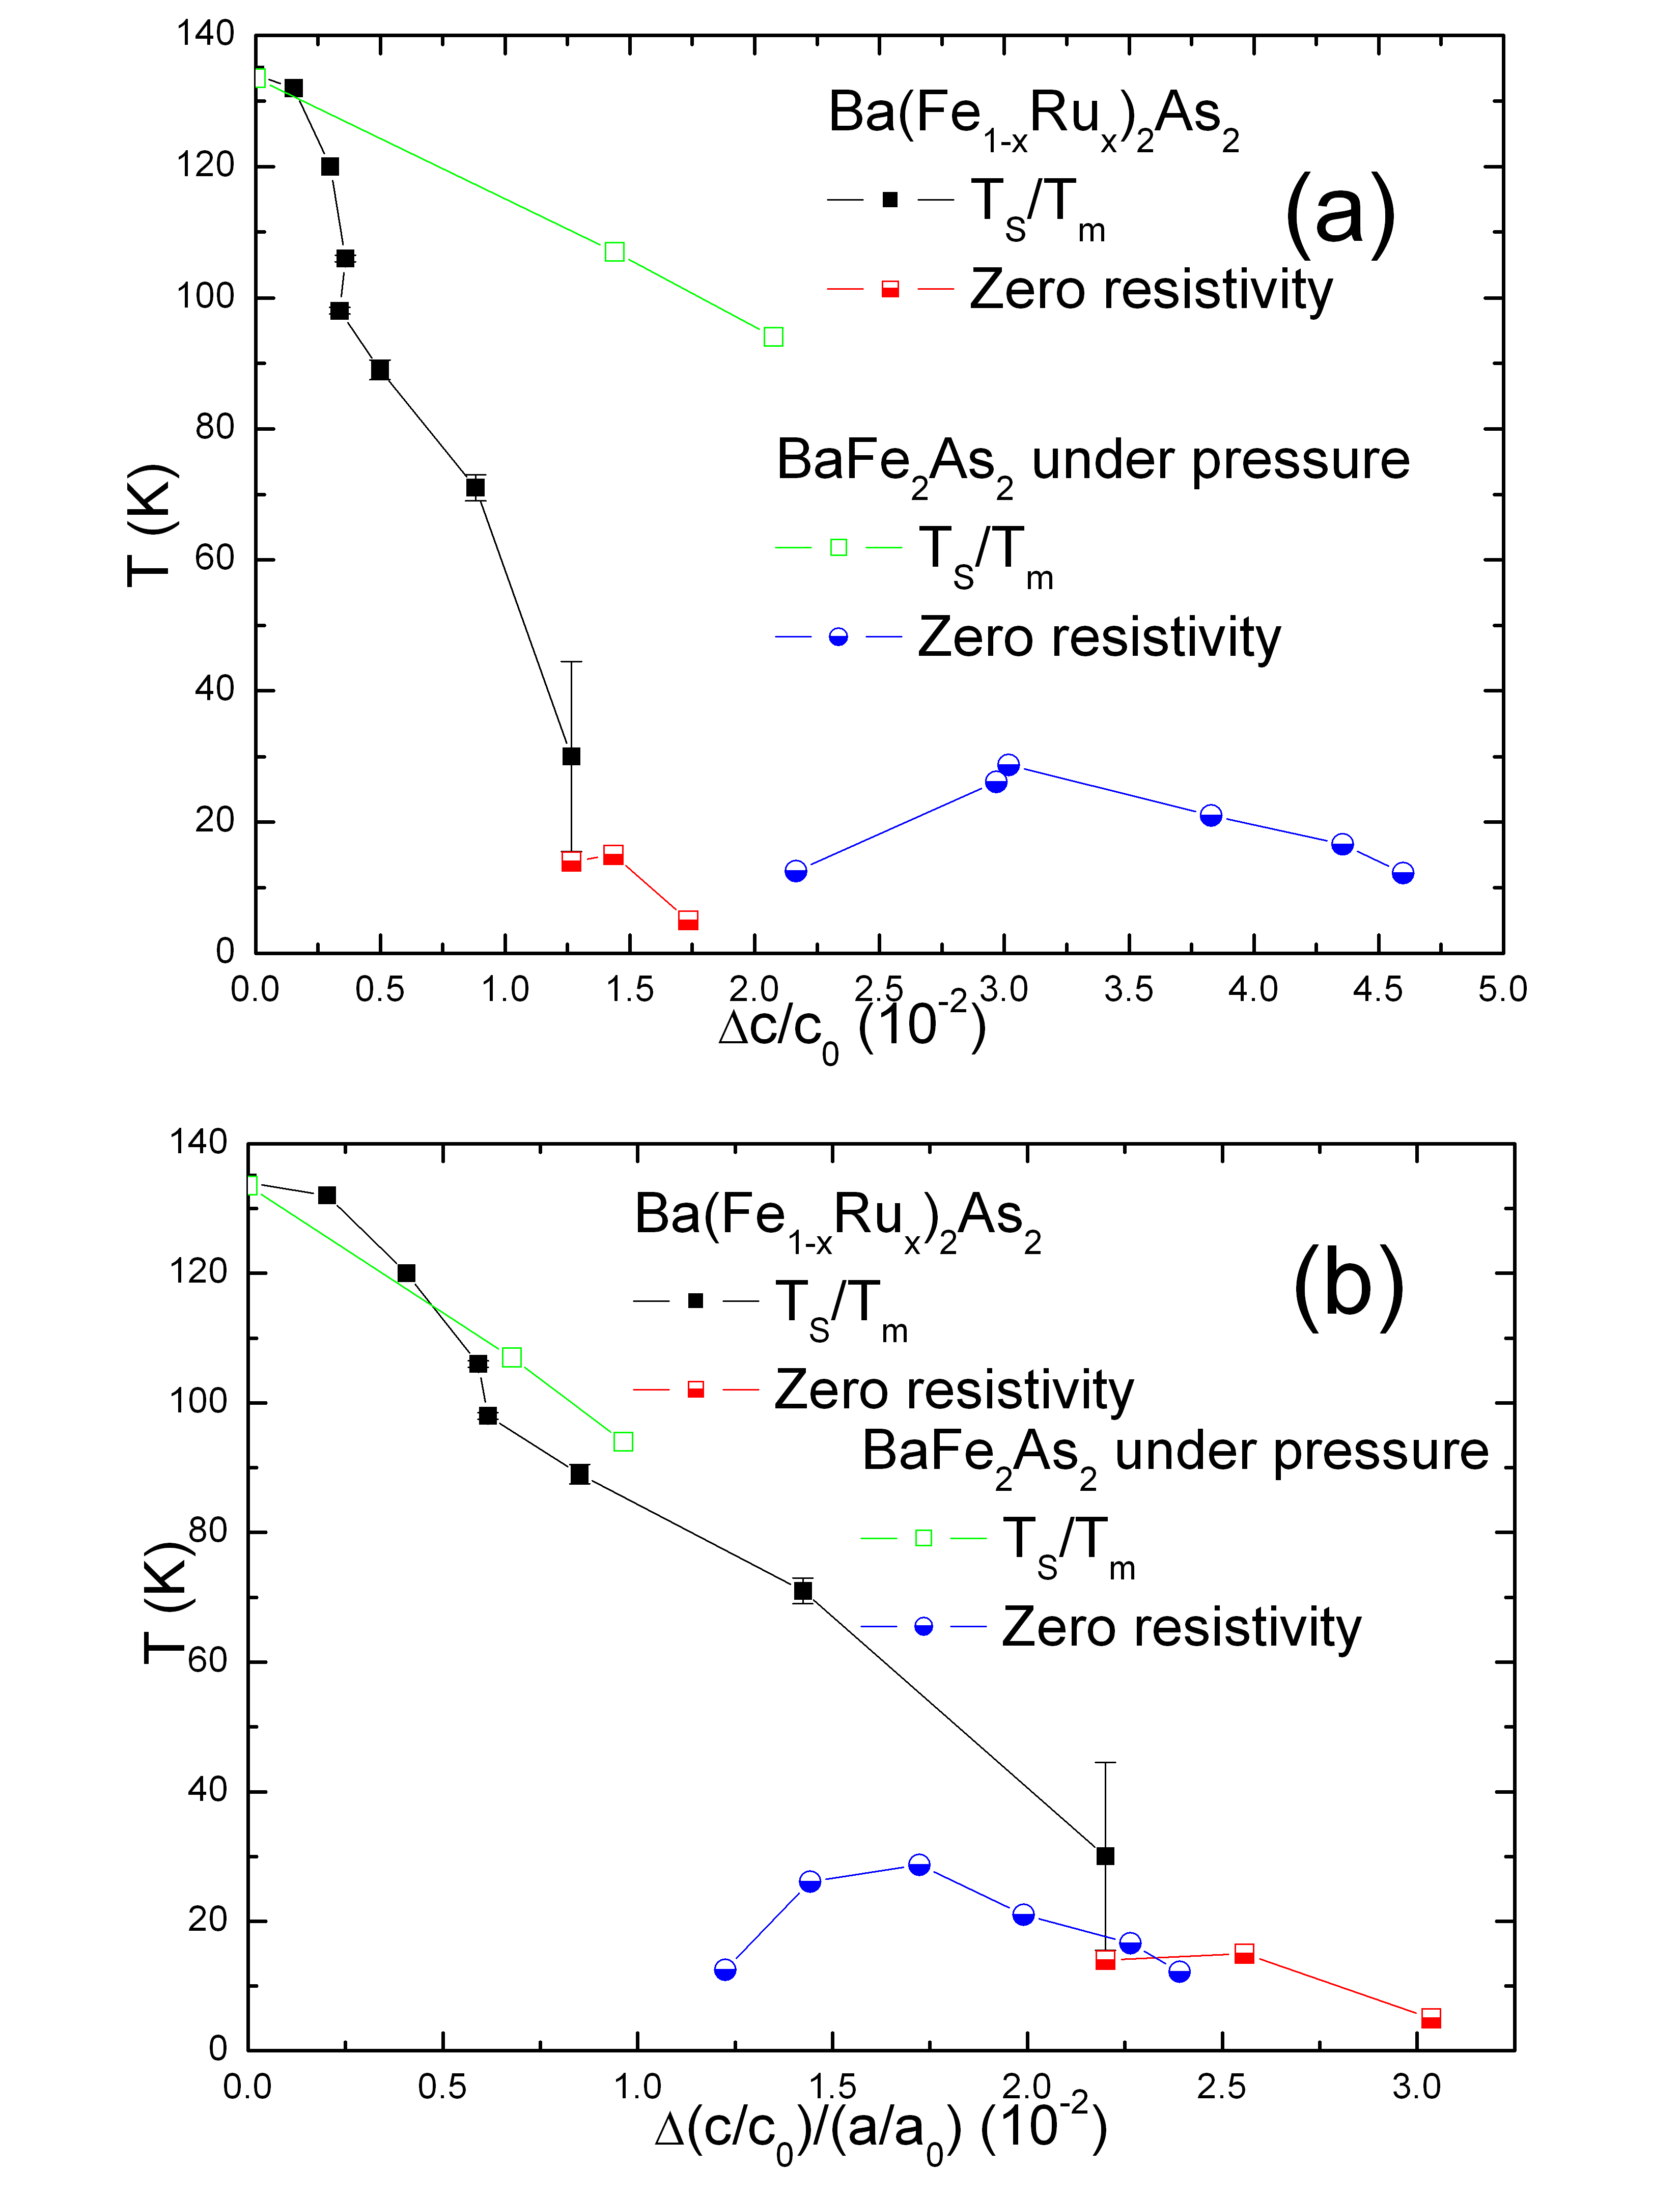
Although the maximum superconducting critical temperature, , is significantly lower in the Ru doped system, there is a clear similarity between the Ru doped phase diagram and the pressure dependent, , phase diagram of the parent BaFe2As2 compound[20], as can be seen in Fig. 9. The similarity of the phase diagrams suggests that changes in the unit cell dimensions may be playing a large role in determining the superconducting behavior, with the effects of Ru substituion in this system being similar to physical pressure in the undoped BaFe2As2 system. The difference in is most likely caused by the Ru dopant disordering the Fe-plane, whereas pressure induces no such distortion.
Whereas the agreement between the and phase diagrams in Fig. 9 is good, the scaling between and was arbitrarily choosen to optimize the overlap of the two data sets. Using our data on the -dependence of the unit cell parameters (3) in combination with the data from ref. [31] on the pressure dependence of the unit cell parameters of BaFe2As2, we can make this comparison more quantitative. Of the four combinations of the unit cell parameters: , , V and , only and show similar responses to pressure and doping; and V both increase with doping whereas they decrease with . Figures 10(a) and (b) present our Ru-doping data as well as the pressure data from ref. [20] plotted as functions of the changes in and . A comparison of these two figures clearly indicates that rather than better parameterizes the effects of doping and pressure. This result means that, based on these two isoelectronic perturbations (pressure and Ru doping), changes in the ratio appear to be more physically important than changes in alone.
The other isoelectronic substitution which produces superconductivity in BaFe2As2 is P doping on the As site[32, 33]. Although the maximum in the BaFe2(As1-xPx)2 system is quite a bit higher than in the Ba(Fe1-xRux)2As2 system (K), several key properties are similar. is suppressed in a relatively gradual manner and the maximum value occurs at a comparably high doping level (, ) and extends over a much wider range than in any of the electron doped TM series[32, 33]. Furthermore, both Ru doping and underdoping of P produce wider transitions than other TM dopings (eg. Co, Ni, Rh, Pd)[10, 34, 6, 33]. On the other hand, taking changes in and with P doping into account, and for P-doped and Ru-doped BaFe2As2 scale better with changes in than with changes in [33]. This means that, if we include P-doping as a third isoelectronic perturbation, then neither changes in nor universally describe the and phase diagrams.
V Summary
Single crystals of Ba(Fe1-xRux)2As2 can be grown for , although Ru homogeneity becomes less well controlled for . The structural and magnetic phase transition temperature, , is suppressed as increases but does not clearly split, as it does for TM = Co, Ni, Cu, Rh, and Pd doping. As is suppressed superconductivity appears, reaching a maximum value of 16.5 K for , near the point that extrapolates to K. Whereas the suppression of and the stabilization of occur at a much slower rate for Ru doping than they do for doping with TM = Co, Ni, Cu, Rh, or Pd, indicating that the additional electrons brought by these dopants play a significant role in tuning of this system, there is a remarkable agreement between two isoelectronic phase diagrams (Ru-doping and pressure) of BaFe2As2 when plotted as , but not when plotted as .
VI Acknowledgements
Work at the Ames Laboratory was supported by the Department of Energy, Basic Energy Sciences under Contract No. DE-AC02-07CH11358. We would like to thank E. D. Mun, S. Kim, X. Lin, R. Gordon, R. Fernandes, A. Kreyssig, R. Roggers and J. Brgoch for help and useful discussions.
References
- [1] Y. Kamihara, T. Watanabe, M. Hirano, and H. Hosono, Journal of the American Chemical Society, 130, 3297 (2008).
- [2] M. Rotter, M. Tegel, and D. Johrendt, Phys. Rev. Lett., 101, 107006 (2008a).
- [3] R. Zhi-An, L. Wei, Y. Jie, Y. Wei, S. Xiao-Li, Zheng-Cai, C. Guang-Can, D. Xiao-Li, S. Li-Ling, Z. Fang, and Z. Zhong-Xian, Chinese Physics Letters, 25, 2215 (2008).
- [4] A. S. Sefat, R. Jin, M. A. McGuire, B. C. Sales, D. J. Singh, and D. Mandrus, Phys. Rev. Lett., 101, 117004 (2008a).
- [5] A. S. Sefat, A. Huq, M. A. McGuire, R. Jin, B. C. Sales, D. Mandrus, L. M. D. Cranswick, P. W. Stephens, and K. H. Stone, Phys. Rev. B, 78, 104505 (2008b).
- [6] N. Ni, A. Thaler, A. Kracher, J. Q. Yan, S. L. Bud’ko, and P. C. Canfield, Physical Review B (Condensed Matter and Materials Physics), 80, 024511 (2009).
- [7] S. Sharma, A. Bharathi, S. Chandra, V. R. Reddy, S. Paulraj, A. T. Satya, V. S. Sastry, A. Gupta, and C. S. Sundar, Phys. Rev. B, 81, 174512 (2010).
- [8] X. L. Wang, H. Y. Shi, X. W. Yan, Y. C. Yuan, Z.-Y. Lu, X. Q. Wang, and T.-S. Zhao, Applied Physics Letters, 96, 012507 (2010).
- [9] S. R. Saha, T. Drye, K. Kirshenbaum, N. P. Butch, P. Y. Zavalij, and J. Paglione, Journal of Physics: Condensed Matter, 22, 072204 (2010).
- [10] N. Ni, M. E. Tillman, J.-Q. Yan, A. Kracher, S. T. Hannahs, S. L. Bud’ko, and P. C. Canfield, Physical Review B (Condensed Matter and Materials Physics), 78, 214515 (2008).
- [11] J.-H. Chu, J. G. Analytis, C. Kucharczyk, and I. R. Fisher, Physical Review B (Condensed Matter and Materials Physics), 79, 014506 (2009).
- [12] F. Ning, K. Ahilan, T. Imai, A. S. Sefat, R. Jin, M. A. McGuire, B. C. Sales, and D. Mandrus, Journal of the Physical Society of Japan, 78, 013711 (2009).
- [13] L. Fang, H. Luo, P. Cheng, Z. Wang, Y. Jia, G. Mu, B. Shen, I. I. Mazin, L. Shan, C. Ren, and H.-H. Wen, Phys. Rev. B, 80, 140508 (2009).
- [14] P. C. Canfield, S. L. Bud’ko, N. Ni, J. Q. Yan, and A. Kracher, Phys. Rev. B, 80, 060501 (2009).
- [15] C. Lester, J.-H. Chu, J. G. Analytis, S. C. Capelli, A. S. Erickson, C. L. Condron, M. F. Toney, I. R. Fisher, and S. M. Hayden, Physical Review B (Condensed Matter and Materials Physics), 79, 144523 (2009).
- [16] D. K. Pratt, W. Tian, A. Kreyssig, J. L. Zarestky, S. Nandi, N. Ni, S. L. Bud’ko, P. C. Canfield, A. I. Goldman, and R. J. McQueeney, Phys. Rev. Lett., 103, 087001 (2009).
- [17] P. C. Canfield and S. L. Bud’ko, arXiv:1002.0858v1 [cond-mat.supr-con].
- [18] M. S. Torikachvili, S. L. Bud’ko, N. Ni, and P. C. Canfield, Phys. Rev. B, 78, 104527 (2008).
- [19] P. L. Alireza, Y. T. C. Ko, J. Gillett, C. M. Petrone, J. M. Cole, G. G. Lonzarich, and S. E. Sebastian, Journal of Physics: Condensed Matter, 21, 012208 (2009).
- [20] E. Colombier, S. L. Bud’ko, N. Ni, and P. C. Canfield, Phys. Rev. B, 79, 224518 (2009).
- [21] W. Schnelle, A. Leithe-Jasper, R. Gumeniuk, U. Burkhardt, D. Kasinathan, and H. Rosner, Phys. Rev. B, 79, 214516 (2009).
- [22] Y. Qi, L. Wang, Z. Gao, D. Wang, X. Zhang, and Y. Ma, Physica C: Superconductivity, 469, 1921 (2009).
- [23] F. Rullier-Albenque, D. Colson, A. Forget, P. Thuéry, and S. Poissonnet, Phys. Rev. B, 81, 224503 (2010).
- [24] V. Brouet, F. Rullier-Albenque, M. Marsi, B. Mansart, J. Faure, L. Perfetti, A. Taleb-Ibrahimi, P. L. Fevre, F. Bertran, A. Forget, and D. Colson, arXiv:1002.4952v1 [cond-mat.supr-con].
- [25] P. C. Canfield and Z. Fisk, Phil. Mag. B, 65, 1117 (1992).
- [26] M. A. Tanatar, N. Ni, C. Martin, R. T. Gordon, H. Kim, V. G. Kogan, G. D. Samolyuk, S. L. Bud’ko, P. C. Canfield, and R. Prozorov, Physical Review B (Condensed Matter and Materials Physics), 79, 094507 (2009a).
- [27] M. A. Tanatar, N. Ni, G. D. Samolyuk, S. L. Bud’ko, P. C. Canfield, and R. Prozorov, Physical Review B (Condensed Matter and Materials Physics), 79, 134528 (2009b).
- [28] M. Rotter, M. Tegel, D. Johrendt, I. Schellenberg, W. Hermes, and R. Pottgen, Physical Review B (Condensed Matter and Materials Physics), 78, 020503 (2008b).
- [29] N. Ni, Structural / magnetic phase transitions and superconductivity in Ba(Fe1-xTMx)2As2 (TM=Co, Ni, Cu, Co / Cu, Rh and Pd) single crystals, Ph.D. thesis, Iowa State University (2009).
- [30] A. Kreyssig, M. G. Kim, S. Nandi, D. K. Pratt, W. Tian, J. L. Zarestky, N. Ni, A. Thaler, S. L. Bud’ko, P. C. Canfield, R. J. McQueeney, and A. I. Goldman, Phys. Rev. B, 81, 134512 (2010).
- [31] S. A. J. Kimber, A. Kreyssig, Y.-Z. Zhang, H. O. Jeschke, R. Valent�, F. Yokaichiya, E. Colombier, J. Yan, T. C. Hansen, T. Chatterji, R. J. McQueeney, P. C. Canfield, A. I. Goldman, and D. N. Argyriou, Nature Materials, 8, 471 (2009).
- [32] S. Jiang, H. Xing, G. Xuan, C. Wang, Z. Ren, C. Feng, J. Dai, Z. Xu, and G. Cao, Journal of Physics: Condensed Matter, 21, 382203 (2009).
- [33] S. Kasahara, T. Shibauchi, K. Hashimoto, K. Ikada, S. Tonegawa, R. Okazaki, H. Shishido, H. Ikeda, H. Takeya, K. Hirata, T. Terashima, and Y. Matsuda, Phys. Rev. B, 81, 184519 (2010).
- [34] L. J. Li, Y. K. Luo, Q. B. Wang, H. Chen, Z. Ren, Q. Tao, Y. K. Li, X. Lin, M. He, Z. W. Zhu, G. H. Cao, and Z. A. Xu, New Journal of Physics, 11, 025008 (2009).