The AGN, Star-forming, and Morphological Properties of Luminous IR-Bright/Optically-Faint GalaxiesNote: Accepted for publication in The Astrophysical Journal
Abstract
We present the AGN, star-forming, and morphological properties of a sample of 13 MIR-luminous ( Jy) IR-bright/optically-faint galaxies (IRBGs, ). While these sources were drawn from deep Chandra fields with ks X-ray coverage, only 7 are formally detected in the X-ray and four lack X-ray emission at even the level. Spitzer IRS spectra, however, confirm that all of the sources are AGN-dominated in the mid-IR, although half have detectable PAH emission responsible for of their mid-infrared flux density. When combined with other samples, this indicates that at least 30-40% of luminous IRBGs have star-formation rates in the ULIRG range ( yr-1). X-ray hardness ratios and MIR to X-ray luminosity ratios indicate that all members of the sample contain heavily X-ray obscured AGN, 80% of which are candidates to be Compton-thick. Furthermore, the mean X-ray luminosity of the sample, log (ergs s-1), indicates that these IRBGs are Type 2 QSOs, at least from the X-ray perspective. While those sources most heavily obscured in the X-ray are also those most likely to display strong silicate absorption in the mid-IR, silicate absorption does not always accompany X-ray obscuration. Finally, of the IRBGs are merger candidates, a rate consistent with that of sub-mm galaxies (SMGs), although SMGs appear to be physically larger than IRBGs. These characteristics are consistent with the proposal that these objects represent a later, AGN-dominated, and more relaxed evolutionary stage following soon after the star-formation-dominated one represented by the SMGs.
Subject headings
galaxies: active — infrared: galaxies — X-rays: galaxiesI. Introduction
| ID | Field | Program | Observation | Ramp Duration (s) | Number of Cycles | Total | ||
|---|---|---|---|---|---|---|---|---|
| ID aaThe PI’s of programs 30419, 20456, and 20733 are G. H. Rieke, R. Chary, and C. M. Urry, respectively. | Date | LL1bbLong Low 1st order, 19.5-38.0 µm | LL2ccLong Low 2nd order, 14.0-21.3 µm | LL1bbLong Low 1st order, 19.5-38.0 µm | LL2ccLong Low 2nd order, 14.0-21.3 µm | Integration (s)ddThe IRS nodding performed in Standard Staring mode results in two spectra per cycle, each with an exposure time equal to the ramp duration. | ||
| IRBG1 | E-CDFS | 30419 | 2006 Sept 15 | 120 | 120 | 10 | 10 | 4800 |
| IRBG2 | CDF-S | 30419 | 2007 Aug 31 | 120 | 120 | 23 | 23 | 11040 |
| IRBG3 | E-CDFS | 30419 | 2006 Sept 14 | 120 | 120 | 27 | 27 | 12960 |
| IRBG4 | CDF-S | 30419 | 2007 Aug 31 | 120 | 120 | 15 | 15 | 7200 |
| IRBG5 | CDF-N | 20456eeThe IRS spectrum for this source was previously published in [80] and [67] | 2006 Apr 24 | 120 | 120 | 6 | 6 | 2880 |
| IRBG6 | CDF-N | 20733 | 2006 May 26 | 30 | 30 | 80 | 80 | 12880 |
| IRBG7 | CDF-N | 20456ffThe IRS spectrum for this source was previously published in [67] | 2006 Apr 22 | 120 | 120 | 6 | 6 | 9600 |
| IRBG8 | EGS | 30419 | 2007 Apr 27 | 120 | 120 | 12 | 12 | 5760 |
| IRBG9 | EGS | 30419 | 2006 Jun 26 | 120 | 120 | 4 | 4 | 1920 |
| IRBG10 | EGS | 30419 | 2007 Apr 27 | 120 | 120 | 7 | 7 | 3360 |
| IRBG11 | EGS | 30419 | 2007 Mar 25 | 120 | 120 | 28 | 28 | 13440 |
| IRBG12 | EGS | 30419 | 2007 Mar 25 | 120 | 120 | 18 | 18 | 8640 |
| IRBG13 | EGS | 30419 | 2007 Apr 27 | 120 | 120 | 6 | 6 | 2880 |
Studies of heavily-obscured star-forming galaxies and active galactic nuclei (AGN) in the distant Universe have lagged behind those of their unobscured counterparts, due largely to their being extremely faint in the optical and UV. This optically faintness, however, need not be a limitation and can instead be used as a selection criterion, as dust-enshrouded sources faint at short wavelengths should be comparably bright in the infrared where their absorbed radiation is re-emitted. One might therefore expect sources with bright infrared emission yet faint optical magnitudes () to be ideal obscured galaxy/AGN candidates, and indeed, such sources comprised some of the first Spitzer Space Telescope [103] targets.
Initial studies of the brightest ( Jy) IR-bright/optically-faint galaxies (referred to here as IRBGs) targeted for Spitzer IRS mid-infrared spectroscopic [48] follow-up observations indicated that most lie at and have either featureless spectra or spectra dominated by silicate absorption, properties indicative of AGN activity [49, 105, 101, e.g.,]. Their optical faintness was therefore attributed both to distance as well as to obscuration by the dust surrounding an AGN’s central engine, although more recent studies suggest that the AGN’s host galaxy may also contribute significantly to the observed extinction [11, 76].
Subsequent multiwavelength studies have since confirmed the AGN nature of the most luminous IRBGs, although they reach differing conclusions concerning the relative importance of star-formation and AGN activity amongst fainter ( Jy) IRBGs [28, 29, 41, 36, 79, 27, 96, 37, e.g.,]. Furthermore, they have shown that the space density of the most luminous IRBGs is comparable to that of luminous, unobscured AGN at [28]. If these sources are in fact heavily obscured AGN, they therefore represent an important phase in the growth of supermassive black holes during the era in which both star-formation and AGN activity peaked.
To constrain the level of obscuration in these luminous AGN, studies turned to the X-ray. Unfortunately, the large-area survey fields from which the luminous, and therefore rare, IRBGs were initially selected (e.g. the Spitzer First-Look Survey, the NOAO Deep Wide Field Survey, and the SWIRE Survey) and then followed-up with IRS have minimal X-ray coverage capable of detecting only the brightest AGN [28]. Nonetheless, studies in these fields suggest that at least and perhaps as many as 95% of X-ray–detected IRBGs with mJy are X-ray–obscured AGN [54], some of which may be Compton-thick [77, 4].
Alternatively, other studies have focused on samples of IRBGs selected in fields with deeper X-ray coverage, such as the Chandra Deep Fields and COSMOS. The deepest X-ray fields, however, are also the smallest, so those studies most suited to constrain X-ray obscuration are also those in which the focus generally shifts to the fainter and more numerous population of IRBGs whose nature remains controversial. In the larger COSMOS field, however, Fiore et al. [37] find that 40% of IRBGs with moderate flux densities of Jy are detected in the X-ray with a mean rest-frame obscured luminosity of log L2-10keV(ergs s-1) and an X-ray hardness ratio (HR=(H-S)/(H+S), where H=1.5-6 keV and S=0.3-1.5 keV) of 0.50, consistent with obscured yet Compton-thin absorption. The stacked X-ray signal from the remaining 60% of the sample has a similar HR of 0.53, although its interpretation is dependent on a number of factors including the assumed underlying column density distribution, the intrinsic MIR/X-ray luminosity ratio, and most importantly, the assumed photon index of emission from star formation. Assuming a star-forming X-ray photon index () of 1.9, Fiore et al. [37] conclude that 94% of the X-ray non-detected, Jy IRBGs are heavily obscured, and likely Compton-thick, AGN. If a harder X-ray photon index of (as observed in the starburst-dominated ULIRGS of Franceschini et al. [38], Ptak et al. [82], and Teng et al. [95]) is assumed, however, the obscured AGN fraction of this moderate-luminosity sample falls significantly.
| ID | RA (J2000) | DEC (J2000) | aaOptical/NIR spectroscopic redshift from the literature | bbIRS-derived redshift (this work); see §4 | ccIRAC (3.6-8.0 m) and IRS (14-37 m) power-law slopes, where | ccIRAC (3.6-8.0 m) and IRS (14-37 m) power-law slopes, where | AGN%ddAGN contribution to the MIR (14-37 µm) flux density | eeStar-forming contribution to the observed 24 m flux, as determined by the spectral fit | ffOptical depth of best-fit AGN continuum at 9.7m (see §4) | ggRest-frame 6 µm luminosity of the AGN compononent (see §5.2) | |||
|---|---|---|---|---|---|---|---|---|---|---|---|---|---|
| IRBG1 | 03:31:46.6 | -27:45:53.0 | 1069 | 25.3 | 3961 | -1.92 | -2.08 | 96 2 | 41 | 0.0 | 45.6 | ||
| IRBG2 | 03:31:58.3 | -27:50:42.2 | 2.28 0.06 | 851 | 25.2 | 2934 | -1.86 | -2.43 | 94 5 | 99 | 0.5 | 45.6 | |
| IRBG3 | 03:32:10.5 | -28:01:09.2 | 1.62 0.02 | 751 | 25.1 | 2208 | -1.46 | -2.06 | 71 4 | 286 | 0.4 | 45.0 | |
| IRBG4 | 03:32:37.8 | -27:52:12.5 | 1.60 | 1066 | 24.8 | 2370 | -1.78 | -2.07 | 100 3 | 0 | 0.0 | 45.2 | |
| IRBG5 | 12:36:00.2 | 62:10:47.3 | 2.00 | 2.00 0.03 | 1144 | 24.0 | 1204 | -2.13 | -2.06 | 84 3 | 293 | 0.1 | 45.4 |
| IRBG6 | 12:36:35.6 | 62:14:23.9 | 2.02 | 2.040.004 | 1497 | 23.8 | 1426 | -2.00 | -2.04 | 85 1 | 351 | 0.0 | 45.6 |
| IRBG7 | 12:37:26.5 | 62:20:27.0 | 1.76 0.02 | 883 | 25.0 | 2324 | -2.21 | -1.81 | 72 hhIRS spectrum not fit by default model. See §4.1 for details. | 272 | 5.2 | 45.4 | |
| IRBG8 | 14:15:38.1 | 52:18:52.9 | 1217 | 24.9 | 2967 | -1.29 | 90 6 | 122 | 0.1 | 45.7 | |||
| IRBG9 | 14:16:35.4 | 52:12:35.2 | 2299 | 23.7 | 1999 | -2.53 | -1.92 | 92 4 | 327 | 0.2 | 45.9 | ||
| IRBG10 | 14:18:51.5 | 52:48:35.9 | 1.92 | 1.99 0.02 | 1686 | 24.0 | 1812 | -2.32 | 88 3 | 394 | 0.3 | 45.6 | |
| IRBG11 | 14:20:08.6 | 53:01:10.1 | 2.07 0.02 | 701 | 24.7 | 1491 | -1.94 | 92 9 | 57 | 5.0 | 45.5 | ||
| IRBG12 | 14:20:13.0 | 52:55:33.3 | 1.04 0.01 | 948 | 24.8 | 2106 | -2.64 | 78 3 | 218 | 0.1 | 44.3 | ||
| IRBG13 | 14:20:21.9 | 52:55:12.1 | 2.60 0.06 | 1786 | 24.1 | 2152 | -0.58 | 79 5 | 440 | 1.4 | 46.1 |
References. — Spectroscopic redshifts from Szokoly et al. [94, IRBG4], Swinbank et al. [92, IRBG5, IRBG6], and Davis et al. [26, IRBG10]
| ID | H05 | Y05 | W06 | D08 | F08 | G08 | P08 | L09 | PL |
|---|---|---|---|---|---|---|---|---|---|
| IRBG1 | x | x | x | x | x | x | |||
| IRBG2 | x | x | x | x | x | x | |||
| IRBG3 | x | x | x | x | |||||
| IRBG4 | x | x | x | x | x | x | x | ||
| IRBG5 | x | x | x | x | |||||
| IRBG6 | x | x | x | x | x | ||||
| IRBG7 | x | x | x | x | x | ||||
| IRBG8 | x | x | x | x | x | x | |||
| IRBG9 | x | x | x | x | x | ||||
| IRBG10 | x | x | |||||||
| IRBG11 | x | x | |||||||
| IRBG12 | x | x | x | x | x | ||||
| IRBG13 | x | x | x | x |
Note. — An ’x’ indicates that a source would be selected via the listed criteria and a ’’ indicates that a source lacked the neccessary data to determine if it would be selected.
To bridge the gap between these infrared and X-ray studies and therefore better constrain the luminosity, obscuration, and power sources of these cosmologically interesting AGN, we have obtained IRS spectra of a sample of IRBGs selected in deep X-ray fields with effective exposures of ks. Because we do not require that our targets be detected in the X-ray, however, we do not bias our sample towards the brightest or least-obscured galaxies [12, e.g.,]. The sample discussed below is therefore the first uniformly-selected sample of IRBGs with both deep X-ray and IRS coverage. Because they were selected from deep multiwavelength fields, many of the sources also have Hubble Space Telescope (HST) ACS imaging, enabling a morphological study of this unbiased sample and a comparison to sub-mm galaxies (SMGs), a population of star-forming galaxies proposed by some to be the merger-induced progenitors of luminous IRBGs [28, 79, 23, 69, 68, 13, e.g.,].
The paper is organized as follows. In §2, we discuss the sample selection, observations, and data reduction. The optical and infrared photometric properties of the sources are then examined in §3. In §4, we present the IRS spectra and discuss the AGN and star-forming contribution to the MIR emission of these sources. The X-ray emission is discussed in §5, as is the agreement between the X-ray and IR properties, and the star-formation rates of the sources are discussed in §6. In §7 we summarize the morphological properties of the IRBGs’ hosts and compare them to those of the SMGs. The discussion follows in §8, and we then summarize our conclusions in §9. Throughout the paper, we assume the following cosmology:(,)=(0.27, 0.73, 70.5 km s-1 Mpc-1), and quote all magnitudes in the AB system unless otherwise noted.
II. Sample Selection and Observations
To ensure deep X-ray coverage, we selected the IRBG sample from the Chandra Deep Fields North and South [1, 58, CDF-N, CDF-S, Ms;], the Extended Chandra Deep Field South [56, E-CDFS, ks;], and the Extended Groth Strip [53, EGS, ks;], the combined area of which is 0.96 deg2. We chose for IRS follow-up sources with extreme IR/optical flux ratios () typical of those in [49], [105], and [101, 102] based on the Spitzer MIPS 24 µm and optical photometry compiled in [73] and the UCM Extragalactic Database11 1 http://guaix.fis.ucm.es/pgperez/Proyectos/ucmcsdatabase.en.html. In addition, we required flux densities in excess of Jy to guarantee that IRS spectra could be obtained in a reasonable amount of time. The final sample is comprised of 13 IRBGs.
The 3 sources in the CDF-N were observed with IRS as part of programs 20456 (PI Chary) and 20733 (PI Urry), and the spectra of two (IRBG5 and IRBG7) can be found in Pope et al. [80] and Murphy et al. [67]. For the remaining 10 sources, we obtained 1st and 2nd order spectra with the IRS Long-Low (LL) module (program 30419, PI Rieke). Observation details are given in Table 1. The resulting wavelength range of 14-37 µm guarantees coverage of the 9.7 µm silicate absorption feature at and the 7.7 µm aromatic (hereafter polycyclic aromatic hydrocarbon (PAH)) feature at . Of the 13 sources in our sample, 4 have optical/NIR spectroscopic redshifts from the literature, placing them at [94, 92, 26].
II.1. Data Reduction
The IRS data were reduced using the IrsLow package developed by D. Fadda to accurately measure low-resolution spectra of faint, high redshift sources [see 34, for more details]. Briefly, this package corrects for residual background, rogue pixels (pixels with high dark current and/or photon responsivity), and cosmic rays, and takes into account all frames produced by the IRS/SSC pipeline. The background and noise images are produced by masking the target spectrum (and any serendipitous spectra) on each frame and then coadding the resulting frames. A biweight statistical estimator is then used iteratively and interactively to minimize the contamination from deviant pixels, and pixels that deviate by more than from the mean local value are flagged as rogue. After rejecting any cosmic ray events and taking the spectral distortion into account, the spectra are then weighted by the PSF, optimally extracted, and coadded to produce the final spectrum.
III. Optical/IR Photometric Properties
We list in Table 2 the optical and IR characteristics of the IRBGs. The 13 sources in our sample have 24 µm flux densities ranging from 701 to 2299 Jy (median Jy), R-band magnitudes ranging from 23.7 to 25.3 AB (median AB), and 24 µm to R-band flux ratios ranging from 1204 to 3961 (median ).
To place these sources in the context of recent studies, we also show in Table 3 the IR-excess selection criteria met by each of the 13 IRBGs. All sources meet the DOG (dust-obscured galaxy) criteria of Dey et al. [28, ≥ / f 24 f R 1000 , > f 24 0.3 mJy], and all but 2 meet one or more of the Houck et al. [49, > f 24 0.75 mJy, > R Vega 24.5 ], Yan et al. [105, log ≥ ( / ν f ν ( 24 µm ) ν f ν ( 8 µm ) ) 0.5 , log ≥ ( / ν f ν ( 24 µm ) ν f ν ( 0.7 µm ) ) 1.0 ], or Weedman et al. [101, > f 24 1.0 mJy, > R Vega 23.9 ], Weedman et al. [102, > f 24 1.0 mJy, > R Vega 23.9 ] selection criteria. Furthermore, nine sources meet the IR-excess criteria of Fiore et al. [36, ≥ / f 24 f R 1000 , ≥ ( - R K ) Vega 4.5 ] or Georgantopoulos et al. [41, ≥ / f 24 f R 1000 , > - R AB m 3.6 µm , AB 3.7 ], and eight meet the combined MIPS/IRAC criteria defined by [76] to select highly luminous and heavily obscured AGN.
III.1. SEDs
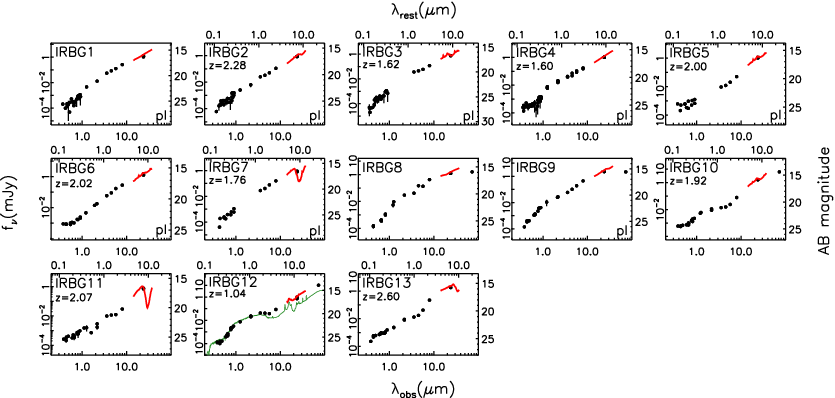
The broad-band (0.4-70µm) SEDs of the IRBGs are shown in Figure 1. We constructed the SEDs by first compiling aperture-matched photometric catalogs using the CDF-S data of Marzke et al. [62, R I z ], Vandame et al. [98, J K ], Arnouts et al. [6, U U p B V R I ], COMBO17 [104], Giavalisco et al. [43, b v i z J H K ], Le Fèvre et al. [55, I ], and GALEX (), the CDF-N data of Giavalisco et al. [43, bviz] and Capak et al. [16, UBVRIz’HK’], and the EGS data () of Villar et al. [100] and Barro et al. (2010), in preparation. For more details on the available datasets and the aperture-matching procedure, see [72, 73] and the UCM Extragalactic Database (see footnote 6).
While a handful of the source SEDs shown in Figure 1 display a weak stellar bump (the broad 1.6 µm feature that dominates the SEDs of star-forming galaxies and which tends to be correlated with the presence of PAH emission in IRBGs [27, e.g.]), the majority of the sources in our sample have power-law SEDs indicative of AGN activity. When we apply the IRAC (3.6-8.0 µm) power-law selection criteria used by [5] and [30] to identify AGN-dominated sources, we find that 7 of the 13 sources are indeed power-law AGN and one additional source (IRBG5) meets the criteria if we lower the required chi-squared probability from to [5, e.g.,]22 2 For consistency with the IRAC power-law selection in [5] and [30], we assume an IRAC flux calibration uncertainty of 10%.. Because the IRAC photometry of IRBG8 is questionable due to its position near the edge of the IRAC field, the total power-law fraction is , or . Our results are therefore in agreement with those of [28], who find that while only of IRBGs at Jy have power-law SEDs, the power-law fraction rises to at Jy (our flux cut) and to at Jy (the median flux density of our sample). Furthermore, all of the power-law sources in our sample are extremely red, with a mean slope of (where ), and are therefore strong AGN candidates regardless of redshift [30, 29, see].
III.2. Infrared colors
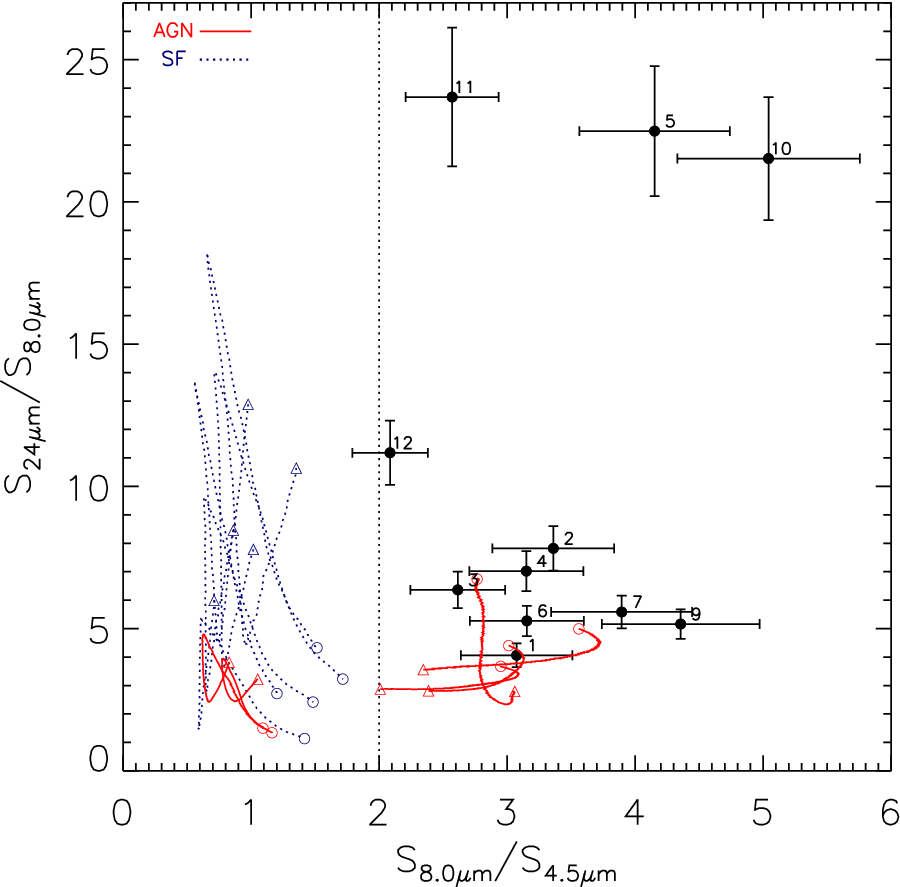
A number of infrared color-criteria have been used in the literature to discriminate between AGN and star-formation activity [29, for a review, see]. While the reliability and completeness of pure color/color cuts is heavily dependent on a source’s redshift, [79] find that for IRBGs (which typically lie at ), provides a convenient dividing line between star-formation–dominated () and AGN-dominated () emission [also see 23, who suggest an even lower cut of 1.65]. As a confirmation of this method, we plot in Figure 2 the expected colors of a number of AGN and star-forming galaxies. We find that only AGN fall redward of the cut, as expected, although we note that lower-luminosity AGN (e.g., Seyfert galaxies) as well as self-absorbed AGN [96] could display bluer colors more typical of star-forming galaxies. As shown in Figure 2, however, all of our IRBGs lie in the red AGN-dominated regime, with 3 sources showing a significantly higher ratio than the rest. [79] attribute this excess of 24 µm emission either to intrinsic obscuration indicative of AGN activity, which enhances the observed-frame 24 µm flux and/or obscures the observed-frame 8 µm flux, or to the 7.7 µm PAH feature passing into the MIPS 24µm band. We explore these possibilities further in §4.3.
IV. IR Spectra
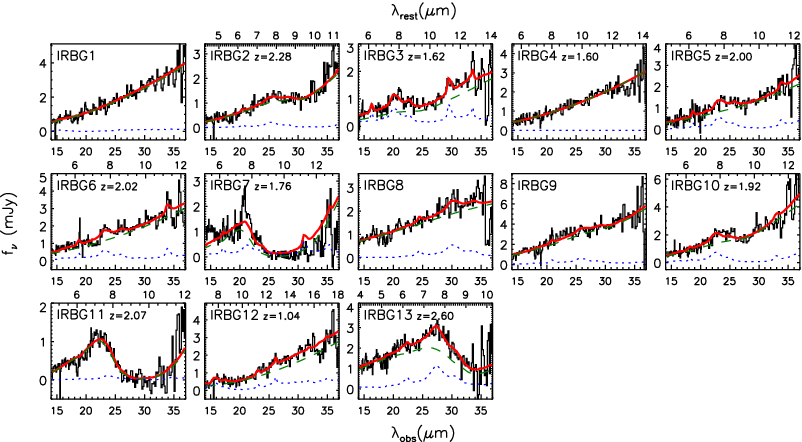
The IRS spectra of our 13 IRBGs are shown in Figure 3. To measure redshifts and determine the source of the emission (e.g., AGN or star-formation), we simultaneously fit a power-law continuum and a star-forming template to each spectrum. For the star-forming templates, we adopt the starburst, luminous infrared galaxy (LIRG), and ultraluminous infrared galaxy (ULIRG) templates of [84]. While we allow the power-law component to be reddened according to the extinction law of [32], in no case do we require additional reddening to be applied to the star-forming templates.
Using a chi-squared minimization routine, we then fit the spectrum while leaving the template normalizations, power-law index, power-law extinction, and redshift as free parameters. To protect against local minima, we varied the assigned starting values for the parameters, and chose the input values that produced the fit with the lowest reduced chi-squared (if more than one minimum was found). Finally, to place errors on the fit parameters, we created 1000 simulated spectra for each source (based on the measured spectra and their associated Gaussian errors) and re-ran our fitting program on each. The errors quoted below for the redshifts (§4.2) and AGN fractions (§4.3) are taken to be the standard deviations in the resulting distributions of fit values. This procedure produces reasonable spectral fits for all sources except IRBG7, discussed below, although for 4 objects the lack of spectral features prevented direct redshift constraints.
IV.1. IRBG7
IRBG7 has two spectral features and/or artifacts that impact the fit. The first is a sharp emission feature at µm, or assuming our best-fit redshift of (for comparison, Murphy et al. 67 measure a redshift of ). This feature, which can be seen in the raw spectral data, could be strong 7.65 µm [Ne VI] emission that is partially blended with the 7.7 µm PAH emission.
The second strange feature in this spectrum is the apparently blue continuum at µm, present in both our reduction of the IRS data as well as that of Pope et al. [80, A. Pope 2009, private communication] and [67]. If the AGN continuum fit is free to vary over all spectral indices, it therefore settles on a blue slope of (where ), despite its extremely red () IRAC power-law continuum. Such behavior, however, appears to be unphysical, for while the IRS slope need not match the IRAC slope, the two are generally close. In fact, the offset between the IRAC spectral slope () and the IRS spectral slope () for the 7 additional power-law galaxies in our sample ranges from 2% to 42%, with a mean (median) value of only 18% (16%).
We therefore adopt a revised method to fit the spectrum of IRBG7. First, we place an upper limit on the IRS AGN continuum slope by adjusting the measured IRAC slope of upwards (bluewards) by 18%, the mean offset between the IRAC power-law and IRS slopes. With this assumed AGN continuum of , we then perform an AGN-only fit at µm to determine the AGN extinction that best fits the profile of the 9.7 µm silicate absorption feature. We then set the normalization of the AGN continuum by extrapolating the IRAC continuum fit from 8 to 14 µm. When we do the same for the other power-law galaxies in the sample, we find that the mean offset between the predicted and observed 14 µm flux density is 35%. To place a lower limit on the AGN contribution, we therefore scale the AGN contribution downwards until the 14 µm AGN flux density is 35% lower than predicted by the IRAC extrapolation, while allowing the star-forming contribution to vary so as to give the lowest reduced chi-squared. The resulting fit under-predicts both the short-wavelength emission and the 21 µm emission peak, as expected, but now places a robust lower-limit on the AGN’s contribution to the MIR emission.
IV.2. Redshifts
Of the 13 sources in our sample, 4 have optical/NIR spectroscopic redshifts from the literature [94, 92, 26]. Using the IRS spectra, we determine reliable redshifts for an additional 6 sources, for an overall redshift completeness of . The IRS redshifts derived for 3 of the 4 sources with prior optical/NIR redshifts agree to within in all cases (The fourth source, IRBG4, has a power-law IRS spectrum from which no redshift estimate can be made).
Of the 3 remaining sources, two (IRBG1 and IRBG9) have power-law spectra and SEDs, and one (IRBG8) has both a spectrum dominated by power-law emission as well as questionable IRAC photometry due to its position near the edge of the IRAC field, thus preventing accurate spectroscopic or photometric redshift determination.
The mean and median redshifts of our sample, and , respectively, agree quite well with the typical redshifts of similar samples. For instance, both Weedman et al. [101] and Houck et al. [49] find median redshifts of , Yan et al. [105] finds a median redshift of , and Polletta et al. [76] finds a median redshift of .
Finally, with the exception of IRBG12, all of the sources lie at . The redshift of IRBG12, , is therefore quite low in comparison both to our and other [101, 49, 105, 76, e.g.,] samples of luminous IRBGs. This source’s low redshift, however, appears robust. The reduced chi-squared fit has 3 minima, one at , one at , and one at . As shown in Figure 1, however, this source has a weak 1.6 µm stellar bump that is well-fit at optical-NIR rest-frame wavelengths by the template of the starburst galaxy NGC 6090 from Polletta et al. [77]. We can therefore rule out the low and high redshift solutions from the IRS spectroscopy on the basis of the broad-band SED.
IV.3. Source of power: AGN activity or star-formation?
The fraction of the overall IRS (14-37 µm) dust-obscured flux density arising from the AGN power-law component (e.g., the AGN fraction), the best-fit power-law indices, and the optical depths at 9.7 µm (for the power-law component) are shown in Table 2. On the basis of their MIR (14-37 µm) emission, all of the IRBGs in our sample are AGN-dominated, with AGN fractions ranging from 71% to 100%. Six of the IRBGs are nearly pure power-laws with AGN fractions exceeding 90%, three have hints of PAH emission with AGN fractions between 80% and 90%, and the remaining four have noticeable contributions from PAH features with AGN fractions . For comparison, only 2 of the 13 SMGs from Pope et al. [80] and Murphy et al. [67] have similarly-derived AGN fractions exceeding 60%. One of these 2 sources is IRBG5 from our sample, and the other is an IRBG with a 24µm flux density that fell below our flux cut of 700 Jy (Jy).
As discussed above, the mean offset between the IRAC and IRS spectral slopes of the power-law galaxies is only 18%. Furthermore, none of the power-law AGN have IRAC and IRS slopes that differ by more than , indicating that the power-law emission seen at rest-frame wavelengths of µm continues up to µm, and possibly beyond, assuming a typical redshift of .
Recall, however, that 3 of the IRBGs in our sample (IRBG5, IRBG10, and IRBG11), have far-higher ratios of 24 µm to 8 µm flux than the rest (, see Figure 2), due either to extremely high levels of extinction extending into the NIR (at , the 2.7 µm rest-frame emission is redshifted into the observed 8 µm band) or to a contribution from the 7.7 µm PAH feature. The IRS spectra suggest that both of the above scenarios contribute to the enhanced 24 µm flux densities of IRBG5 and IRBG10. At redshifts of and , the 7.7 µm PAH feature, clearly visible in each of the spectra, serves to enhance the observed MIPS flux. However, star-formation is responsible for only of the 24 µm flux density in these two sources. Removal of the star-forming flux therefore lowers the observed 24 µm to 8 µm flux ratios, but only to values of 15.9 and 17.6, still well above the ratios seen for the remaining sources. The power-law continuum at an observed wavelength of 8 µm is therefore likely to be suppressed, although shorter-wavelength spectral data would be needed to verify this hypothesis.
The remaining source, IRBG11, differs from the others in that the AGN accounts for 92% of the MIR flux density, and no noticeable contribution from PAH emission is seen in the spectrum. In this case, the large 24 µm to 8 µm flux ratio most likely results from extreme MIR obscuration. Indeed, this source shows one of the largest 9.7 µm opacities in our sample, , corresponding to an of 92.5 if we assume the conversion of [32].
| ID | log aa Log of the rest-frame, non absorption-corrected 2-10 keV luminosity, calculated using the observed 0.5-2 keV flux, , and an assumed redshift of for those sources lacking redshift constraints. Errors are based on the uncertainties in the soft-band flux. | log bbEstimated using the observed flux ratio and an intrinsic photon index of | log cc Log of the rest-frame, absorption-corrected 2-10 keV luminosity | ||||
|---|---|---|---|---|---|---|---|
| (s) | (ergs s-1 cm-2) | (ergs s-1 cm-2) | (ergs s-1 cm-2) | (cm-2) | (ergs s-1) | (ergs s-1) | |
| IRBG1 | 4.30E+05 | 8.52E-16 | 5.05E-15 | 6.29E-15 | 43.6 | 23.4 | 44.3 |
| IRBG2 | 1.57E+06 | 2.86E-15 | 7.50E-15 | 1.06E-14 | 44.2 | 23.0 | 44.6 |
| IRBG3 | 2.23E+05 | 7.07E-17 | 1.37E-15 dd Low-significance X-ray detections: (IRBG3, 0.5-8 keV) = 4.8; (IRBG3, 2-8 keV) = 5.5; (IRBG9, 0.5-8 keV) = 2.1 | 6.53E-16 dd Low-significance X-ray detections: (IRBG3, 0.5-8 keV) = 4.8; (IRBG3, 2-8 keV) = 5.5; (IRBG9, 0.5-8 keV) = 2.1 | 42.3 | 23.6 | 43.6 |
| IRBG4 | 1.67E+06 | 5.58E-15 | 7.42E-15 | 1.30E-14 | 44.2 | 22.0 | 44.2 |
| IRBG5 | 1.65E+06 | 4.00E-17 | 3.26E-16 | 2.06E-16 | 42.3 | ||
| IRBG6 | 1.92E+06 | 2.07E-16 | 2.48E-15 | 2.52E-15 | 43.0 | 23.6 | 44.0 |
| IRBG7 | 1.41E+06 | 1.52E-16 | 1.32E-15 | 1.40E-15 | 42.7 | 23.4 | 43.6 |
| IRBG8 | 7.16E+07 eeUnits of s cm2, nominal exposure time is 200 ks | 4.28E-15 | 1.04E-14 | 1.47E-14 | 44.3 | 22.8 | 44.6 |
| IRBG9 | 4.86E+07 eeUnits of s cm2, nominal exposure time is 200 ks | 1.86E-16 | 1.10E-15 | 5.39E-16 dd Low-significance X-ray detections: (IRBG3, 0.5-8 keV) = 4.8; (IRBG3, 2-8 keV) = 5.5; (IRBG9, 0.5-8 keV) = 2.1 | 42.9 | ||
| IRBG10 | 5.10E+07 eeUnits of s cm2, nominal exposure time is 200 ks | 1.86E-16 | 4.85E-16 | 5.11E-16 | 42.9 | 22.8 | 43.2 |
| IRBG11 | 5.78E+07 eeUnits of s cm2, nominal exposure time is 200 ks | 6.64E-17 | 8.63E-17 | 1.53E-16 | 42.5 | ||
| IRBG12 | 7.34E+07 eeUnits of s cm2, nominal exposure time is 200 ks | 1.74E-16 | 7.76E-16 | 6.49E-16 | 42.3 | ||
| IRBG13 | 7.47E+07 eeUnits of s cm2, nominal exposure time is 200 ks | 1.24E-16 | 7.95E-16 | 4.93E-16 | 43.0 |
V. X-ray Properties
As discussed in the introduction, the study of luminous IRBGs has suffered thus far from a relative lack of sensitive X-ray coverage in the fields where these sources have traditionally been identified (e.g. the Spitzer First-Look Survey, the NOAO Deep Wide Field Survey, and the SWIRE survey). As such, the X-ray analysis of IRBGs has lagged behind their study in the infrared, and to date, no studies have obtained both IRS spectra and deep X-ray imaging of a statistically significant sample of IRBGs selected independently of their X-ray properties. The deep X-ray coverage and complete IRS sampling of our uniformly-selected IRBGs will therefore help to bridge the gap between prior X-ray and MIR spectral studies of these sources.
V.1. X-ray Detection Fraction
The X-ray data for the CDF-N, CDF-S, E-CDFS-S, and EGS come from [1], [58], [56], and [53], respectively. At the position of the 13 IRBGs, the X-ray exposures range from ks to Ms, with a mean value of ks. Only 7 of the 13 IRBGs (), however, are formally detected in the X-ray (e.g., are detected to high enough significance to be included in published X-ray catalogs). Their X-ray fluxes in the full (0.5-8 keV), hard (2-8 keV), and soft (0.5-2 keV) X-ray bands are given in Table 4. For sources in the EGS, we scale the published 0.5-10 keV and 2-10 keV fluxes to the bands defined above assuming an observed photon index of [61, 39, 46, the observed photon index of the typical obscured AGN, and thus of the X-ray background, in this energy range, e.g.,].
For the 6 sources not detected in the catalogs listed above, we searched for faint X-ray counterparts using the procedure outlined in [31]. Briefly, we first calculated the appropriate 60%, 70%, and 80% encircled energy radii (EER) for each source by exposure-weighting the EER, as measured using the lookup tables of [53], for each individual Chandra observation. After measuring the source counts in each of the three apertures, we measured sky counts in 10,000 randomly-placed apertures of the same size that (1) did not intersect the source aperture, that (2) lie within 1′ of the source position, and that (3) did not contain a known X-ray source. In addition, we corrected the counts in each sky aperture to reflect the exposure time measured for the source, and only allowed sky apertures in which the exposure differs from the source exposure by no more than 15%. We then fit a Poisson distribution to the resulting distribution of sky counts to determine the significance of any source detection, and chose the EER that maximized the source signal.
Of the 6 formally X-ray non-detected sources, IRBG3 is detected in both the full and hard bands to 4.8 and 5.5 above the sky, respectively, and IRBG9 is marginally detected in the full band, but only to above the sky. The remaining 4 sources remain undetected in all bands, although 1 (IRBG5) lies too close to a known X-ray source to test for very faint X-ray emission. We place conservative upper limits on the flux of each X-ray–undetected source by adding any positive source counts to a upper limit on the measured sky background in the 70% EER, assuming the typical observed X-ray photon index of an obscured AGN, .
V.2. X-ray Obscuration
For the 8 IRBGs with a formal or weak detection in the hard and/or soft X-ray bands, we crudely estimate the intrinsic column density using the hard to soft X-ray flux ratios, the measured redshifts (or for sources lacking a secure redshift measurement), and an assumed intrinsic (e.g., unabsorbed) X-ray photon index of [42, e.g.,]. This method, commonly used to estimate the column densities of faint X-ray sources lacking sufficient counts for spectral fitting, is necessarily approximate in nature as it assumes an X-ray spectrum represented by a single absorbed power-law and neglects the potential effects of more complicated spectral components such as the soft X-ray excess and/or Compton reflection. Nonetheless, column densities estimated in this way are broadly consistent with those determined via X-ray spectral fitting [74, see, for example, Appendix B of]. For instance, the column density we estimate for IRBG6, log (cm-2)= 23.6, is in good agreement with the spectrally-derived value of [2], log (cm-2).
The column density estimates are given in Table 4. To place measurement errors on the columns, we take into account both the errors in the hard and soft X-ray flux, as well as the uncertainty on the redshift. For those sources lacking a secure redshift measurement, the redshift error is taken to be the standard deviation in the redshift distribution for the full sample of IRBGs, . Of the 8 sources for which X-ray–based estimates could be made, 7 are formally obscured with log (cm-2) and 1 has an upper limit consistent with significant obscuration (log (cm-2)).
From their infrared properties, we know that all of our sample contain strong AGN. To place crude column density estimates on the X-ray–non-detected IRBGs, and to obtain independent estimates for the X-ray–detected sources, we follow [4] and [54] and explore the observed relationship between an AGN’s rest-frame X-ray and MIR luminosity [59, e.g.,]. The position of our IRBGs in MIR/X-ray color space is shown in Figure 4, where the rest-frame 6 µm luminosities () have been estimated using the best-fit AGN contribution to the IRS spectra (which directly sample the rest-frame 6 µm emission at ) and the rest-frame 2-10 keV luminosities have been estimated using the observed soft band flux (0.5-2 keV at , 1.5-6 keV at ) and an assumed observed photon index of , typical of obscured AGN. The shaded region in Figure 4 gives the intrinsic observed relation for local AGN [59] and the solid line gives the intrinsic luminosity-dependent relation of [60], who drew their AGN sample from both low () and high () redshifts33 3 We assume the average IRS spectral slope of our sample, , to convert the [60] relation, initially defined at 6.7 µm, to 6.0 µm.. As shown, the average absorption-corrected (e.g. intrinsic) luminosity ratio of the 6 sources in our sample with crude X-ray–derived column density estimates is consistent with the [60] relation. The effect of various obscuring columns on the observed relation of [60] is shown by dashed lines, where we again assume an intrinsic photon index of . We also assume for simplicity that the 6 µm emission from the torus is isotropic, i.e. that it does not depend on the obscuring column or on the angle at which the AGN/torus is viewed. If the torus is optically thick at MIR wavelengths [75, 45, 14, e.g.], however, an obscured AGN would fall to both lower X-ray and lower MIR fluxes, thus increasing somewhat the column density estimated via this method.
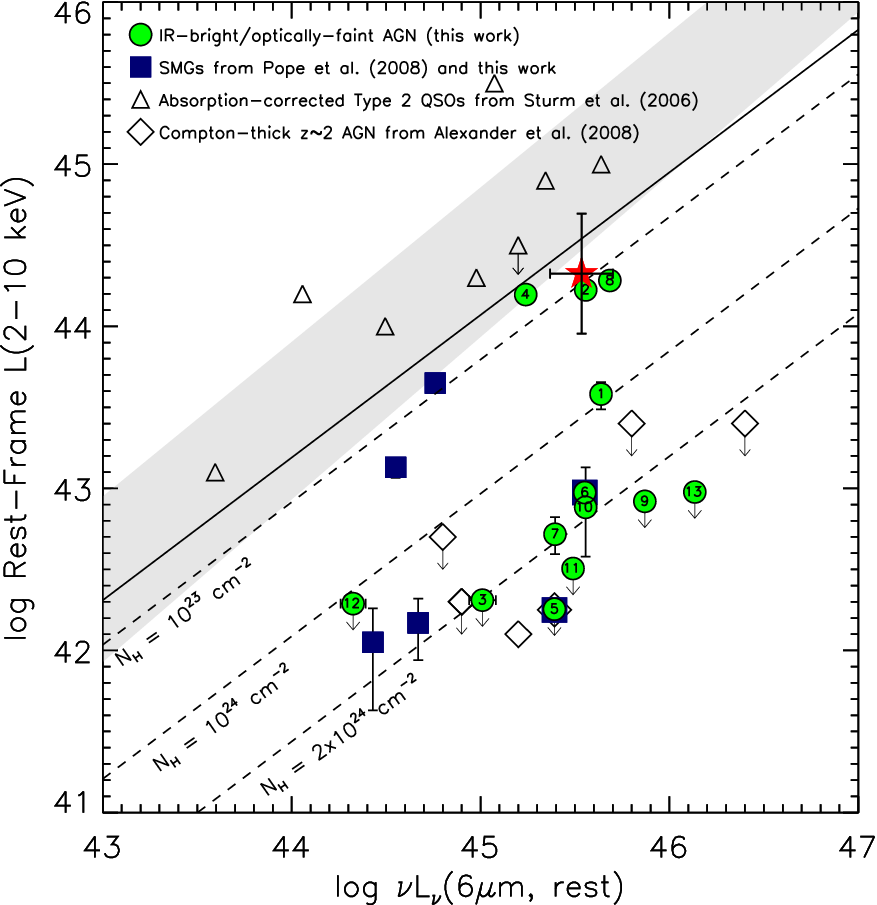
For comparison, we also show the absorption-corrected colors of the Type 2 QSOs from [90], all of which fall in or above the [59] region, and the observed colors of the Compton-thick AGN from [4], all of which fall below the cm-2 relation44 4 The source SMM J123600+621047 from [4] corresponds to source IRBG5 in this work. Because of the slightly different procedures used to estimate the rest-frame X-ray and IR luminosities, however, our calculated values of log L2-10keV(ergs s-1) ergs s-1 and log (ergs s-1) differ slightly from those in [4]: log L2-10keV(ergs s-1) and log (ergs s-1). For consistency, we plot the [4] source using the values measured here.. Furthermore, we also plot the observed colors of the six SMGs with a well-measured MIR AGN contribution from either Pope et al. [80, C1, C3, GN04, GN06, GN07] or this work (both IRBG5, which corresponds to source C1 in [80], and IRBG6 are SMGs). For the [80] sources, we estimate the intrinsic 6µm luminosity using their Fig. 3 for which they performed spectral fitting similar to that described in §4. X-ray flux measurements were taken from [1] when available (C1 and GN04), and were calculated as described in §5.1 otherwise. Of the 6 SMGs, three (IRBG6, C3, GN04) are detected in the X-ray to high significance, two (GN06 and GN07) are weakly-detected at 6.2 and 3.3 above the background, respectively, and one (C1/IRBG5) remains X-ray undetected.
As shown in Figure 4, three of our 13 sources (IRBG2, IRBG4, and IRBG8) appear to be obscured yet Compton-thin ( cm-2); the remaining 10 lie near or above the Compton-thick boundary ( cm-2). This high fraction of Compton-thick candidates () is significantly larger than that found by Lanzuisi et al. [54, 18%] thanks to the far deeper X-ray data (200 ks to 2 Ms compared to ks). Furthermore, there is at least rough agreement between the column densities estimated above and those estimated here. For instance, of the 3 sources with X-ray/MIR luminosity ratios indicative of column densities of log (cm-2) , all have X-ray–derived column densities of log (cm-2) . Of the remaining three sources with X-ray–derived column densities (IRBG1, IRBG6, and IRBG7), two are identified as Compton-thick candidates in Figure 4 and one (IRBG1) has an estimated column that falls just short of log (cm-2) . While their X-ray–derived columns (log (cm-2) ) place them just outside the Compton-thick regime, column densities based on low S/N flux ratios are often unable to distinguish Compton-thick AGN from their most heavily-obscured, yet Compton-thin, counterparts [4, see, for example, Figure 3 of]. On the basis of the X-ray and X-ray/MIR–derived column densities, we therefore conclude that all of the sources in our sample are likely to be X-ray obscured (log (cm-2)), and as many as 10 () may be Compton-thick. Furthermore, at least 5 of these sources () lie at predicted column densities of cm-2, and are therefore strong Compton-thick candidates.
One of these strong Compton-thick candidates, IRBG5, was previously identified as a potential Compton-thick quasar by both [4] and Georgantopoulos et al. [40] and is also one of the SMGs plotted in Figure 4. Its heavily obscured nature, however, is not unique among the sample of SMGs with measurable AGN contributions in the MIR. In fact, 4 of the 6 SMGs plotted in Figure 4 () are Compton-thick candidates. Our results are therefore in agreement with those of [2], who found that 80% of SMGs containing X-ray–detected AGN are likely to be heavily obscured (log (cm-2) ) and potentially Compton-thick. This similarity between the column density distributions of the IRBG and SMG samples underscores the potential relationship between these two classes of objects, discussed in more detail in §7 and §8.
V.3. X-ray Luminosity
The observed and absorption-corrected X-ray luminosities of the IRBGs are given in Table 4. The mean, non-absorption-corrected 2-10 keV rest-frame luminosity of the 7 sources with soft-band detections (calculated as described in §5.2) is log (ergs s-1), which rises to log (ergs s-1) when we apply the absorption corrections to the 6 sources with X-ray–derived measurements.
As discussed in §5.2, an AGN’s intrinsic X-ray luminosity can also be estimated from its rest-frame 6 µm luminosity (see Figure 4). This technique has the added advantage that it can be applied to all of the sources in the sample, regardless of whether they are formally detected in the X-ray. Assuming a redshift of for the 3 sources lacking redshift estimates, we find a mean intrinsic 2-10 keV luminosity of log (ergs s-1) for the 13 sources in our sample. This value is only slightly higher than the estimate made above for the sources with X-ray–derived column density estimates (log (ergs s-1)), as would be expected if the flux ratio method underestimates the column densities of the most heavily obscured sources. Furthermore, Figure 4 suggests that essentially all of the sources in our sample (with the exception of IRBG12, whose redshift is only ) have intrinsic X-ray luminosities that lie above the canonical division between low-luminosity Seyfert galaxies and high-luminosity QSOs, log (ergs s-1). The IRBGs in our sample are therefore Type 2 QSOs, at least from the X-ray perspective.
V.4. Correlation between X-ray and IR Properties
All three of the sources in our sample that are optically-thick at 9.7 µm () are Compton-thick candidates with MIR/X-ray–estimated column densities of cm-2. The seven additional Compton-thick candidates, however, display little to no silicate absorption (). While it is possible that the 3 sources lacking solid redshift estimates (1 of which is a Compton-thick candidate) could have a silicate feature redshifted out of the observable band (), the highest confirmed redshift in our sample is that of IRBG13, , a source with a prominent absorption feature. Given the average sample redshift of and the low frequency of silicate absorption among the sources in our sample with confirmed redshifts, it therefore seems unlikely that the three sources lacking redshift information (and observable silicate features) lie at and have significant silicate absorption.
It therefore appears clear that while silicate absorption is more likely amongst heavily X-ray–obscured IRBGs, strong silicate absorption need not accompany X-ray obscuration. A similar conclusion was drawn by [12] for a sample of luminous ( mJy) IRBGs in the NOAO Deep Wide-Field Survey, as well as [91], who show that bright ( mJy) X-ray–selected Type 2 AGN can show unabsorbed power-law continua in the IR despite heavy obscuration in the X-ray. This apparent discrepancy between X-ray and MIR measures of obscuration could be due to an additional component of absorbing material that blocks the X-ray, but not the IR, emission region [89, e.g.,]. Alternatively, it could result from the filling-in of the silicate feature by an additional component of extended hot dust that lies beyond the obscuring torus, arising, for example, from the ionization cones as in NGC 1068, the prototypical Compton-thick AGN in the local Universe [63, 33].
VI. Star-formation Rates
For the 7 IRBGs with detectable PAH emission (i.e. AGN fractions ), we place limits on the star-formation rates (SFRs) using (1) the star-forming contribution to the observed-frame 24 µm emission (in lieu of direct estimates based on the weakly-detected PAH emission features) and (2) the observed radio emission.
VI.1. 24 µm emission
To measure the 24 µm flux density arising from star-formation alone, we convolve the star-formation component of our IRS fit with the MIPS 24 µm passband. We find that in the sources with detectable PAH emission, of the total 24 µm flux density can be attributed to star-formation. We then use the redshift-dependent scaling relation of [84] to convert the observed MIR flux to a SFR, assuming the median sample redshift of for those sources lacking secure redshift estimates [84, for further details, see]. With the exceptions of IRBG13, whose anomalously high SFR estimate of yr-1 will be discussed below, and IRBG12, whose estimated SFR is yr-1, the resulting SFRs range from yr-1. No meaningful constraints can be placed on the SFRs of those sources with AGN contributions in excess of 90% (SFR yr-1).
These estimates, however, are based on a relationship derived from local starburst, LIRG, and ULIRG templates. At high-redshift, luminous star-forming galaxies exhibit strong PAH features typical of less-luminous local galaxies, due perhaps to extended star-formation or lower metallicity [86, 70, 80, 85, 35, 67, 66, e.g.,]. Local templates are therefore likely to overestimate the intrinsic 24 µm flux (and therefore the SFR) of high-z ULIRGS significantly at , the typical luminosities of luminous IRBGs [84, 97, see]. Additional uncertainties in the derived SFRs arise from the lack of luminous ULIRGS in the local Universe from which to calibrate the SFR relation. The IR-derived SFRs of the IRBGs should therefore be taken as rough upper limits on the true SFRs.
VI.2. Radio emission
To place an independent constraint on the SFRs, we therefore consider the 1.4 GHz radio flux density. Of the 7 IRBGs with detectable PAH emission, 6 have radio counterparts in the catalogs of [83], [51], or [52]. Assuming a radio spectral index of , where , we K-correct the observed radio flux and use the relation of [84] to estimate the SFR. With the exception of IRBG13, whose radio-derived SFR falls just short of the IR-derived SFR, the radio SFRs exceed the IR SFRs by factors of , suggesting that a significant fraction of the radio flux density comes not from star-formation, but from AGN activity. Therefore, the radio-derived SFRs again represent only an upper limit on the true star-formation activity.
To isolate the star-forming contribution to the radio emission, we therefore turn to the radio-infrared correlation, characterized by the parameter log. By using this correlation together with the measured star-forming contribution to the 24 µm flux density to calculate the star-forming radio flux density and then the SFR, we again utilize the MIR emission as a proxy for the SFR. This method, however, allows us to calibrate the SFR using the observed radio/SFR correlation in place of the 24µm/SFR correlation discussed above.
A number of different studies have attempted to quantify and have returned values ranging from 0.52 [8] to 1.39 [10]. Here, we adopt the luminosity-dependent relation of [84] which is based on the local IRAS bright galaxy sample (BGS) and for which log at log . At log , the typical total infrared luminosity of luminous IRBGs [97], .
The observed value of also varies with redshift as the IR spectral features pass through the 24 µm band. To correct for this variation, we adopt the observed redshift evolution of [50], who found that . Not surprisingly, this observed redshift evolution is reproduced by the log templates of [84]. After scaling the [50] relationship upwards to match the [84] result at , we used the resulting correlation and our estimate of the star-forming 24 µm flux density to determine the expected radio emission from star-formation.
We find that star-formation accounts for 3% - 23% of the total radio emission in our sources. Again with the exceptions of IRBG12 and IRBG13, whose estimated SFRs are and , respectively, we derive SFRs of using the star-formation-dominated radio emission. Because the high-z ULIRGS/HyperLIRGS in our sample are likely to have star-forming emission similar to that of local LIRGS/ULIRGS (see §6.1), however, the true intrinsic value of is likely to be lower than the value assumed above. The estimated SFRs can be therefore be taken as lower-limits, subject of course to the intrinsic scatter in the radio/IR correlation.
VI.3. The high SFRs of luminous IR-bright/optically-faint galaxies
To summarize, 5 of the 7 IRBGs in our sample with detectable PAH emission and/or radio counterparts have estimated SFRs in the range of to . The SFR of IRBG12 () is lower than the others because of its significantly lower redshift (). The SFR of IRBG13, however, is anomalously high: . This overestimation likely stems from the fact that both an AGN+SF fit and an AGN-only fit reasonably reproduce the IRS spectrum ( = 0.79 and 0.85, respectively). While potential AGN-only fits likewise exist for many of the sources in our sample, IRBG13 has the smallest offset in the reduced values of the AGN+SF and AGN-only fits and is therefore the source for which the origin of the IR emission is most uncertain.
The SFRs derived above are clearly approximate in nature. Nevertheless, two of the 7 sources examined above (IRBG5 and IRBG6) are known SMGs, heavily dust-enshrouded sources with typical SFRs of [2, 92]. As their IR properties are typical of the rest of our sample, it therefore seems likely that our estimated SFRs of reasonably approximate the high level of star formation present in luminous IRBGs. Furthermore, our estimated SFRs are in agreement with the results of [97], who find via far-infrared measurements that approximately a third of IRBGs similar to those selected here have indications of star formation at a level that produces a substantial fraction of their bolometric luminosities, which are typically 1013 L⊙ [97]. Finally, such SFRs are also in agreement with the predictions of [68], who find that luminous IRBGs are best modeled by gas rich mergers undergoing rapid AGN growth and/or star-formation at rates of yr-1.
Presumably, the objects with detected star formation represent the high end of a continuous luminosity function, where the lower levels of star formation are masked by the AGN outputs. That is, it is likely that these sources are in general characterized by star formation in the high-LIRG to ULIRG range, even though their MIR (14-37 µm) luminosities are AGN-dominated.
VII. Host Galaxy Morphologies
Because of the overlap of IRBG and SMG samples, as well as their similar redshift distributions, surface densities, and clustering properties, several authors have suggested that luminous IRBGs may evolve from SMGs [28, 79, 13, 15, 69, 68, e.g.,]. Furthermore, early studies of SMGs suggested that may be in the early stages of a major merger [21], although, on the basis of asymmetry measurements alone, more recent work has suggested that SMGs are no more likely to be undergoing major mergers than lower-luminosity high-redshift galaxies [93]. While this work has called into question the uniqueness of the role that mergers play in these systems, the merger-driven origin of both SMGs and luminous IRBGs is supported by the gadget2 simulations of [69, 68], who find that both samples naturally arise from gas-rich mergers, with SMGs representing the early, star-formation dominated phase of the merger, and IRBGs representing the later phase of final coalescence in which star-formation and obscured black hole growth both proceed at rapid rates (see Figure 1 in Hopkins et al. 47). If this scenario is correct, luminous IRBGs should therefore exhibit signs of recent merger activity, although one might expect them to be more dynamically relaxed than their SMG predecessors.
VII.1. Comparison between IRBGs and SMGs
Previous morphological studies of IRBGs have used targeted HST and Keck AO observations in the Bootes Field of the NOAO Deep Wide-Field Survey to (1) measure their typical sizes and shapes via Sersic fitting and GALFIT galaxy decomposition and to (2) characterize their morphologies on the basis of the Gini, , and concentration indices [15, 65]. They conclude that IRBGs are preferentially found in disk-like galaxies, and only show multiple resolved components indicative of ongoing mergers, far lower than the interaction rate found for the average ULIRG and the merger rate estimated for SMGs [21, 25, 15, 65]. However, IRBGs do appear to have smaller projected sizes () than SMGs (), suggesting that they may in fact represent a later, more relaxed phase of a major merger [15].
To expand upon these studies and further test whether IRBGs are the product of major-mergers, we directly compare below the morphologies of IRBGs and SMGs in a self-consistent manner. Because IRBG5 and IRBG6 are confirmed SMGs, we treat these two sources separately in the analysis below. We also note that because the EGS does not yet contain deep sub-mm coverage, it is possible that one or more of the EGS IRBGs could also be SMGs. [79], however, found an SMG fraction of only 30% amongst luminous IRBGs. As the fraction of SMGs in our sample of 8 IRBGs with deep ACS coverage is already , we therefore expect little to no additional contamination by SMGs in our morphological sample.
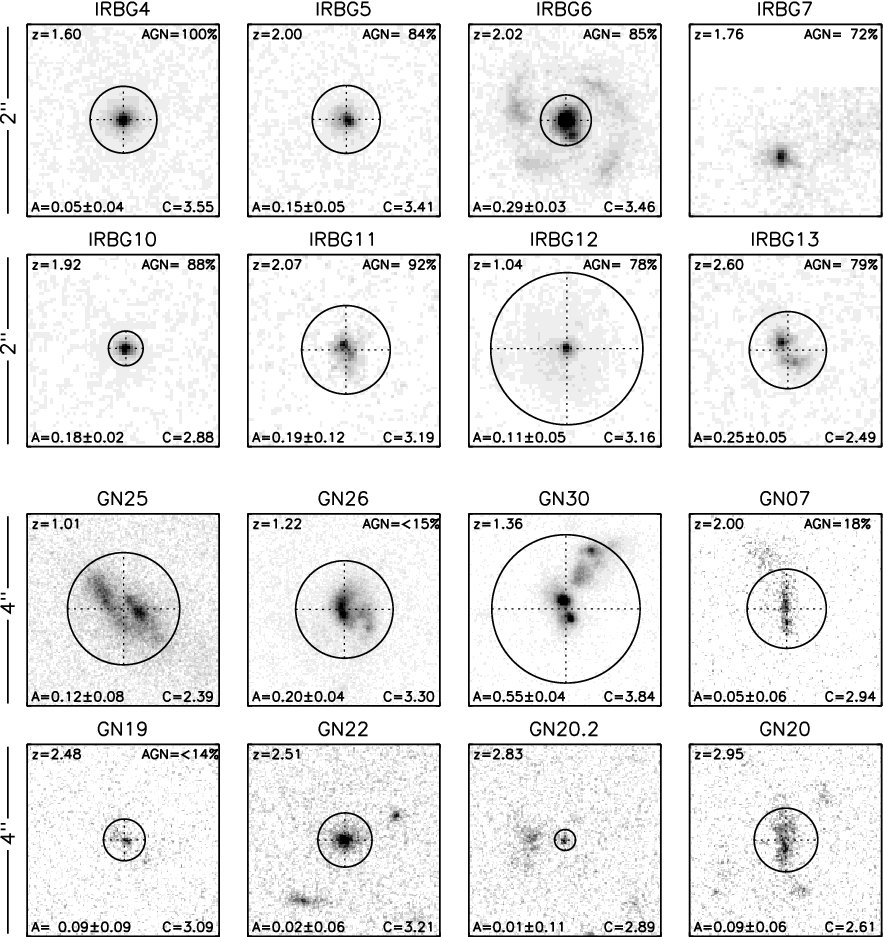
We select as a comparison sample of SMGs those sources in the GOODS-N field [78] with redshifts and apparent magnitudes consistent with those of the IRBGs: and , and confirm that none are also IRBGs (although GN25 has a high of ; Cowie et al. 24, Pope et al. 81). The observed-frame -band images of the 8 IRBGs and 8 SMGs with deep ACS imaging from GOODS or the EGS are shown in Figure 5.
VII.1.1 Merger Fraction
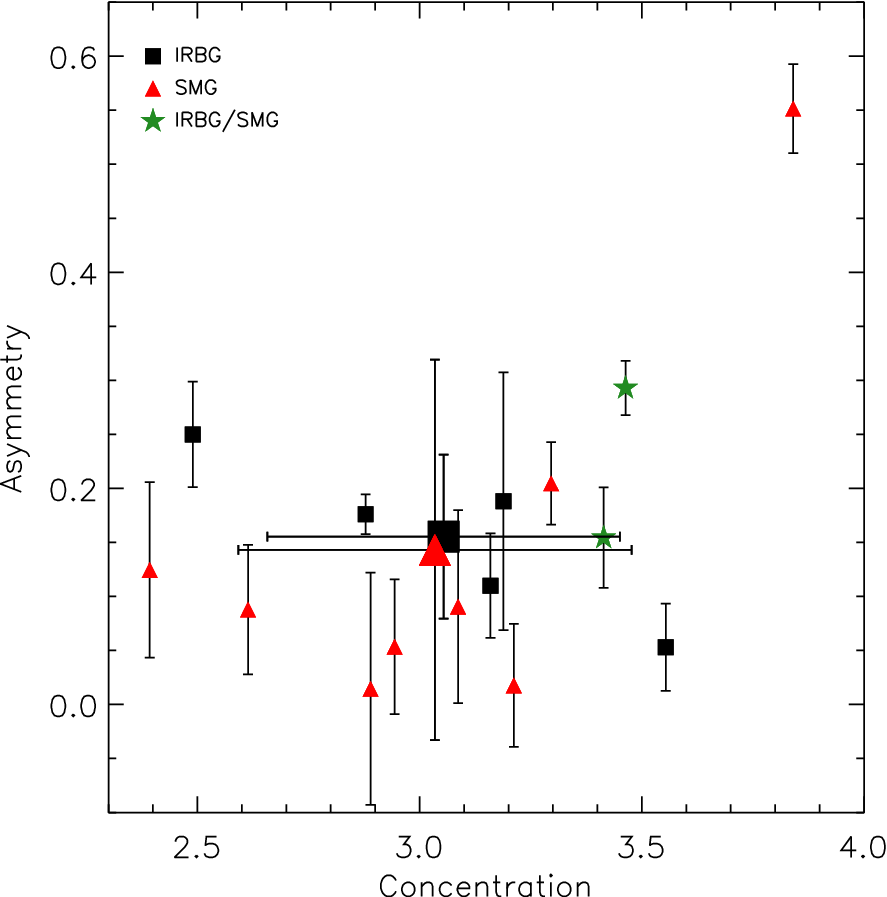
To quantitatively compare the morphologies of these two samples, we calculate the Petrosian radii and concentration and asymmetry indices using the approach of Conselice et al. [19] and the error-estimation method of Shi et al. [88], and confirm excellent agreement between our measured parameters and those of Shi et al. [88] for the two sources that lie in both samples: IRBG5 and IRBG6 (Y. Shi 2009, private communication).
Of these parameters, the asymmetry index is the most relevant as it tends to be high ( in the local Universe) when merging galaxies are undergoing either their first pass or their final coalescence [18, 57]. We caution, however, that this index is designed to measure the asymmetry within the Petrosian radius () of the primary source. If the merging galaxies are separated by a large distance (as occurs, for example, during the merger stages between first pass and final coalescence), the secondary source will fall outside of the Petrosian radius of the primary source and the index will be low. Furthermore, surface brightness dimming causes the observed asymmetry to decrease with increasing redshift. While the correction for this effect is somewhat uncertain, [20] estimate an offset of between and for irregular galaxies. As the [88] error method results in measured asymmetries 0.05 lower than those found by the minimum error method of Conselice et al. [19], we therefore adopt a merger index of for our sample55 5 We note that [88] find a slope () between and that is twice that of [20] when using local LIRGs as input. It therefore remains possible that galaxies in our sample with are undergoing mergers as well..
The measured concentration and asymmetry indices are shown in Figure 6. By these measures alone, the IRBGs and SMGs appear to have similar morphologies. Furthermore, all of the sources with clear double nuclei have , as expected. Several SMGs, however, do indeed have nearby counterparts that lie outside the Petrosian radius of the primary source. If we therefore count as mergers all sources with either or nearby counterparts that fall outside (e.g. GN22,GN20.2,GN20), we find that 5 of the 7 () IRBGs and 5 of the 8 () SMGs are merger candidates.
It is also worth noting that two of the three IRBGs which are optically thick at 9.7 µm (IRBG11 and IRBG13) are strong merger candidates with large asymmetries and clearly disturbed morphologies. The third, IRBG7, falls too near the edge of the ACS image to accurately calculate the asymmetry. Nonetheless, it appears to lie at the edge of a large patch of diffuse emission, potentially due to an ongoing merger (see Figure 5). As discussed in §5.4, these three optically-thick sources are the only Compton-thick candidates with strong silicate absorption. It therefore appears plausible that ongoing mergers are at least partially responsible for the high degree of MIR obscuration in these heavily X-ray–obscured IRBGs. In their sample of local ULIRGs, Veilleux et al. [99] similarly find that the depth of the 9.7 µm silicate feature is generally largest during the close pre-merger and merger stages. They caution, however, that this correlation suffers from a large degree of scatter, likely due to variations in both the initial conditions (e.g., the structure, surface mass density, and gas fractions of the infalling galaxies) and specific characteristics (e.g., orbital geometry and mass ratio) of the mergers themselves. This scatter may explain why the three remaining merger candidates (IRBG5, IRBG6, and IRBG10) show little to no MIR obscuration ().
VII.1.2 Physical Size
While a majority of both SMGs and IRBGs appear to be sufficiently disturbed to be classified as major mergers, these two samples do appear to differ in their physical size, as inferred by [15]. A histogram of the Petrosian radii in physical units of kpc is shown in Figure 7. The mean of the SMGs, kpc, is nearly twice that of the IRBGs, kpc. If we exclude the 3 lowest-redshift SMGs with , the mean of the SMGs drops to kpc, suggesting that the apparent offset in physical size may be driven at least in part by evolution in the SMG population. Swinbank et al. [93], however, detect no significant size evolution in either the optical or NIR radii of a sample of 25 SMGs. Furthermore, they find a mean optical (NIR) Petrosian radius of kpc ( kpc) for their SMG sample, consistent with our results and again a factor of 2 higher than observed for the IRBGs.
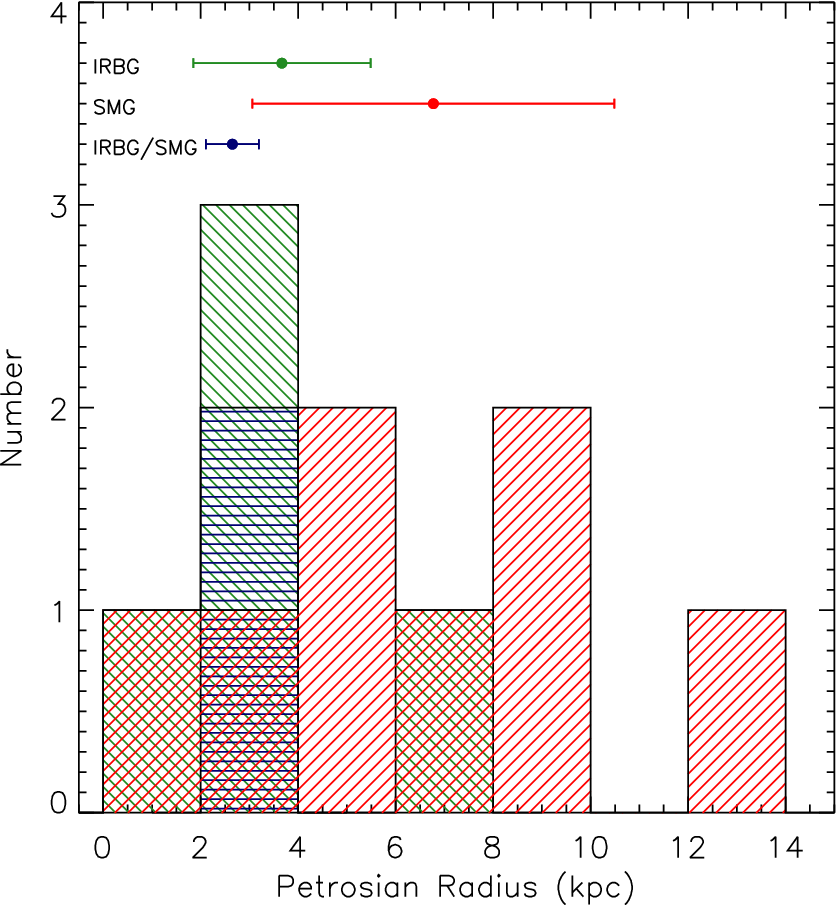
This apparent offset in size may be a natural byproduct of the merger hypothesis, as the Petrosian radius of a merger remnant peaks strongly during both the first pass and the final merger stages and can easily obtain a value twice that of the pre-merger, maximal separation (when only one galaxy is contained within the Petrosian radius), and post-merger stages [57, J. Lotz 2009, private communication]. An offset in of a factor of is therefore consistent with the hypothesis that SMGs are observed in the first stages of a major merger whereas IRBGs represent a post-merger phase following the final coalescence. What remains more difficult to explain, however, are the simultaneously large asymmetries and small radii of the IRBGs, as these two parameters should both peak at approximately the same stages during the merger. Larger samples of such sources are clearly needed to resolve this apparent discrepancy.
VIII. Discussion
Several authors have suggested that IRBGs and SMGs may be evolutionarily related, each representing a different phase in the major-merger scenario originally proposed by Sanders et al. [87] [28, 79, 23, 69, 68, 13, e.g.]. To test this hypothesis, we explore below the agreement between the properties of the IRBG and SMG samples, as measured here and in the literature, and the major-merger model.
The major-merger (e.g., 3:1 or greater mass ratio) scenario, as presented by Hopkins et al. [47], proceeds as follows. During the merging galaxys’ first pass, star-formation activity begins to increase with concurrent AGN activity occurring only under certain orbital geometries and/or when the host galaxys’ discs are particularly unstable. As the galaxies undergo final coalescence, however, massive inflows power both strong starburst activity and heavily-obscured, yet rapid, black hole growth. Eventually, feedback from the black hole and from supernovae disperse the remaining gas in a brief “blowout” phase characterized by a dust-obscured, yet Type 1, AGN. Finally, when the gas and dust have been fully dispersed, the source appears as an unobscured quasar (unless viewed through the canonical torus). The general picture is therefore one in which a major-merger fuels both star-formation and black hole growth (thus leading to the observed relation), with star-formation dominating at early times, and AGN activity at later times.
Before continuing, it is worth noting that this model is almost certainly an oversimplification. As emphasized by Veilleux et al. [99], the internal structure of the merging galaxies, the orbital parameters (e.g., prograde or retrograde), the mass ratio, and sub-resolution physics will ultimately determine the evolutionary path followed by any one merging galaxy pair, leading to variations on the model presented above and scatter in the observed correlations. Nonetheless, the general picture presented above should hold on average if this process is responsible for the SMG and IRBG phenomena.
In the context of this model, SMGs are assumed to represent the early, star-formation dominated phase of the major merger, and IRBGs the later, AGN-dominated phase. To first order, this progression is supported by the fact that while of SMGs are star-formation dominated in the MIR [80, 44, 23], and nearly all luminous IRBGs are AGN-dominated in the MIR, there is an overlap in the SMG and IRBG populations, at least for samples extending down to Jy [79]. Furthermore, the SMGs that also meet the IRBG criterion tend have the largest AGN contributions, and are therefore likely candidates to be undergoing a transition from star-formation to AGN dominance [79, 23, e.g.,].
In addition, while SMGs tend to be star-formation-dominated in the MIR, 28-50% host obscured AGN [2, also see Figure 4] as predicted for the subset of mergers with initial conditions and orbits conducive to early (obscured) black hole growth. Furthermore, at least 30-40% of luminous IRBGs have ULIRG-level SFRs [97, this work]. As rapid star-formation is predicted throughout the obscured AGN phase of a major merger, this too is consistent with the major merger scenario.
This general picture is also supported by the work of Alexander et al. [3], Dey et al. [28], and Brodwin et al. [13]. For instance, Alexander et al. [3] find that black hole growth in SMGs lags behind the growth of the host galaxy, contrary to what is seen in high-redshift optical (e.g., unobscured) and radio-selected samples of quasars [71, 64, e.g.,]. This finding suggests that SMGs are at an earlier evolutionary stage than their unobscured, AGN-dominated counterparts, again in agreement with the merger scenario. More generally, Dey et al. [28] find that the surface densities and redshift distributions of Jy IRBGs [79, at least of which are likely to be AGN-dominated in the MIR,] are comparable to those of luminous SMGs [17, 22, mJy,]. Similarly, [13] analyze the clustering properties of IRBGs and find that Jy IRBGs have a correlation length comparable to that of SMGs [9]. The most luminous ( Jy) IRBGs, however, may be more strongly clustered, and thus lie in richer environments, than both their lower MIR-luminosity counterparts and the typical SMG.
While no one of these arguments confirms the potential merger origin for SMGs or IRBGs, collectively, the results suggest that the merger scenario first proposed by Sanders et al. [87] may provide an acceptable explanation for the properties of these two samples. Ideally, one might hope to either confirm or reject this hypothesis on the basis of the observed morphologies. Unfortunately, however, the morphological properties of these samples remain amongst their most uncertain characteristics. As discussed in §7.1, the asymmetry measure, commonly used as a merger indicator in the local Universe, suffers at high redshift from surface brightness dimming, a effect, and is insensitive to intermediate merger stages in which the galaxies lie at large separations. When using this measure alone, Swinbank et al. [93] therefore conclude that SMGs are no more likely to appear as mergers than a bolometrically less luminous sample of high redshift star-forming galaxies. Optical (e.g., -band) measurements of this and other objective morphology indicators are also complicated by the fact that at , the observed-frame optical emission probes the the rest-frame UV emission, which tends to be more strongly clumped. However, when morphologies of AGN-dominated IRBGs are measured at longer wavelengths, the contribution from the unresolved AGN emission, now less obscured, can likewise bias the results [15, 65].
Prior studies of IRBG morphology have therefore turned to the fraction of multiple resolved components as a measure of ongoing mergers, and have found a rate of only for IRBGs [15, 65], far lower than is seen in local and high redshift samples of ULIRGs. However, this measure too is biased, and will not identify sources in the latest stages of a merger. We therefore chose to combine the asymmetry and near-neighbor/multiple-component methods, and conclude that the majority of both SMGs and IRBGs are likely to be undergoing mergers. Furthermore, the smaller physical size of the IRBGs, a trend first noted by Bussmann et al. [15] and confirmed in §7.1.2, suggests that they are likely in a later, more relaxed merger stage, a hypothesis also supported by the AGN and star-forming characteristics presented above. Clearly, however, one would like to confirm this finding using a far larger, deeper, and higher-resolution sample, one that will be provided by the upcoming CANDELS (Cosmic Assembly Near-IR Deep Extragalactic Legacy Survey) Hubble WFC3 NIR imaging survey of the GOODS, COSMOS, EGS, and UDS fields.
IX. Summary
In summary, we present the X-ray, star-forming, and morphological properties of a sample of luminous ( Jy) IR-bright/optically-faint galaxies (IRBGs, ) selected in deep X-ray fields. Our major findings are as follows:
- •
The infrared colors and IRS spectra confirm that all of the Jy IRBGs are AGN-dominated.
- •
All of the sources appear to be X-ray obscured, and 4 remain X-ray non-detected despite deep X-ray coverage. As many as are strong Compton-thick candidates, and more appear to lie near the Compton-thick/heavily obscured (NH = 1024 cm-2) boundary.
- •
The mean intrinsic X-ray luminosity of the sample is log (ergs s-1), and all but one source has a MIR-derived intrinsic X-ray luminosity in excess of log (ergs s-1), the canonical dividing line between Seyfert galaxies and QSOs. These sources are therefore Type-2 QSOs from the X-ray perspective.
- •
In general, the sources with the largest X-ray obscuration are those most likely to exhibit strong silicate absorption. Furthermore, at least two of the three IRBGs that are optically thick at 9.7 µm are likely to be undergoing mergers. However, silicate absorption need not accompany X-ray obscuration, and merger candidates are observed that lack strong silicate features.
- •
30-40% of IRBGs have star formation rates in the ULIRG range; presumably the rest of the sample also has relatively high levels of star formation that are masked by the AGN outputs.
- •
As many as of the IRBGs in our sample show asymmetries indicative of mergers, similar to the incidence of mergers in SMGs at similar redshift. However, the IR-bright/optically faint sources tend to be more compact than the SMGs, suggesting that they may be in a later stage of merging.
- •
These characteristics are consistent with the proposal that these objects represent a later evolutionary stage following soon after the star-formation-dominated one represented by the SMGs.
References
- [1] Alexander, D. M., et al. 2003, AJ, 126, 539
- [2] Alexander, D. M., Bauer, F. E., Chapman, S. C., Smail, I., Blain, A. W., Brandt, W. N., & Ivison, R. J. 2005, ApJ, 632, 736
- [3] Alexander, D. M., et al. 2008a, AJ, 135, 1968
- [4] —. 2008b, ApJ, 687, 835
- [5] Alonso-Herrero, A., et al. 2006, ApJ, 640, 167
- [6] Arnouts, S., Vandame, B., Benoist, C., Groenewegen, M. A. T., da Costa, L., Schirmer, M., Mignani, R. P., & Slijkhuis, R. 2002, VizieR Online Data Catalog, 337, 90740
- [7] Assef, R. J., et al. 2008, ApJ, 676, 286
- [8] Beswick, R. J., Muxlow, T. W. B., Thrall, H., Richards, A. M. S., & Garrington, S. T. 2008, MNRAS, 385, 1143
- [9] Blain, A. W., Chapman, S. C., Smail, I., & Ivison, R. 2004, ApJ, 611, 725
- [10] Boyle, B. J., Cornwell, T. J., Middelberg, E., Norris, R. P., Appleton, P. N., & Smail, I. 2007, MNRAS, 376, 1182
- [11] Brand, K., et al. 2007, ApJ, 663, 204
- [12] —. 2008, ApJ, 680, 119
- [13] Brodwin, M., et al. 2008, ApJ, 687, L65
- [14] Buchanan, C. L., Gallimore, J. F., O’Dea, C. P., Baum, S. A., Axon, D. J., Robinson, A., Elitzur, M., & Elvis, M. 2006, AJ, 132, 401
- [15] Bussmann, R. S., et al. 2009, ApJ, 693, 750
- [16] Capak, P., et al. 2004, AJ, 127, 180
- [17] Chapman, S. C., Blain, A. W., Smail, I., & Ivison, R. J. 2005, ApJ, 622, 772
- [18] Conselice, C. J., Bershady, M. A., Dickinson, M., & Papovich, C. 2003a, AJ, 126, 1183
- [19] Conselice, C. J., Bershady, M. A., & Jangren, A. 2000, ApJ, 529, 886
- [20] Conselice, C. J., Blackburne, J. A., & Papovich, C. 2005, ApJ, 620, 564
- [21] Conselice, C. J., Chapman, S. C., & Windhorst, R. A. 2003b, ApJ, 596, L5
- [22] Coppin, K., et al. 2006, MNRAS, 372, 1621
- [23] —. 2010, ArXiv e-prints
- [24] Cowie, L. L., Barger, A. J., Hu, E. M., Capak, P., & Songaila, A. 2004, AJ, 127, 3137
- [25] Dasyra, K. M., Yan, L., Helou, G., Surace, J., Sajina, A., & Colbert, J. 2008, ApJ, 680, 232
- [26] Davis, M., et al. 2007, ApJ, 660, L1
- [27] Desai, V., et al. 2009, ApJ, 700, 1190
- [28] Dey, A., et al. 2008, ApJ, 677, 943
- [29] Donley, J. L., Rieke, G. H., Pérez-González, P. G., & Barro, G. 2008, ApJ, 687, 111
- [30] Donley, J. L., Rieke, G. H., Pérez-González, P. G., Rigby, J. R., & Alonso-Herrero, A. 2007, ApJ, 660, 167
- [31] Donley, J. L., Rieke, G. H., Rigby, J. R., & Pérez-González, P. G. 2005, ApJ, 634, 169
- [32] Draine, B. T. 2003, ARA&A, 41, 241
- [33] Efstathiou, A., Hough, J. H., & Young, S. 1995, MNRAS, 277, 1134
- [34] Fadda, D., et al. 2010, ApJ, submitted
- [35] Farrah, D., et al. 2008, ApJ, 677, 957
- [36] Fiore, F., et al. 2008, ApJ, 672, 94
- [37] —. 2009, ApJ, 693, 447
- [38] Franceschini, A., et al. 2003, MNRAS, 343, 1181
- [39] Gendreau, K. C., et al. 1995, PASJ, 47, L5
- [40] Georgantopoulos, I., Akylas, A., Georgakakis, A., & Rowan-Robinson, M. 2009, A&A, 507, 747
- [41] Georgantopoulos, I., Georgakakis, A., Rowan-Robinson, M., & Rovilos, E. 2008, A&A, 484, 671
- [42] George, I. M., Turner, T. J., Yaqoob, T., Netzer, H., Laor, A., Mushotzky, R. F., Nandra, K., & Takahashi, T. 2000, ApJ, 531, 52
- [43] Giavalisco, M., et al. 2004, ApJ, 600, L93
- [44] Hainline, L. J., Blain, A. W., Smail, I., Frayer, D. T., Chapman, S. C., Ivison, R. J., & Alexander, D. M. 2009, ApJ, 699, 1610
- [45] Heckman, T. M. 1995, ApJ, 446, 101
- [46] Hickox, R. C., & Markevitch, M. 2006, ApJ, 645, 95
- [47] Hopkins, P. F., Hernquist, L., Cox, T. J., & Kereš, D. 2008, ApJS, 175, 356
- [48] Houck, J. R., et al. 2004, ApJS, 154, 18
- [49] —. 2005, ApJ, 622, L105
- [50] Ibar, E., et al. 2008, MNRAS, 386, 953
- [51] Ivison, R. J., et al. 2007, ApJ, 660, L77
- [52] Kellermann, K. I., Fomalont, E. B., Mainieri, V., Padovani, P., Rosati, P., Shaver, P., Tozzi, P., & Miller, N. 2008, ApJS, 179, 71
- [53] Laird, E. S., et al. 2009, ApJS, 180, 102
- [54] Lanzuisi, G., Piconcelli, E., Fiore, F., Feruglio, C., Vignali, C., Salvato, M., & Gruppioni, C. 2009, ArXiv e-prints
- [55] Le Fèvre, O., et al. 2004, A&A, 417, 839
- [56] Lehmer, B. D., et al. 2005, ApJS, 161, 21
- [57] Lotz, J. M., Jonsson, P., Cox, T. J., & Primack, J. R. 2008, MNRAS, 391, 1137
- [58] Luo, B., et al. 2008, ApJS, 179, 19
- [59] Lutz, D., Maiolino, R., Spoon, H. W. W., & Moorwood, A. F. M. 2004, A&A, 418, 465
- [60] Maiolino, R., Shemmer, O., Imanishi, M., Netzer, H., Oliva, E., Lutz, D., & Sturm, E. 2007, A&A, 468, 979
- [61] Marshall, F. E., Boldt, E. A., Holt, S. S., Miller, R. B., Mushotzky, R. F., Rose, L. A., Rothschild, R. E., & Serlemitsos, P. J. 1980, ApJ, 235, 4
- [62] Marzke, R., et al. 1999, in Astronomical Society of the Pacific Conference Series, Vol. 191, Photometric Redshifts and the Detection of High Redshift Galaxies, ed. R. Weymann, L. Storrie-Lombardi, M. Sawicki, & R. Brunner, 148–+
- [63] Mason, R. E., Geballe, T. R., Packham, C., Levenson, N. A., Elitzur, M., Fisher, R. S., & Perlman, E. 2006, ApJ, 640, 612
- [64] McLure, R. J., Jarvis, M. J., Targett, T. A., Dunlop, J. S., & Best, P. N. 2006, MNRAS, 368, 1395
- [65] Melbourne, J., et al. 2009, AJ, 137, 4854
- [66] Menéndez-Delmestre, K., et al. 2009, ApJ, 699, 667
- [67] Murphy, E. J., Chary, R., Alexander, D. M., Dickinson, M., Magnelli, B., Morrison, G., Pope, A., & Teplitz, H. I. 2009, ApJ, 698, 1380
- [68] Narayanan, D., et al. 2009a, ArXiv e-prints
- [69] Narayanan, D., Hayward, C. C., Cox, T. J., Hernquist, L., Jonsson, P., Younger, J. D., & Groves, B. 2009b, MNRAS, 1712
- [70] Papovich, C., et al. 2007, ApJ, 668, 45
- [71] Peng, C. Y., Impey, C. D., Rix, H., Kochanek, C. S., Keeton, C. R., Falco, E. E., Lehár, J., & McLeod, B. A. 2006, ApJ, 649, 616
- [72] Pérez-González, P. G., et al. 2005, ApJ, 630, 82
- [73] —. 2008, ApJ, 675, 234
- [74] Perola, G. C., et al. 2004, A&A, 421, 491
- [75] Pier, E. A., & Krolik, J. H. 1992, ApJ, 401, 99
- [76] Polletta, M., Weedman, D., Hönig, S., Lonsdale, C. J., Smith, H. E., & Houck, J. 2008, ApJ, 675, 960
- [77] Polletta, M. d. C., et al. 2006, ApJ, 642, 673
- [78] Pope, A., Borys, C., Scott, D., Conselice, C., Dickinson, M., & Mobasher, B. 2005, MNRAS, 358, 149
- [79] Pope, A., et al. 2008a, ApJ, 689, 127
- [80] —. 2008b, ApJ, 675, 1171
- [81] —. 2006, MNRAS, 370, 1185
- [82] Ptak, A., Heckman, T., Levenson, N. A., Weaver, K., & Strickland, D. 2003, ApJ, 592, 782
- [83] Richards, E. A. 2000, ApJ, 533, 611
- [84] Rieke, G. H., Alonso-Herrero, A., Weiner, B. J., Pérez-González, P. G., Blaylock, M., Donley, J. L., & Marcillac, D. 2009, ApJ, 692, 556
- [85] Rigby, J. R., et al. 2008, ApJ, 675, 262
- [86] Sajina, A., Yan, L., Armus, L., Choi, P., Fadda, D., Helou, G., & Spoon, H. 2007, ApJ, 664, 713
- [87] Sanders, D. B., Soifer, B. T., Elias, J. H., Madore, B. F., Matthews, K., Neugebauer, G., & Scoville, N. Z. 1988, ApJ, 325, 74
- [88] Shi, Y., Rieke, G., Lotz, J., & Perez-Gonzalez, P. G. 2009, ApJ, 697, 1764
- [89] Shi, Y., et al. 2006, ApJ, 653, 127
- [90] Sturm, E., Hasinger, G., Lehmann, I., Mainieri, V., Genzel, R., Lehnert, M. D., Lutz, D., & Tacconi, L. J. 2006, ApJ, 642, 81
- [91] Sturm, E., et al. 2005, ApJ, 629, L21
- [92] Swinbank, A. M., Smail, I., Chapman, S. C., Blain, A. W., Ivison, R. J., & Keel, W. C. 2004, ApJ, 617, 64
- [93] Swinbank, A. M., et al. 2010, MNRAS, 412
- [94] Szokoly, G. P., et al. 2004, ApJS, 155, 271
- [95] Teng, S. H., Wilson, A. S., Veilleux, S., Young, A. J., Sanders, D. B., & Nagar, N. M. 2005, ApJ, 633, 664
- [96] Treister, E., et al. 2009, ApJ, 706, 535
- [97] Tyler, K. D., et al. 2009, ApJ, 691, 1846
- [98] Vandame, B., et al. 2001, ArXiv Astrophysics e-prints
- [99] Veilleux, S., et al. 2009, ApJS, 182, 628
- [100] Villar, V., Gallego, J., Pérez-González, P. G., Pascual, S., Noeske, K., Koo, D. C., Barro, G., & Zamorano, J. 2008, ApJ, 677, 169
- [101] Weedman, D. W., Le Floc’h, E., Higdon, S. J. U., Higdon, J. L., & Houck, J. R. 2006a, ApJ, 638, 613
- [102] Weedman, D. W., et al. 2006b, ApJ, 651, 101
- [103] Werner, M. W., et al. 2004, ApJS, 154, 1
- [104] Wolf, C., et al. 2004, A&A, 421, 913
- [105] Yan, L., et al. 2005, ApJ, 628, 604