Halo Globular Clusters Observed with
AAOmega:
Dark Matter Content, Metallicity and Tidal Heating
Abstract
Globular clusters have proven to be essential to our understanding of many important astrophysical phenomena. Here we analyse spectroscopic observations of ten Halo globular clusters to determine their dark matter content, their tidal heating by the Galactic disc and halo, describe their metallicities and the likelihood that Newtonian dynamics explain their kinematics. We analyse a large number of members in all clusters, allowing us to address all these issues together, and we have included NGC 288 and M30 to overlap with previous studies. We find that any flattening of the velocity dispersion profiles in the outer regions of our clusters can be explained by tidal heating. We also find that all our GCs have M/L, therefore, we infer the observed dynamics do not require dark matter, or a modification of gravity. We suggest that the lack of tidal heating signatures in distant clusters indicates the Halo is not triaxial. The isothermal rotations of each cluster are measured, with M4 and NGC 288 exhibiting rotation at a level of km s-1 and km s-1, respectively. We also indirectly measure the tidal radius of NGC 6752, determining a more realistic figure for this cluster than current literature values. Lastly, an unresolved and intriguing puzzle is uncovered with regard to the cooling of the outer regions of all ten clusters.
Keywords:
gravitation - Galaxy: globular clusters: individual - stellar dynamics1 Introduction
Globular clusters (GCs) are often used as tracers of the gravitational potentials of galaxies and galaxy clusters (Kissler-Patig et al., 1999; Côté et al., 2003; Wu & Tremaine, 2006; Quercellini et al., 2008; Gebhardt & Thomas, 2009, e.g.). Although this has been applied to theoretical Galactic potentials (Allen et al., 2006, e.g.), the actual Milky Way (MW) potential has not yet been analysed in this way. The tidal forces of spiral galaxies are thought to be strongest near the disc because the concentrated mass in that region (gas and stars) has a larger density gradient than the more slowly varying density of the dark matter (DM) halo. Interestingly, many distant MW objects such as GCs and dwarf galaxies are known to be tidally stripped, despite being far enough from the Disc that they should not directly interact with it. For example, NGC 7492 is kpc further from the Galactic centre than the most distant detection of the Monoceros Ring, an object on the very outskirts of the Disc (Conn et al., 2007, kpc;), and exhibits clear evidence of tidal interaction with the Galaxy Lee et al. (2004). In this paper we consider 10 GCs at varying Galactocentric and Planar distances, allowing the inference of properties of the potential of the MW for the first time, by looking for signatures of tidal heating in these clusters.
Many globular clusters exhibit internal accelerations below m s-2, the level at which either modified gravity (Milgrom, 1983, e.g. MOND;) or dark matter is required to reconcile the observed kinematics of elliptical galaxies with theory. Near the tidal radius () it is likely that most stars in GCs feel accelerations below this level, making them an ideal testing ground for low-acceleration gravity (Sollima & Nipoti, 2010, and references therein). Furthermore, if all GCs exhibit similar behaviour, Galactic influences can not be the primary cause. In this final paper in the series [see also Lane et al. 2009 (hereafter Paper I) and Lane et al. 2010a (hereafter Paper II)], we present the velocity dispersions and mass-to-light profiles of four GCs, namely M4, M12, NGC 288 (chosen for comparison with earlier studies) and NGC 6752, bringing the total for this project to 10. This sample allows statistically significant conclusions to be made on the dark matter content of Halo GCs, and on whether a modification of gravity is required to reconcile their internal kinematics with Newtonian gravitational theory.
Our sample of GCs contains three close to the Galaxy (M55, M12 and M22), four at intermediate distances (NGC 6752, M4, M30 and 47 Tuc) and three that are distant (M68, NGC 288 and M53). We define ‘close’ to be kpc, ‘intermediate’ as kpc, and ‘distant’ to be kpc, following Harris (1996). NGC 288 was chosen, in part, because it is one of the GCs analysed by Scarpa et al. (2007b) who found it to have a flat velocity dispersion profile, similar to that of Low Surface Brightness galaxies which are thought to be DM dominated through to their cores. Our targets were then analysed in separate studies (Papers I and II and the current paper) ensuring a mix of nearby, intermediate and distant GCs to ensure any Galactic influences, if any, would be clearly observed. See Table 1 for the estimated acceleration, due to the cluster, of the most distant cluster member for all ten clusters analysed in this project. Note that the three distant clusters all experience accelerations due to the Galaxy of .
2 Data Acquisition and Reduction
We used AAOmega, a double-beam, multi-object spectrograph on the 3.9m Anglo-Australian Telescope (AAT) at Siding Spring Observatory in New South Wales, Australia, to obtain the data for this survey. AAOmega covers a two-degree field of view, and is capable of obtaining spectra for 392 individual objects over this field. We used 30 sky fibres used for optimal sky subtraction, and 5–8 fibres for guiding. The positional information for our targets was taken from the 2MASS Point Source Catalogue (Skrutskie et al., 2006) which has an accuracy of .
Observations of M4 were performed on February 15–17, 2008, with seeing. The data for M12 were taken over two observing runs: 7 nights on August 12–18 2006, and a further 8 nights on August 30 – September 6 2007, both with mean seeing of . NGC 288 was observed during the 2006 run and NGC 6752 during the 2007 run. For all observations we used the 2500V grating in the blue arm, resulting in spectra between and with . In the red arm we used the 1700D grating, which is optimized for the CaII IR triplet region. The red spectra cover , with . This setup returns the highest spectral resolution available with AAOmega, and is suitable for measuring stellar radial velocities. We selected targets for this campaign by matching the colour and magnitude range of the red giant branch (RGB) of each cluster. To minimize scattered-light cross-talk between fibres, each configuration was limited to 3 magnitudes in range.
We obtained 718, 2826, 1223 and 3664 spectra in the M4, M12, NGC 288 and NGC 6752 fields, respectively. Flat-field and arc-lamp exposures were used to ensure accurate data reduction and wavelength calibration. Data reduction was performed with the 2dfdr pipeline11 1 http://www2.aao.gov.au/twiki/bin/view/Main/CookBook2dfdr, which was specifically developed for AAOmega data. We checked the efficacy of the pipeline with a comparison of individual stellar spectra.
Radial velocities and atmospheric parameters were obtained through an iterative process, taking the best fits to synthetic spectra from the library by Munari et al. (2005), degraded to the resolution of AAOmega, and cross-correlating this model with the observed spectra to calculate the radial velocity [a process very similar to that used by the Radial Velocity Experiment (Steinmetz et al., 2006; Zwitter et al., 2008, RAVE;) project]. We used the same spectral library as the RAVE studies; this process is outlined in detail by Kiss et al. (2007).
2.1 Cluster Membership
We determined cluster membership using four parameters: the equivalent width of the calcium triplet lines, surface gravity, radial velocity and metallicity ([m/H]). Stars matching all criteria were judged to be members. Only stars having and were selected for NGC 6752 and M12, respectively, ensuring the majority of Galactic contaminants were removed before further selection criteria were applied. This probably removed some genuine cluster members but was necessary to ensure our sample was as free from Galactic field stars as possible.
For several clusters studied in 33, a cutoff of K was necessary to remove hot horizontal branch (HB) stars. These have radial velocities with large uncertainties due to the calcium triplet in very hot stars being replaced by hydrogen Paschen lines. No cuts were made on for any of the current clusters because no stars with K (for M4), K (for M12), K (for NGC 288) or K (for NGC 6752) remained after our selection process. In total, 200, 242, 133 and 437 stars were found to be members of M4, M12, NGC 288 and NGC 6752, respectively. Figure 1 shows the relative locations of the observed stars and highlights those found to be members. Note that 19 stars in the M4 field were found to be members of the globular cluster NGC 6144. For M4, we find that 88.0% of the selected members fall within within of selection parameters and 100% within . For M12 these values are: 94.2% and 100%, for NGC 288: 89.5% and 100% and for NGC 6752: 97.5% and 100%. Based on this we see no statistical reason to think there is significant Galactic contamination in our final samples.


3 Results
3.1 Tidal Radius of NGC 6752
The tidal radius of NGC 6752 in the Harris (1996) catalogue is (shown as the large thick circle in the right panel of Figure 1), however, this GC is known to have a collapsed core (Rubenstein & Bailyn, 1997, e.g.) and Harris (1996) warns against using tidal radii calculated from core parameters for such GCs. The most distant of our selected members throughout this project have, generally, been very close to the tidal radius. NGC 6752 is a clear outlier, with members only found to within of the value of quoted by Harris (1996). Therefore, we propose an updated value of for NGC 6752 based on our membership selections. Note that M30 and 47 Tuc were not used to determine for NGC 6752 because of a paucity of stars observed in M30, and because stars were found out to the edge of the field of view of AAOmega for 47 Tuc.
Based on the membership selections of the remaining 7 clusters, the tidal radius is located % of the distance to the most distant member from the cluster centre. Our most distant member for NGC 6752 is located at pc, or , therefore, . The quoted uncertainty is based only on the standard deviation of the distance between the outermost member and the tidal radii of our clusters, so the true uncertainty in the value of is likely to be much greater than this. The large thin circle in the right hand panel of Figure 1 represents our derived value for . It should be stressed that this value is not a robust measure of but we suggest it is a more realistic value than that in the Harris (1996) catalogue.
3.2 Metallicity
Our metallicity ([Fe/H]) calibration method, discussed in detail in 34, was used to determine the metallicities of each cluster. Briefly, the magnitude of the Tip of the Red Giant Branch () was subtracted from the magnitudes of each star and plotted against the equivalent width of the calcium triplet lines to give a distance independent measure of luminosity. For M4, the value was taken from a versus Colour Magnitude Diagram based on 2MASS data within of the cluster centre (), for M12 from Paust (2006) (), for NGC 288 from Davidge & Harris (1997) and Valenti et al. (2004) (), and for NGC 6752 from Valenti et al. (2004) (). Linear fits to these data, combined with plotting [Fe/H] values vs for 47 Tuc and M55 ([Fe/H] from Harris 1996, with being the gradient of the slope above and being ), allows a calibrator on [Fe/H] for other clusters.
Figure 2 displays the robustness of this technique, with [Fe/H] values from this project plotted against those from the literature. Solid points are the clusters analysed in Papers I and II. From the current paper, the cross is M4, the square is M12, the triangle is NGC 288 and the diamond is NGC 6752; the [Fe/H] literature values are from Kanatas et al. (1995), Johnson & Pilachowski (2006), Chen et al. (2000) and Zinn (1985) respectively. This method is similar to that outlined by Cole et al. (2004) and Warren & Cole (2009), except we use the TRGB rather than the HB so it can be used for much more distant objects. A recent photometric study of 47 Tuc has revised the metallicity of 47 Tuc to Bergbusch & Stetson (2009). If this new value is adopted for our calibration, a maximum change in our calculated [Fe/H] values is -0.05 (Kron 3), which is well within our uncertainty estimates. Calculated [Fe/H] values are also shown in Table 1.

3.3 Rotation
To measure the projected rotation of each cluster, we assumed an isothermal distribution. The rotations were measured by halving each by position angle (PA) and subtracting the mean stellar velocity of one half from the other. This was repeated in steps of and the best-fitting sine function overplotted (Figure 3). Note that for NGC 6752 it was necessary to perform this in steps of to avoid aliasing effects. The method results in an amplitude that is twice the projected rotation. Therefore, M4 exhibits rotation at km s-1, with an approximate axis of rotation of PA=, M12 at km s-1, with an approximate axis of rotation of PA= (although this is effectively consistent with no rotation), NGC 288 at km s-1, with an approximate axis of rotation of PA=, and NGC 6752 shows no rotation to a level of km s-1. Our rotation measurement for M4 agrees well with that by Peterson et al. (1995), who quoted an amplitude of km s-1 with an axis along the line PA=, although only for the inner (, about of the radius of our most distant member).


For all clusters, we corrected the individual stellar velocity data for the measured rotation before calculating the velocity dispersions and M/LV profiles.
3.4 Velocity Dispersions
The systemic velocities of each cluster were measured using a Markov Chain Monte Carlo (MCMC) method (Gregory, 2005), taking into account the individual velocity uncertainties on the stars, and providing the systemic velocities with associated uncertainties. A simple combination of the stellar velocities in each bin can provide a measure of systemic velocity and dispersion, although this does not take into account the individual velocity uncertainties. To fully incorporate these, we used a Bayesian MCMC-based analysis to provide a measure of realistic uncertainties of the velocity properties as a function of radius. Our systemic velocities agree very well with those from the literature ( for all 10 clusters from this project are shown in Table 1), except for NGC 6144. Our survey did not sample this cluster well (19 stars were found to be members), however, only 7 stars were analysed by Geisler et al. (1995) which may explain the discrepancy between the two values. The literature values are taken from Suntzeff et al. (1993) (M4 and M12), Rutledge et al. (1997) (NGC 288 and NGC 6752) and Geisler et al. (1995) (NGC 6144).
The velocity dispersions of our samples were calculated for annular bins centred on the cluster, each containing a similar number of stars (M4 , M12 , NGC 288 and NGC 6752 ), centred on the cluster. The MCMC method described above was used to determine the dispersion in each bin, with the resulting velocity dispersion profiles overplotted with the best-fitting line-of-sight Plummer (1911) model:
| (1) |
Here, is the central velocity dispersion and is the Plummer scale radius (Haghi et al., 2009, note that for Plummer models the unprojected half-mass radius is times the scale radius, however, for projected Plummer models such as in this paper is equivalent to the projected half-mass radius;). The Plummer model is advantageous for our analysis because it is monotonically decreasing, so any flattening of the profiles would be discernible. It also allows for the calculation of the total mass of the cluster from the central velocity dispersion () and via (see Dejonghe 1987 for a discussion of Plummer models and their application):
| (2) |
Note that this model assumes the velocity distributions of the clusters are isotropic. How this assumption affects the overall conclusions of this paper regarding MOND and dark matter within GCs is far from obvious, and is a very complex problem which is beyond the scope of the current study (see Spurzem et al., 2005; Giersz, 2006; Kim et al., 2008, and references therein, for detailed discussions of the problem of isotropy in GCs). However, the anisotropies in each of the ten clusters analysed in Papers I, II and the current study are likely to vary greatly due to the large variation in Galactocentric distances and rotational velocities. Because all our clusters exhibit similar kinematic morphologies, with the possible exception of M4 (Section 4), the anisotropy issue seems to have little impact on our results.


We have chosen a Plummer model that does not include a tidal cutoff, over a more sophisticated Plummer model which includes a limiting tidal radius, because the tidal radii of many GCs are not well known (e.g. NGC 6752 and 47 Tucanae; see Section 3.1 and Paper II, respectively). Indeed, for many clusters we have found cluster members well outside literature values of . This means that our model includes velocity dispersion information outside the tidal radii of our clusters. We have, therefore, not removed any velocity information for , which would reduce the accuracy of the model at large radii where .
The velocity dispersion profiles, along with the total masses, scale radii and central velocity dispersions are presented in Figure 4. Except for M4, our mass estimates agree well with other studies (Meylan, 1989; Pryor & Meylan, 1993; Kruijssen & Mieske, 2009, e.g.), none of whom used Plummer models to calculate their estimates. For M4, we find a total mass about twice that of those studies [although this is reduced to a % difference if the extremes of the uncertainties of Kruijssen & Mieske (2009) and the current paper are taken]. Despite the Plummer profile fit being within the uncertainties, it is apparent that the outer five bins of M4 have nearly the same measured velocity dispersions. This increases the value of in the fitting of the profile, which is used to calculate the total mass (Equation 2), which, in turn, leads to an inflated mass estimate. We attribute this apparent flattening of the dispersion profile to tidal heating (see Section 4).


Except for M4, none of the clusters discussed here have shown the apparent flattening of the velocity dispersion profiles reported by Scarpa et al. (2003); Scarpa et al. (2007a); Scarpa et al. (2007b), indicating that neither a significant DM component, nor a modified theory of gravity, is required to explain their kinematic properties. This corroborates earlier results for 47 Tuc, M22, M30, M53, M55 and M68 in Papers I and II, and similar conclusions are drawn by Sollima et al. (2009) for Centauri, by Jordi et al. (2009) for Pal 14 and by Sollima & Nipoti (2010) for MOND theories in general. Through studies such as these, it is becoming increasingly apparent that neither DM, nor modified gravity theories, are necessary to explain the internal kinematics of GCs.
3.5 Projected Mass-to-Light Profiles
Dark matter causes larger stellar accelerations, and hence higher maximal stellar velocities, therefore, a good indication of whether a pressure-supported object like a GC is dark matter dominated is to measure its mass-to-light ratio. To calculate the M/LV for our clusters we have used the surface brightness data by (Trager et al., 1995, see Figure 5) to which projected Plummer surface brightness profiles:
| (3) |
have been fitted (Figure 5). These Plummer profiles were converted to solar luminosities per square parsec. Projected mass density profiles (Dejonghe, 1987):
| (4) |
in units of solar masses per square parsec, were then divided by the surface brightness profiles to produce radial mass-to-light profiles. The Plummer fits to the surface brightness data do not include tidal cutoffs, for the reasons discussed in Section 3.4. Note that the kinematic and surface brightness models have been fitted independently, leading to two independent values of . The scale radius from the Plummer fits to the luminosity profiles (Equation 3 and Figure 5) is denoted ; throughout this paper represents the value obtained from the cluster kinematics (Equation 1). These separate fits allow a radial, projected, M/LV profile to be calculated:
| (5) |


The M/LV profiles and mean values are shown in Figure 6; the thick line is the calculated M/LV and the thin lines are their uncertainties. The M/LV profiles at small radii deviate significantly from the mean. We interpret this as being due to the uncertainty in the measured luminosities and kinematics near the cores of the clusters. Crowding and confusion effects are inherent in luminosity and kinematic measurements of dense stellar fields, such as those near the cores of GCs; it is clear in Figure 5 that there is a large spread of surface brightness measurements near the cores of all four clusters. Because of this uncertainty in core luminosities and kinematics, our mean M/LV values were calculated for to ensure that these effects were removed.
Dark-matter-dominated dynamical systems (e.g. elliptical and dwarf galaxies), exhibit high mass-to-light ratios (M/L), whereas Ultra Compact Dwarfs, which have the same velocity dispersion–luminosity relation as GCs Haşegan et al. (2005); Evstigneeva et al. (2007), show no evidence for DM for M/L. None of our clusters have M/L, therefore DM cannot dominate, and because none have M/L we see no need for any DM component. Similar conclusions were reached for all six clusters studied in Papers I and II. All results from this project indicate strongly that, in general, GCs do not contain large quantities of DM. We thought it important to mention that Baumgardt & Mieske (2008) have shown that dynamically more evolved GCs exhibit lower M/LV values, so the larger M/LV of NGC 6752 should indicate that this cluster is dynamically “young”. However, this is in direct contradiction with the current understanding of NGC 6752 having a collapsed core Rubenstein & Bailyn (1997).
It is interesting to note that Ferraro et al. (2003) discussed the possibility of a large M/LV value () for the inner 0.08 pc of NGC 6752, because of the observed accelerations of millisecond pulsars near the core. Since we do not claim any knowledge of the M/LV at those radii, this indeed remains a possibility, should the M/LV increase further from toward the core. This intriguing possibility should be pursued by extracting more information on the kinematics of the core of NGC 6752, particularly in light of a newly recognised correlation that may be useful for accurately estimating the masses of GC cores Leigh et al. (2009).
| Cluster | [Fe/H] | M/LV | |||||||
| 47 Tuc | – | 56.1 | |||||||
| Kron 3 | – | – | – | – | – | – | – | – | |
| M4 | 20.8 | ||||||||
| NGC 288 | 33.1 | ||||||||
| Sgr | – | – | – | – | – | – | – | – | |
| NGC 121 | – | – | – | – | – | – | – | – | |
| M12 | 25.1 | ||||||||
| NGC 6752 | nil | 64.4 () | |||||||
| M22 | 27.0 | ||||||||
| M55 | – | 25.1 | |||||||
| M53 | nil | 112.6 | |||||||
| M68 | 90.0 | ||||||||
| M30 | nil | 42.7 | |||||||
| NGC 6144 | – | – | – | – | – | – | 82.2 | – |
3.5.1 Correlation Between M/LV and Luminosity
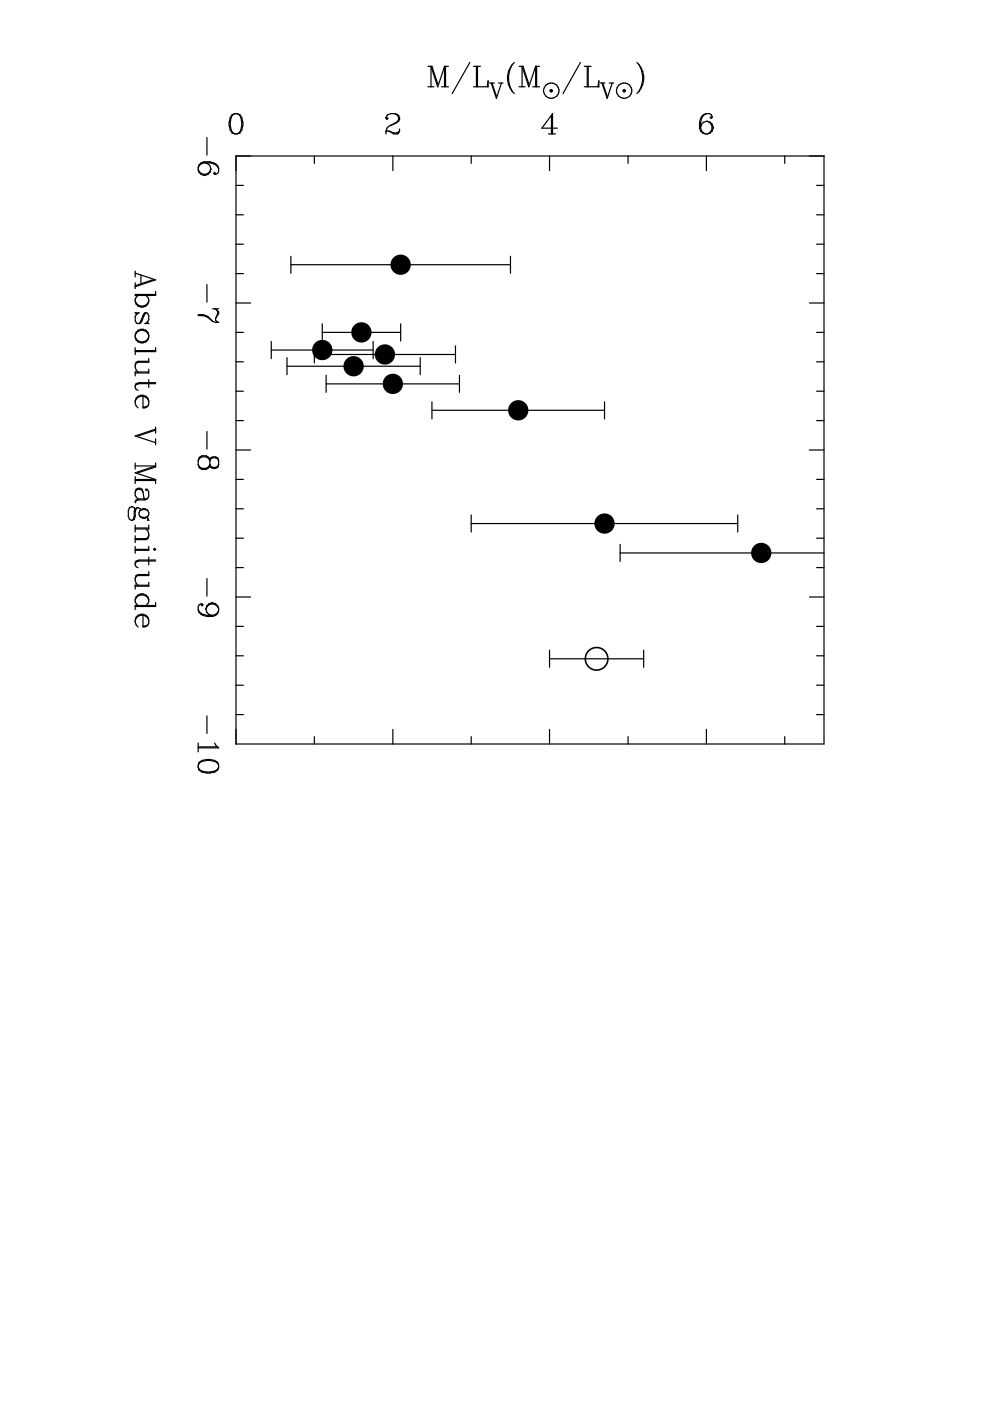
47 Tuc is well known as having a bimodal distribution of various line strengths in both MS and giant stars (Norris & Freeman, 1979; Cannon et al., 1998; Harbeck et al., 2003, e.g.). The most popular explanation for this phenomenon is that the cluster has undergone multiple episodes of star formation. In Paper II we reported a rise in the velocity dispersion of 47 Tuc for , which we interpreted as evidence for evaporation. Here we present an alternative scenario for this signature: a past merger, which explains both the rise in velocity dispersion and the bimodality in line strengths, as well as its anomalously high luminosity compared with its M/LV (see Figure 7).
The clusters from this project exhibit a clear trend between M/LV and total luminosity (Figure 7; a trend which is generally attributed to low-mass star depletion, e.g. Kruijssen & Portegies Zwart, 2009, and references therein), with 47 Tuc being an apparent outlier. Since there is no reason to think that 47 Tuc has a large DM component, a simple explanation is that 47 Tuc merged with another object of similar metallicity in its past. This merger would have increased the total luminosity of the cluster without altering its M/LV significantly and caused bimodalities in both line strengths and velocities. If there has not yet been enough time for the two populations to mix thoroughly, this may be the cause of the observed rise in velocity dispersion. A detailed analysis of this scenario was presented by Lane et al. (2010b).
4 Evidence for Tidal Heating
When attempting to determine the reality of MOND using GCs, it is generally agreed that GCs at large distances from the Galaxy are most useful because the external acceleration imparted by the Galactic tidal field is below (Sollima & Nipoti, 2010, and references therein). An important question to ask, then, is at what Galactocentric distance does the external field become “negligible”? Furthermore, does the shape of the Halo have an effect on the GC dynamics, whereby distant GCs in certain regions of the Halo are affected above this threshold? One clear theoretical prediction is that the external field should heat the external parts of the GCs, thus increasing the velocity dispersion, up to, and including, tidal destruction (Odenkirchen et al., 2001, e.g. Pal 5;). This is especially true during Disc crossings and at perigalacticon where tidal shocks strongly affect the dynamics of the cluster for short periods. We present here an examination of our data as an analysis of the Galactic tidal field.
Figure 8 shows how the ratio between the velocity dispersions at the tidal radius and core varies with distance from the Plane. The closer to the Plane, the greater the tidal effects from the Galaxy, and the larger the ratio. It is clear that for kpc the tidal effects of the Galaxy are essentially equivalent at all radii. From this we can infer that the DM Halo exerts the dominant tidal force for kpc. Furthermore, because the four clusters beyond kpc (in increasing distance these are M30, M68, NGC 288 and M53) are in different locations in the Halo Harris (1996) and on orbits with vastly different orientations to the Halo Allen et al. (2006), this indicates the possibility of a non-triaxial DM Halo (see Peñarrubia et al., 2009, for a discussion of the effects of halo triaxiality on the dynamics of GCs). Note that this is not strong evidence for the shape of the dark Halo, however, it is worth mentioning.

M4 has a fairly flat velocity dispersion profile in the outer regions (Figure 4). This cluster is also very close to the Plane (Harris, 1996, 600 pc;) and has the largest value of [] of any of our clusters (Figure 8). Furthermore, its 3D space velocity, with respect to the Local Standard of Rest Dinescu et al. (1999), indicates that it is continuously interacting with the Disc because its orbit is nearly Planar. This, combined with its low M/LV, strongly indicates that tidal heating is the cause of the flattening of the velocity dispersion in the outskirts of M4 rather than a substantial DM component.
Figure 8 seems to indicate that GCs are tidally shocked within kpc of the Plane, then cool down, and stay cool, beyond that distance. However, the orbital periods calculated by Dinescu et al. (1999) are about an order of magnitude shorter than the relaxation times in the Harris (1996) catalogue for all of our clusters. Since the outskirts of GCs are much less dense than the cores, two-body interactions could not cause the outer regions to cool in less than the relaxation time of the cluster. In fact, no mechanism known to the authors can account for this rapid cooling in the outskirts of our GCs. Based on the M/LV and velocity dispersion profiles of all 10 clusters, a large DM component is very unlikely. It is also very unlikely that we are seeing a MONDian effect in these outer regions because of the Newtonian nature of the velocity dispersion profiles. Addressing this interesting problem is beyond the scope of this paper, and more work is required to solve this intriguing puzzle.
5 Conclusions
In the current paper we have analysed four GCs (M4, M12, NGC 288 and NGC 6752) to determine their velocity dispersion and M/LV profiles, bringing the total to 10 for this project. We have included GCs that have external accelerations extending from above down to and we find no deviation from our Plummer models at lower accelerations. Therefore, we see no indication that DM, or a modified version of gravitational theory, is required to reconcile GC dynamics with Newtonian gravity. This adds to the growing body of evidence that GCs are DM-poor, and that our understanding of weak-field gravitation is not incomplete. Within the stated uncertainties, the dynamics of all these clusters are well described by purely analytic Plummer (1911) models, which indicates that Newtonian gravity adequately describes their velocity dispersions, and we observe no breakdown of Newtonian gravity at m s-2, as has been claimed in previous studies.
Despite this, we see the intriguing possibility of an unknown cooling process in the outskirts of GCs; the external regions of our GCs seem to cool much faster following tidal Disc shocks than the relaxation time of the clusters. Because it is highly unlikely that a MONDian process, or a significant DM component, is the cause of this cooling (based on our velocity dispersion and M/LV profiles), further work is required to solve this puzzle. Furthermore, the lack of tidal heating events in the distant clusters provides some indication that the dark Halo is not triaxial.
The Plummer model was also used to determine the total mass, scale radius, and M/LV profile for each cluster. We find that none of our clusters have M/L, further evidence that DM does not dominate. We have produced M/LV profiles, rather than quoting a single value based on the central velocity dispersion and central surface brightness. This method is used because it describes the M/LV of the entire cluster, rather than only its core. This is particularly important for post-core-collapsed GCs, where crowding and confusion effects introduce significant uncertainty into luminosity and kinematic measurements at small radii. Within the uncertainties, our estimated cluster masses all match those in the literature except for M4, which we calculate to have a total mass about twice that of the literature values. The reason for this discrepancy is that the tidally heated cluster has an increased velocity dispersion in its outer regions, flattening the Plummer fit, increasing the value of , and therefore, increasing the mass estimate.
Another important result from this study is the measured rotations of our clusters. Of the four clusters studied here, M4 and NGC 288 show clear rotation, M12 may have some rotation, and NGC 6752 displays no rotation signature.
Throughout this project we have found similar results for the dark matter content, and Newtonian kinematics, of our 10 GCs, all at varying distances from the Galactic centre and Disc, including three that experience external accelerations due to the Galaxy of . All data were acquired using the same instrument (AAOmega on the Anglo-Australian Telescope), reduced using the same pipeline (2dfdr), and analysed in the same way. This homogeneous approach is vital to a large project such as this, to ensure all systematics are accounted for in a similar fashion. Because of all these factors, our results from the three papers are indicative that the current picture of globular clusters being dark-matter poor, and with dynamics explained by standard Newtonian theory, is correct.
6 Acknowledgements
This project has been supported by the University of Sydney, the Anglo-Australian Observatory, the Australian Research Council, the Hungarian OTKA grant K76816 and the Lendület Young Researchers Program of the Hungarian Academy of Sciences. RRL thanks Martine L. Wilson for her support during the writing of this paper. The authors thank Dean McLaughlin for his helpful comments.
References
- Allen et al. (2006) Allen, C., Moreno, E., & Pichardo, B. 2006, ApJ, 652, 1150
- Baumgardt et al. (2005) Baumgardt H., Makino J., Hut P., 2005, ApJ, 620, 238
- Baumgardt & Mieske (2008) Baumgardt, H., & Mieske, S. 2008, MNRAS, 391, 942
- Bergbusch & Stetson (2009) Bergbusch, P. A., & Stetson, P. B. 2009, AJ, 138, 1455
- Cannon et al. (1998) Cannon, R. D., Croke, B. F. W., Bell, R. A., Hesser, J. E., & Stathakis, R. A. 1998, MNRAS, 298, 601
- Chen et al. (2000) Chen, A. B.-C., Tsay, W.-S., Tsai, W.-S., & Lu, P. K. 2000, AJ, 120, 2569
- Cole et al. (2004) Cole, A. A., Smecker-Hane, T. A., Tolstoy, E., Bosler, T. L., & Gallagher, J. S. 2004, MNRAS, 347, 367
- Colpi et al. (2003) Colpi M., Mapelli M., Possenti A., 2003, ApJ, 599, 1260
- Conn et al. (2007) Conn, B. C., et al. 2007, MNRAS, 376, 939
- Côté et al. (2003) Côté, P., McLaughlin, D. E., Cohen, J. G., & Blakeslee, J. P. 2003, ApJ, 591, 850
- Davidge & Harris (1997) Davidge, T. J., & Harris, W. E. 1997, ApJ, 475, 584
- Dejonghe (1987) Dejonghe, H. 1987, MNRAS, 224, 13
- Dinescu et al. (1999) Dinescu D. I., Girard T. M., van Altena W. F., 1999, AJ, 117, 1792
- Djorgovski & King (1986) Djorgovski, S., & King, I. R. 1986, ApJL, 305, L61
- Evstigneeva et al. (2007) Evstigneeva, E. A., Gregg, M. D., Drinkwater, M. J., & Hilker, M. 2007, AJ, 133, 1722
- Ferraro et al. (2003) Ferraro, F. R., Possenti, A., Sabbi, E., Lagani, P., Rood, R. T., D’Amico, N., & Origlia, L. 2003, ApJ, 595, 179
- Gebhardt & Thomas (2009) Gebhardt, K., & Thomas, J. 2009, ApJ, 700, 1690
- Geisler et al. (1995) Geisler, D., Piatti, A. E., Claria, J. J., & Minniti, D. 1995, AJ, 109, 605
- Giersz (2006) Giersz M., 2006, MNRAS, 371, 484
- Gregory (2005) Gregory, P. C. 2005, Bayesian Logical Data Analysis for the Physical Sciences: A Comparative Approach with ‘Mathematica’ Support. Cambridge University Press, Cambridge, United Kingdom
- Haghi et al. (2009) Haghi H., Baumgardt H., Kroupa P., Grebel E. K., Hilker M., Jordi K., 2009, MNRAS, 395, 1549
- Harbeck et al. (2003) Harbeck, D., Smith, G. H., & Grebel, E. K. 2003, AJ, 125, 197
- Harris (1996) Harris, W. E. 1996, AJ, 112, 1487
- Haşegan et al. (2005) Haşegan, M., et al. 2005, ApJ, 627, 203
- Johnson & Pilachowski (2006) Johnson, C. I., & Pilachowski, C. A. 2006, AJ, 132, 2346
- Jordi et al. (2009) Jordi, K., et al. 2009, AJ, 137, 4586
- Kanatas et al. (1995) Kanatas, I., Griffiths, W. K., Dickens, R. J., & Penny, A. J. 1995, MNRAS, 272, 265
- Kim et al. (2008) Kim E., Yoon I., Lee H. M., Spurzem R., 2008, MNRAS, 383, 2
- Kiss et al. (2007) Kiss, L. L., Székely, P., Bedding, T. R., Bakos, G. Á., & Lewis, G. F. 2007, ApJL, 659, L129
- Kissler-Patig et al. (1999) Kissler-Patig, M., Grillmair, C. J., Meylan, G., Brodie, J. P., Minniti, D., & Goudfrooij, P. 1999, AJ, 117, 1206
- Kruijssen & Mieske (2009) Kruijssen, J. M. D., & Mieske, S. 2009, A&A, 500, 785
- Kruijssen & Portegies Zwart (2009) Kruijssen J. M. D., Portegies Zwart S. F., 2009, ApJ, 698, L158
- Lane et al. (2009) Lane R. R., Kiss L. L., Lewis G. F., Ibata R. A., Siebert A., Bedding T. R., Székely P., 2009, MNRAS, 400, 917 (Paper I)
- Lane et al. (2010a) Lane R. R., Kiss L. L., Lewis G. F., Ibata R. A., Siebert A., Bedding T. R., Székely P., 2010a, MNRAS, 401, 2521 (Paper II)
- Lane et al. (2010b) Lane R. R., Brewer B. J., Kiss L. L., et al., 2010b, ApJ, 711, L122
- Lee et al. (2004) Lee, K. H., Lee, H. M., Fahlman, G. G., & Sung, H. 2004, AJ, 128, 2838
- Leigh et al. (2009) Leigh, N., Sills, A., & Knigge, C. 2009, MNRAS, L318
- McLaughlin et al. (2006) McLaughlin D. E., Anderson J., Meylan G., Gebhardt K., Pryor C., Minniti D., Phinney S., 2006, ApJS, 166, 249
- Meylan (1989) Meylan, G. 1989, A&A, 214, 106
- Milgrom (1983) Milgrom M., 1983, ApJ, 270, 365
- Munari et al. (2005) Munari, U., Sordo, R., Castelli, F. and Zwitter, T. 2005, A&A, 442, 1127
- Norris & Freeman (1979) Norris, J., & Freeman, K. C. 1979, ApJL, 230, L179
- Odenkirchen et al. (2001) Odenkirchen, M., et al. 2001, ApJL, 548, L165
- Paust (2006) Paust, N. E. Q. 2006, Ph.D. Thesis
- Peñarrubia et al. (2009) Peñarrubia J., Walker M. G., Gilmore G., 2009, MNRAS, 399, 1275
- Peterson et al. (1995) Peterson, R. C., Rees, R. F., & Cudworth, K. M. 1995, ApJ, 443, 124
- Plummer (1911) Plummer, H. C. 1911, MNRAS, 71, 460
- Pryor & Meylan (1993) Pryor, C., & Meylan, G. 1993, Structure and Dynamics of Globular Clusters, 50, 357
- Quercellini et al. (2008) Quercellini, C., Amendola, L., & Balbi, A. 2008, MNRAS, 391, 1308
- Rubenstein & Bailyn (1997) Rubenstein E. P., Bailyn C. D., 1997, ApJ, 474, 701
- Rutledge et al. (1997) Rutledge, G. A., Hesser, J. E., Stetson, P. B., Mateo, M., Simard, L., Bolte, M., Friel, E. D., & Copin, Y. 1997, PASP, 109, 883
- Safonova & Shastri (2009) Safonova M., Shastri P., 2009, arXiv, arXiv:0910.2551
- Scarpa et al. (2003) Scarpa, R., Marconi, G., & Gilmozzi, R. 2003, A&A, 405, L15
- Scarpa et al. (2007a) Scarpa, R., Marconi, G., Gilmozzi, R., & Carraro, G. 2007a, A&A, 462, L9
- Scarpa et al. (2007b) Scarpa, R., Marconi, G., Gilmozzi, R., & Carraro, G. 2007b, The Messenger, 128, 41
- Skrutskie et al. (2006) Skrutskie, M. F., et al. 2006, AJ, 131, 1163
- Sollima et al. (2009) Sollima, A., Bellazzini, M., Smart, R. L., Correnti, M., Pancino, E., Ferraro, F. R., & Romano, D. 2009, MNRAS, 396, 2183
- Sollima & Nipoti (2010) Sollima A., Nipoti C., 2010, MNRAS, 401, 131
- Spurzem et al. (2005) Spurzem R., Giersz M., Takahashi K., Ernst A., 2005, MNRAS, 364, 948
- Steinmetz et al. (2006) Steinmetz, M., et al. 2006, AJ, 132, 1645
- Suntzeff et al. (1993) Suntzeff, N. B., Mateo, M., Terndrup, D. M., Olszewski, E. W., Geisler, D., & Weller, W. 1993, ApJ, 418, 208
- Trager et al. (1995) Trager, S. C., King, I. R., & Djorgovski, S. 1995, AJ, 109, 218
- Tremaine et al. (2002) Tremaine S., Gebhardt K., Bender R., et al., 2002, ApJ, 574, 740
- Valenti et al. (2004) Valenti, E., Ferraro, F. R., & Origlia, L. 2004, MNRAS, 351, 1204
- Warren & Cole (2009) Warren, S. R., & Cole, A. A. 2009, MNRAS, 393, 272
- Webb et al. (2002) Webb N. A., Gendre B., Barret D., 2002, A&A, 381, 481
- Wu & Tremaine (2006) Wu, X., & Tremaine, S. 2006, ApJ, 643, 210
- Zinn (1985) Zinn, R. 1985, ApJ, 293, 424
- Zwitter et al. (2008) Zwitter, T. et al. 2008, AJ, 136, 421