Radio Galaxy NGC 1265 unveils the Accretion Shock onto the Perseus Galaxy Cluster
Abstract
We present a consistent three-dimensional model for the head-tail radio galaxy NGC 1265 that explains the complex radio morphology and spectrum by a past passage of the galaxy and radio bubble through a shock wave. Using analytical solutions to the full Riemann problem and hydrodynamical simulations, we study how this passage transformed the plasma bubble into a toroidal vortex ring. Adiabatic compression of the aged electron population causes it to be energized and to emit low surface brightness and steep-spectrum radio emission. The large infall velocity of NGC 1265—which is barely gravitationally bound to the Perseus cluster at its current position—and the low Faraday rotation measure values and variance of the jet strongly argue that this transformation was due to the accretion shock onto Perseus situated roughly at . Estimating the volume change of the radio bubble enables inferring a shock Mach number of , a density jump of , a temperature jump of , and a pressure jump of while allowing for uncertainties in the equation of state of the radio plasma and volume of the torus. Extrapolating X-ray profiles, we obtain upper limits on the gas temperature and density in the infalling warm-hot intergalactic medium of keV and . The orientation of the ellipsoidally shaped radio torus in combination with the direction of the galaxy’s head and tail in the plane of the sky is impossible to reconcile with projection effects. Instead, this argues for post-shock shear flows that have been caused by curvature in the shock surface with a characteristic radius of 850 kpc. The energy density of the shear flow corresponds to a turbulent-to-thermal energy density of 14%—consistent with cosmological simulations. The shock-injected vorticity might be important in generating and amplifying magnetic fields in galaxy clusters. We suggest that future polarized radio observations by, e.g., LOFAR of head-tail galaxies can be complementary probes of accretion shocks onto galaxy clusters and are unique in determining their detailed flow properties.
Subject headings
galaxies: clusters: individual (Perseus) – galaxies: individual (NGC 1265) – galaxies: jets – intergalactic medium – radio continuum: galaxies – shock wavesI. Introduction
Head-tail radio galaxies show spectacular asymmetric radio morphologies and occur in clusters of galaxies. The favored interpretation of these head-tail sources is radio jets ejected by an active core of a galaxy. The jets are bent at some angle toward one direction giving rise to a “head” structure and fan out at larger distances in a characteristic tail that extends over many tens to hundreds of kpc. If the flow impacting these galaxies is supersonic, ram pressure of the intracluster medium (ICM) causes the jets to bend [4]; if the flow is trans-sonic with a Mach number , the thermal pressure gradient of the interstellar medium of these galaxies due to their motion through the ICM causes the bending [23]. In this model, the supersonic inflow is decelerated and heated by a bow shock in front of the galaxy which also generates a turbulent wake that re-accelerates the relativistic particle population in the tail and illuminates the large-scale tail structure of these sources. The Perseus cluster is an outstanding example, as it hosts many of these head-tail sources: most prominently NGC 1265 and IC 310 [42, 30]. High-resolution observations of the head structure of NGC 1265 reveal two radio jets emerging from the galaxy which are at an angle of to the tail where the two jets are first parallel to each other and then merge [32]. Gisler & Miley [21] found an extension of this radio tail to the north-east. Surprisingly, at lower surface brightness, Sijbring & de Bruyn [47] find an additional large scale structure that arches toward the east around the steep spectrum tail of NGC 1265 and forms a closed ring with a very steep, but constant spectral index across. Using rotation measure (RM) synthesis, de Bruyn & Brentjens [12] find a very weak diffuse polarized structure with a Faraday depth of approximately at the angular position coincident with the steep spectrum tail as well as the ring structure of NGC 1265. Follow-up mosaic observations of the area around the Perseus cluster show that most if not all of this emission is of Galactic origin [7].
Sijbring & de Bruyn [47] discuss a total of four models to explain this puzzling observation. They immediately discard two models—one model of chance superposition of several independent head-tail galaxies due to the lack of strong radio sources in this field (Model 1) as well as another model that hypothesizes reacceleration of mildly relativistic electrons in the turbulent wake of a galaxy due to contrived projection probabilities and implausible energetics (Model 2). The previously favored pair of models discussed in Sijbring & de Bruyn [47]—apparently simple—do in fact appear to have considerable amount of fine-tuning and have severe physical problems associated with them as we will point out here. Model 3: in this model, they postulate a helical cluster wind that has to be aligned with the line-of-sight (LOS) to produce the observed ring structure in projection: such a configuration is highly unlikely, and this model has problems in explaining the constancy of the spectrum and the surface brightness along the radio ring. To balance the synchrotron and inverse Compton cooling of an electron population, this model would need to postulate a fine-tuned acceleration process that however must not fan out the well-confined radio emission along the arc. Model 4: in this model, the “radio tail” would outline the ballistic orbit of NGC 1265. To sustain such a helical orbit of NGC 1265 over , this model would require an undetected dark object of mass orbiting the galaxy.11 1 Since the velocity dispersion of NGC 1265 is unknown, we use the Faber-Jackson relation in combination with the – relation [49] to obtain the stellar mass of NGC 1265 of . We estimate the total mass by using the universal baryon fraction and a stellar-to-baryon mass yield of 0.5 so that the resulting halos mass should be considered a lower limit to the true one. The change of the direction in the brighter part of the tail remains unexplainable and there is also the problem in explaining the constancy of the spectrum and the surface brightness along the radio ring. Given these difficulties, it is attractive to consider alternative possibilities that may explore the interaction between a radio galaxy with the outskirts of the Perseus ICM. This has been foreshadowed in a remark by de Bruyn & Brentjens [12] who speculate whether the large scale polarized structure that arches around the steep spectrum tail of NGC 1265 is indeed the remains of an earlier phase of feedback. Our work will demonstrate that this picture is not only the simplest consistent explanation for the radio morphology and spectrum, but we also use it to indirectly infer the presence of a cluster shock wave and measure its properties.
Previously, the morphology of a giant radio galaxy has already been used to indirectly detect a large scale shock at an intersecting filament of galaxies [19] by using the radio galaxy as a giant cluster weather station [8]. Gravitationally driven, supersonic flows of intergalactic gas follow these filaments toward clusters of galaxies that represent the knots of the cosmic web [5]. The flows will inevitably collide and form large-scale shock waves [39, 31, 45, 37]. Of great interest is the subclass of accretion shocks that are thought to heat the baryons of the warm-hot intergalactic medium (IGM) when they are accreted onto a galaxy cluster. Formation shocks have also been proposed as possible generation sites of intergalactic magnetic fields [25, 43, 44]. Prior to this work, only discrete merger shock waves have been detected in the X-rays [29, e.g.,] and there was no characterization possible of the detailed flow properties in the post-shock regime as to test whether shear flows—the necessary condition for generating magnetic fields—are present.
The structure of the paper is as follows. In Section II, we present the basic picture of our model in a nutshell while we derive the detailed three-dimensional (3D) geometry of NGC 1265 within our model in Section III. In Section IV, we work out the properties of the accretion shock onto the Perseus cluster including those of the post-shock flow and present the implications for the infalling warm-hot IGM. In Section V, we carefully examine the underlying physics as well as the hydrodynamic stability of our model and discuss our findings in Section VI. Throughout this work, we use a Hubble constant of . For the currently favored CDM cosmology with the present day density of total matter, , and the cosmological constant, , we obtain an angular diameter distance to Perseus () of ; at this distance, corresponds to . X-ray data estimates a virial radius and mass for Perseus22 2 We define the virial mass and the virial radius as the mass and radius of a sphere enclosing a mean density that is times the critical density of the Universe. of and [40].
II. The idea in a nutshell
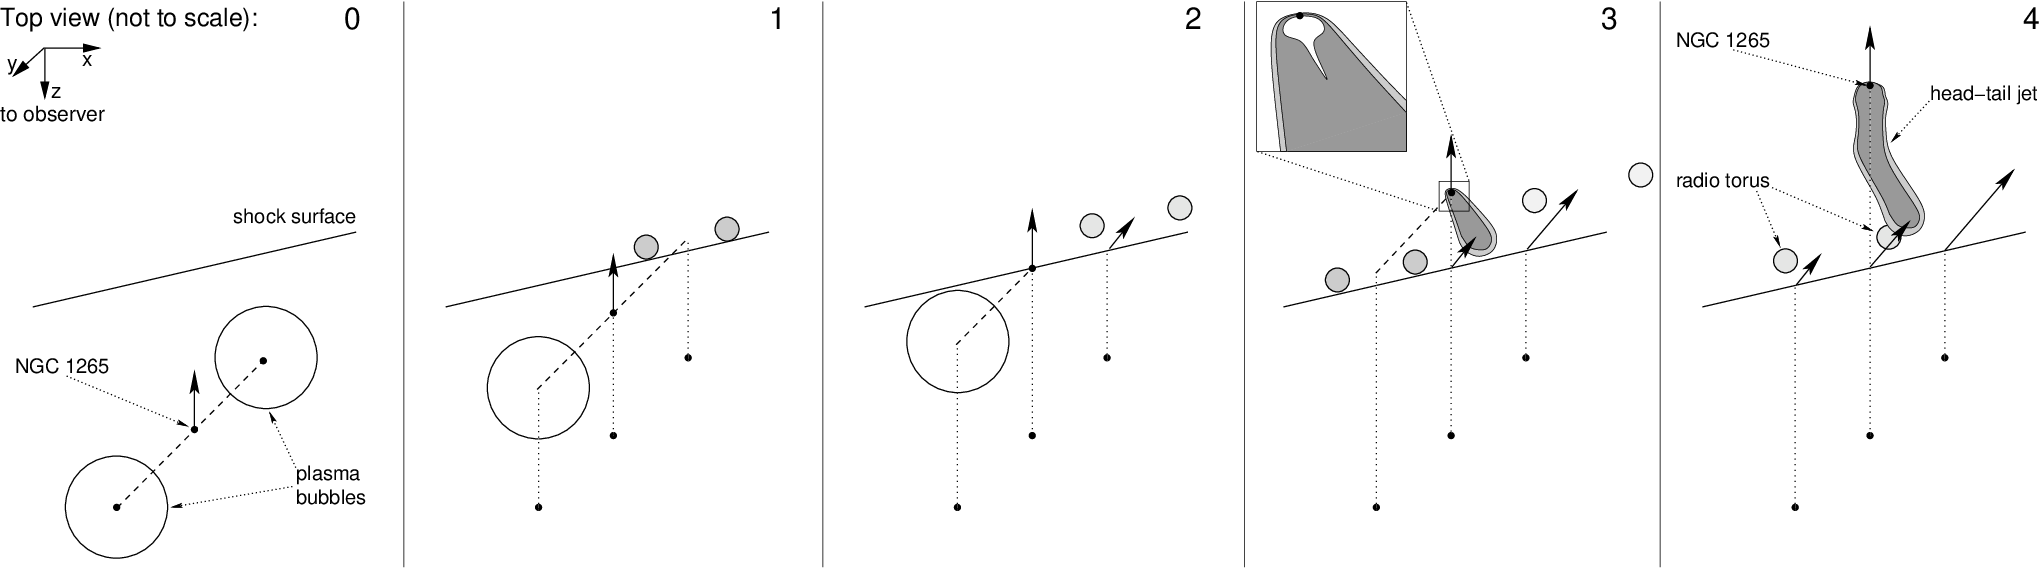
Before we present the idea of our model, we point out the main morphological and spectral properties of the giant radio galaxy NGC 1265 that every model would have to explain: (1) The synchrotron surface brightness, , and the spectral index, , between 49 and 92 cm along the tail of NGC 1265 (starting at the galaxy’s head) show a characteristic behaviour (as shown in Figure 2 of Sijbring & de Bruyn 47). In the first part of the tail, both quantities decline moderately in a way that is consistent with synchrotron and inverse Compton cooling of a relativistic electron population that got accelerated at the base or the inner regions of the jet. (2) At the point of the tail where the twist changes in projection from left- to right-handed, both quantities experience a sudden drop—while changes by a factor of 10, declines from to . (3) Finally, along the remaining curved arc, and stay approximately constant on a total arc length of , where is the radius of the arc, the projected arc length in units of radians, and , where is the height of the 3D helix. This property is in particular puzzling, as there is no visible synchrotron cooling or fanning out of the dilute part of the tail visible.
These findings taken together suggest the presence of two separate populations of relativistic electrons giving rise to the bright and the dim part of the tail, respectively, where the latter must have experienced a coherent energetization event33 3 We discard the alternative that there is a continuous acceleration process that exactly balances synchrotron and inverse Compton cooling due to the large degree of fine-tuning needed and because it is difficult to avoid a fanning out of the synchrotron emission region along the tail if the acceleration process is, e.g., of turbulent nature. over a length scale of and on a timescale that is shorter than the cooling time of the radio emitting electrons of . The presence of one radio tail that connects the two electron populations in projection points to a causally connected origin of the synchrotron radiating structure. The most natural explanation that combines these observational requirements are the reminders of two distinct epochs of active galactic nucleus outbursts where the most recent one is still visible as a head-tail radio jet and the older one experienced a recent coherent energetization event. In particular, we propose that such an energizing event could be provided by the passage of a detached radio plasma bubble from a previous outburst through a shock wave. This passage transforms the plasma bubble into a torus (vortex ring) and adiabatically compresses and energizes the aged electron population to emit low surface brightness and steep-spectrum radio emission (as we detail below). If the shock crossing is oblique, then the radio torus and the tail end of the recent outburst experience the same degree of shock deflection since both structures can be regarded as passive tracers of the post-shock velocity field and hence provide a natural explanation for the apparent connectivity of both structures. With this idea in mind, we sketch a schematic of the time evolution in our model in Figure 1.


The reason for the transformation of a plasma bubble into a toroidal vortex ring can be easiest seen in the rest frame of the shock, where the ram pressure of the pre-shock gas balances the thermal pressure in the post-shock regime. The bubble is filled with hot (relativistic) and more dilute plasma compared to the surrounding ICM. Once the dilute radio plasma of the bubble comes into contact with the shock surface, the ram pressure is reduced at this point of contact due to the smaller density inside the bubble [17]. The shock and the post-shock gas expand into the bubble and propagate with a faster velocity compared to the incident shock in the ICM. Owing to symmetry, the ambient gas penetrates the line through the center of the bubble first and has a smaller velocity for larger impact parameters. This difference in propagation velocities implies a shear flow and eventually causes a vortex flow around the newly formed torus which stabilizes it as it moves now with the post-shock velocity field. To study the timescale on which this transformation happens, we solve the one-dimensional (1D) Riemann problem of a shock passage through a bubble exactly in Appendix B. These calculations are complemented by a suite of two-dimensional (2D) axisymmetric simulations using a code that employs an upwind, total variation diminishing scheme to solve the hydrodynamical equations of motion [46]. To map out parameter space, we varied the Mach number and initial bubble/ICM density contrast (see Figure 2 for one realization). As a result, we find that an initially spheroidal bubble will then evolve into a torus on a timescale that is determined by the crossing time of the original bubble–ICM contact discontinuity (CD) through the bubble. For typical numbers, (Equation (B6)). As we will see in Section V, this is much faster than any transverse shear on the scale of the bubble or beyond can act to distort it.
The morphology of the radio torus is consistent with MHD simulations of this effect that assume strong shocks [17, cf. Figs. 9 and 10 in]. The relativistic plasma within the bubble experiences an adiabatic compression by a factor44 4 In this work we will encounter three different compression factors/density contrasts that should not be confused: the compression factor by which the volume of the bubble changes upon shock passage, the compression factor between the post- and pre-shock ICM density at the shock front, and the density contrast between the density of the radio plasma and the ICM. that increases the Lorentz factor of the relativistic electrons as and the rms magnetic field as . Hence the radio cutoff of a cooled electron population increases as and illuminates a previously unobservable radio plasma [18]. Synchrotron and inverse Compton aging develops a steep spectrum with spectral index and a low surface brightness .
The galaxy itself remains on a ballistic orbit that is unaffected by the shock passage that likely triggers a new outflow that is now seen as a head-tail radio emission with the jets being bent by the ram pressure wind. The associated compression wave propagating through the interstellar medium could have triggered a bar-like instability in the inner accretion disk that enabled efficient angular momentum transport outward and accretion onto the super-massive black hole (SMBH) which was responsible for launching the jet.
This model explains the observed spectral steepening of the head-tail radio galaxy of due to radiative cooling along the bright part of the tail. In particular, our model naturally accounts for the observed sudden steepening of the spectral index and dropping synchrotron brightness at the transition (in projection) of the radio tail of the current outburst to the shock-illuminated radio torus and match the observed constancy of spectrum and surface brightness across the torus (see Figure 3 and Sijbring & de Bruyn 47).
The shock compression acts mostly perpendicular to the filaments during the formation of the torus. Consequently, the field component parallel to the bubble surface is preferentially amplified and dominates eventually the magnetic energy density [17]. (Provided the initial magnetic field component parallel to the shock was not too weak to be amplified above the perpendicular components.) Hence, our model predicts radial synchrotron polarization vectors relative to the center of the radio torus with a polarization degree of for our derived geometry of a viewing angle of (see Section III). This is consistent with upper limits on the polarization of – [47]. Future low-frequency radio observations with, e.g., LOFAR should be able to detect this signal.
III. Observables and Geometry
| , | LOS vector pointing to observer |
|---|---|
| , | Shock normal, pointing outward, away from convexly curved surface |
| v, | 3D proper motion of NGC 1265 relative to Perseus, pointing inward |
| “Shock orientation,” angle between LOS and shock normal | |
| “Inclination of the galaxy’s orbit,” angle between negative LOS and galaxy velocity | |
| “Shock obliquity,” angle between negative shock normal and galaxy velocity | |
| Subscripts | Transverse (on the plane of the sky), radial (along LOS) |
| Subscripts | Perpendicular, parallel to shock normal |
| Subscripts 1, 2 | Pre-shock, post-shock regime; refers to quantities of the gas |
In this slightly technical section, we derive the specific geometry that we will use later on to demonstrate the physical plausibility of our proposed model—if the reader is only interested in the physical ideas and results, this section might be easily skipped without loss of the underlying logic of this work.
In general, the location and orientation of the shock surface with respect to the galaxy’s infall velocity vector and the projection geometry of this system are degenerate. Inspired by cosmological simulations that quantify structure formation shocks [45, 35, 22], we take the plausible assumptions that (1) the shock surface is aligned with the gravitational equipotential surface of the Perseus cluster that we determine by taking concentric spheres around NGC 1275 and (2) the second outburst giving rise to the currently observed head-tail structure has started shortly after shock crossing so that we can identify both events.
III.1. Observables and Simple Derived Quantities
III.1.1 The Perseus accretion shock
NGC 1265 has a large radial infall velocity of that has been obtained after subtracting the mean heliocentric velocity of the Perseus cluster of . The Faraday RM across the central few kpc of the two jets [32] show a scatter of around a mean value of around . The scatter is most probably due to the magnetized plasma in the cocoon surrounding the jet or the interstellar medium of NGC 1265 [33]. The low value of RM fluctuations strongly argues for an infalling geometry with NGC 1265 sitting on the near side of Perseus and little Faraday rotating material in between us and the source. This argument strongly favors the picture that the shock that transformed the radio bubble is the accretion shock rather than a merger shock. The strongest argument in favor of this picture would be the identification of the filament along which NGC 1265 was accreted in redshift space. Since NGC 1265 is only 600 kpc offset from the center of the Perseus cluster (in projection), the finger-of-God effect makes it very challenging to isolate a galaxy filament. There is however indirect evidence for such a cosmic filament from Perseus X-ray data. Dark H filaments near the LOS to the core do not show any foreground cluster X-ray emission and have redshifted velocities of around 3000 relative to the Perseus cluster, so they appear to be falling in, too (A. Fabian, private communication).
III.1.2 Electron cooling timescales
The radio synchrotron radiating electrons of Lorentz factor emit at a frequency
| (1) |
where is the elementary charge, is the electron mass, and is the light speed. Synchrotron and inverse Compton aging of relativistic electrons occurs on a timescale
| (2) |
where and is the Thompson cross section. Combining both equations by eliminating the Lorentz factor yields the cooling time of electrons that emit at frequency ,
| (3) |
The highest frequency at which the torus can be observed gives the shortest cooling time for any given magnetic field value. Interestingly, is then bound from above and attains its maximum cooling time at .
III.1.3 Limits on the galaxy’s inclination angle
We denote the projected length on the plane of the sky that the galaxy has traveled since shock crossing by . Looking at the bending of the jet of NGC 1265 [32] and the overall morphology of the tail [47], we conclude that the past orbit of NGC 1265 in the plane of the sky is directed mostly southward. We obtain a lower limit on kpc by measuring the vertical distance of the “head” to the end of the bright radio tail (Figure 1(a) in Sijbring & de Bruyn 47). Assuming that the time of shock passage of the galaxy and the radio bubble coincide, we can obtain a lower limit on the inclination of the galaxy’s with the LOS,
| (4) |
where . We will see that detailed geometric considerations of the overall morphology of NGC 1265 show that there is a time lag between the shock passage of the galaxy and the bubble of that one has to add to such that the limit on the inclination weakens slightly and becomes .
III.2. Geometrical Constraints
It turns out that the morphological richness of NGC 1265 in combination with physical arguments then constrain the geometry and shock properties of this system surprisingly well. To this end, we derive a general expression for the gas velocity after shock passage by taking into account the shock obliquity, , the shock orientation, , and the inclination of the galaxy’s orbit, (see Table 1 for definitions). Using mass and momentum conservation at an oblique shock with a compression factor , the velocities parallel and perpendicular to the shock read as
| (5) | |||||
| (6) | |||||
| (7) |
In order to connect to observables, we derive the velocity components parallel and perpendicular to the LOS,
| (8) | |||||
| (9) | |||||
We will determine the shock compression factor in Section IV based solely on the volume change of the bubble while assuming that the bubble had negligible ellipticity prior to shock crossing.
We employ the following strategy to determine the geometry. (1) We choose the accretion shock radius Mpc since the hot gas within the cluster is unlikely to support a shock with Mach number . (2) A priori, the position of the shock passage of NGC 1265 and its advected radio bubble is unknown. We choose the point where the galaxy passed the shock as the origin of the coordinate system , use the current galaxy’s position as a starting value, and interpolate the past orbits of the galaxy and the tail in the plane of the sky. An iteration of the position of (that involves a complete cycle through the points listed here) quickly converges on a consistent model. Subject to our assumption of the shock surface, this yields the shock normal, , the shock orientation, , and projected orbit that the galaxy has traveled since shock crossing, . (3) Choosing the inclination of the galaxy’s orbit, , determines the 3D velocity vector v and the time since shock crossing, . (4) Momentum conservation at the shock implies for the post-shock gas that its velocity vector lies in the plane that contains and v and is defined by . The intersection of this plane and the plane of the sky (given by for our choice of coordinates) yields the past transverse orbit of the post-shock gas, . (5) Solving Equation (9) for the unknown shock obliquity enables us to derive the current radial position of the galaxy (relative to the cluster center) according to with . (6) We compare the galaxy’s velocity, , to the escape velocity, . For the large radial velocity of , it is not trivial to meet the criterion, , stating that the galaxy is gravitationally bound; hence we prefer small values of and (while still evading the electron cooling bound on as derived in Equation (4)). The head-tail morphology of the jet also argues for a large ram pressure that it can only experience inside and hence for small values of . We finally check whether the model violates any constraints on the shock obliquity as will be derived in Section V.2. If this does not yield a consistent model we vary the shock radius , the inclination of the galaxy’s orbit , and the position of the galaxy’s shock crossing, , and start the next iteration until we arrive at a self-consistent and physically plausible model.

Our final model that fits best these constraints is shown in Figure 3 and has the parameters , Mpc, , , . We find the time since shock crossing of NGC 1265 to be , the Cartesian vector of the shock normal , and the velocity vector for NGC 1265 of (note that we define the Cartesian coordinate system in Figure 3). The galaxy’s velocity has a radial and transverse component of and , respectively, which yields a total velocity of the galaxy, . This is only slightly larger than the escape velocity, , where we used Mpc, , neglect a logarithmic correction factor of the mass and assume a turbulent pressure support of [44, 27, 2]. Note that if one relaxes the escape velocity constraint and assumes that tidal processes are able to dissipate more energy to bind the galaxy during first passage, we find consistent solutions at larger shock radii that nevertheless lie close-by in the parameter space . The choice of the virial radius as the site of the accretion shock might seem to be too small compared to the typical locations inferred from cosmological simulations [31, 24, 35]. However, the location of the accretion shock (in particular along a filament) is not stationary but dynamically determined. Depending on the ram pressure of the accreting material and the post-shock pressure, its position will re-adjust dynamically to account for the conservation laws. We have shown that the velocity of NGC 1265 is quite large which implies a large ram pressure and hence should yield a shock position that lies closer toward the cluster center compared to the shock position where dilute IGM accretes from voids with a considerable smaller density and ram pressure. We note that there have been attempts to constrain the 3D velocity of NGC 1265 based on the observed sharpness of its X-ray surface brightness map and the optical velocity dispersion of the Perseus cluster [48]. To arrive at a lower bound on the orbit inclination, , these authors use an axially symmetric density profile that however does not take into account magnetic draping. This naturally would account for the sharpened interface between the ICM and the interstellar medium and might break the assumed symmetry depending on the morphology of the ambient magnetic field [14, 34].
The post-shock gas velocity—as traced by the radio emitting tail—is reduced at the shock by transferring a fraction of the kinetic to internal energy. For our choice of parameters, we find that divides into the radial and transverse LOS component of the tail as and , respectively. The velocity components parallel and perpendicular to the shock normal are , , and . Once in the post-shock regime, the radio emitting tail and the torus experience the same large-scale velocity field. To explain the observed direction of the bending of the tail toward west, the shock normal needs to have a component pointing westward (for the observed direction of the galaxy’s velocity southward).
What about the orientation of the line connecting the bubble center and NGC 1265 (shown as dashed lines in Figure 3)? Assuming that the spin orientation of the SMBH as possibly traced by the radio jets did not change during shock passage, the previous jet blowing the radio bubbles predominantly had an east-west (EW) component in the plane of the sky. If the jet angle had no component along the LOS, the bubble had crossed the shock earlier than NGC 1265 due to the assumed convex shock curvature. Hence the bubble would need to have been at a larger distance from NGC 1265 than in our model and would have needed a longer time to reach the current position (extrapolating the position back to the shock with the orientation of the deflection vector given by our model). It follows that the shock-enhanced radio emission would have faded away by now and the bubble would have had to spend at least a factor of 2.5 longer in the post-shock region which would not be consistent with the assumed EW alignment of the previous jet axis. Hence our model postulates that the eastern bubble was on the front side relative to the observer and had a smaller LOS than NGC 1265 (see Figure 3). This caused a “two-stage process”: the bubble continued for on its orbit in the filament after NGC 1265 passed the shock until it came into contact with the shock surface. This configuration has the advantage of the faster pre-shock velocity and associated larger length scale in the plane of the sky that the bubble traversed and enables us to fulfill the geometric requirement to cross the shock surface while ending up at current position. After shock passage and its transformation into a torus, it experiences the an almost similar deflection as the tail of NGC 1265 due to the oblique shock passage for the remaining time of until today. This also solves the problem of the non-observation of the “second” bubble that the previous western jet should have blown: in our proposed geometry, this hypothetical bubble was situated westward of NGC 1265 at the far side of the cut plane in Figure 3. It should have passed the shock earlier than the eastern bubble and faded away by now (Equation (3)). Note that the position and morphology of the accretion shock is a function of time: as the radio bubble comes into contact with the shock surface, the shock expands into the light radio plasma toward the observer and attains additional curvature. For simplicity we suppress this effect in our sketch in Figure 3 and place the torus in the lower panel at a distance from the (initial and unmodified) shock surface which should be equal to that of the modified shock surface.
IV. Properties of the Perseus Accretion Shock
Using the 49 cm image of NGC 1265 (Figure 1(a) in Sijbring & de Bruyn 47), we measure the major and minor radius of the torus to and . We only consider orientations that lie in the northern and southern sectors as the elongated appearance toward the EW might be caused by shear flows as we will argue later on in this section. At the distance of Perseus, this corresponds to physical length scales of and , respectively. Assuming that the bubble was spherical before shock crossing and that the major radius did not change [17], we estimate a compression factor through the associated volume change of
| (10) |
The radio plasma is adiabatically compressed across the shock passage according to , where for an ultra-relativistic equation of state. However, the adiabatic index can in principle approach if the bubble pressure is dominated by a hot but non-relativistic ionic component. Varying and , we obtain . Assuming that the radio bubble is in pressure equilibrium with its surroundings before and after shock crossing, this pressure jump corresponds to the jump at the shock. Applying standard Rankine Hugoniot jump conditions [26] of an ideal fluid of adiabatic index yields a shock Mach number of , a density jump of , and a temperature jump of . We assumed a flat prior on the uncertainties of and which yields symmetric error bars around the pressure jump. We quote the jumps in the other thermodynamic quantities corresponding to our mean . These quantities inherit asymmetric error bars due to the non-linear dependence of these jumps on Mach number. We caution that we performed these estimates from the 600 MHz map [47]; future higher resolution and more sensitive radio observations are needed to assess the uncertainties associated with finite beam width and to obtain a more reliable morphology of the low surface brightness regions of the torus.
Extrapolating X-ray profiles of Perseus [10] to Mpc and using our mean values for the jumps in thermodynamic quantities, we can derive pre-shock values for the gas temperature and density that reflect upper limits on the gas properties in the infalling warm-hot IGM as predicted by Battaglia et al. [3]. We find keV, , and . For the cluster temperature profile, we combine the central profile from X-ray data with the temperature profiles toward the cluster periphery according to cosmological cluster simulations [36, 38, e.g.,], yielding
| (11) |
where , , and . This represents the correct temperature profile over the entire range of the cluster when comparing to mosaiced observations by Suzaku (S. Allen, private communication).
We now present evidence for post-shock shear flows with an argument that is based on the projected orientation of the ellipsoidally shaped radio torus whose main axis is almost aligned with the EW direction. We consider two cases. (1) If the ellipticity was due to projection of a ring-like torus, the shock normal could not have components in the EW direction. Since the transverse velocity of the galaxy is pointing southward, momentum conservation at the (oblique) shock would imply a deflection of the post-shock gas in the plane that contains and v—without components in the EW direction. Hence an additional shear flow would be needed to explain the westward bending of the galaxy’s tail even though the smooth and coherent bending of the tail might be difficult to reconcile with the turbulent nature of vorticity-induced shear flows. (2) If the bending of the tail was due to oblique shock deflection, would have to have a component pointing westward. Projecting an intrinsically ring-like torus---aligned with the shock surface---would yield an apparent ellipsoidal torus with the main axis at some angle with the EW direction on the plane of the sky. This argues for a shear flow that realigns the orientation of the ellipsoid with the observed EW direction. In fact, assuming that the shock surface is aligned with the gravitational equipotential surface of the Perseus cluster, one can show that the implied curvature of the shock surface causes a vorticity in the post-shock regime that shears the post-shock gas westward55 5 The sign of the post-shock vorticity is given by the baroclinic term, , which in the top view of Figure 1 (lower panel) points out of the page.. We cannot completely exclude pre-existing ellipticity in the radio bubble but find it very unlikely to be the dominant source of the observed ellipticity as the same directional deflection of the tail structure as well as the radio torus would then be a pure coincidence rather than a prediction of the model.
The observed flattening of the projected radio torus amounts to , where and are the major and minor axes of the ellipse, respectively. With the assumption that the shock surface is aligned with the gravitational equipotential surface and using the result from Section III, the flattening due to projection, , falls short of the observed one calling again for shear flows to account for the difference. The amount of vorticity injected at a curved shock of curvature radius should be proportional to the perpendicular velocity over the bubble radius [28],
| (12) |
where the constant of proportionality depends on the flattening of the torus. Using , , and kpc, we obtain a rough estimate for the curvature radius of the shock of kpc which is also adopted in Figure 3. This is similar to the dimensions of a filament connecting to a galaxy cluster and provides an independent cross-check of our picture.
The ratio of the energy density in the shock-injected vorticity (or shear flow) to the thermal energy density is given by
| (13) |
where and . Interestingly, this value is very close to the turbulent-to-thermal pressure support of at found in cosmological simulations of the formation of galaxy cluster [44, 27, 2]. We caution that our estimates strongly depend on our model assumptions for the orientation and position of the shock surface with respect to the LOS since projection effects of a circular torus could account for a fraction of the observed ellipticity, reduce the shear contribution, and increase the inferred curvature radius. Another complication is the amount of magnetic helicity inside the torus that acts as a stabilizing agent against the shear that tries to distort and potentially disrupts the plasma torus [41, 6].
V. Scrutinising our model of NGC 1265
V.1. Examining the Physics of the Model in Detail
Using results on the shock properties and geometric parameters from Sects. III and IV, we demonstrate the physical feasibility of this model.
V.1.1 The radio bubble and torus
The expansion time of the bubble in the filament (prior to shock passage) is of order the external sound crossing time, , using a a sound speed of the pre-shock region and a bubble radius of . This assumes that the outer radius is unchanged upon transformation into a torus (as suggested by numerical simulations of Enßlin & Brüggen 17) and that equals the minor axis of the ellipse of the projected torus that is unaffected by the shear. We can estimate the energetics of the previous outflow by calculating the work done in inflating the bubble. Using the pre-shock gas pressure of , we obtain using . This fits well inside the range of observed jet energies of FRI sources and implies an equipartition magnetic field in the bubble of G that becomes after shock passage G with ; somewhat higher than G obtained by equipartition arguments applied to the radio flux [47]. The radio synchrotron radiating electrons of Lorentz factor emit at a frequency given by Equation (1). Using a range of magnetic field values of , we require electrons with a post-shock Lorentz factor to explain the observed radio torus at 600 MHz and derive a minimum value of for the upper cutoff of the electron population in order to be able to account for the observed radio emission after shock passage. Synchrotron and inverse Compton aging of fossil electrons in the bubble occurs on a timescale
| (14) |
Calculating the maximum cooling time that the bubble could have been hibernating as given by Equation (14), we show that we meet this criterion for so that the model by Enßlin & Gopal-Krishna [18] applies.
V.1.2 The current outburst and radio tail of NGC 1265
Assuming that the twin tails together constitute a cylinder of radius and projected length , we can estimate the volume for the radio tail of NGC 1265, using . Taking the minimum energy density from Sijbring & de Bruyn [47] in the tail of NGC 1265 to be around we estimate the energy content of the radio tail to be about which nicely coincides with the result that we derived for the previous outburst. The necessary accreted mass to power the outflow amounts to , where we adopted a typical values of for the efficiency parameter. Using the time since shock crossing in our model of , we estimate the jet power of about which is in range of observed jet luminosities of FRI sources. Using the 1.4 GHz flux for NGC 1265 of 8 Jy, we obtain a radio luminosity of , or a 1% radiative efficiency which is plausible.
V.1.3 Estimates from the jet bending
Using the high-resolution VLA observations of the head structure of NGC 1265, O’Dea & Owen [32] give a minimum jet pressure which is about 10 times the ICM estimate at the present position of the galaxy, with (see Sects. III and IV). The jet radius is (360 pc), whereas the projected bending radius of the jet is around (11 kpc), so the physical ratio is when accounting for deprojection and finite resolution effects. Using Equation (A2), this leads to a Mach number ratio of . The temperature estimate at the position of the galaxy is , so that we obtain and eventually . If we take the jet power to be (where is the luminosity of the 2 jets and we assume that most of the jet power is kinetic energy), the power can be expressed in terms of the jet pressure and Mach number as
| (15) |
Since our estimate of , we get which is a typical jet velocity. Solving for the number density of the jet material, we get which is a factor of three larger than the surrounding ICM, and again a plausible value.
V.2. Stability Analysis of the Torus
There are three mechanisms that have the potential to destroy the torus once it has formed; namely, (1) large scale shear flows injected at the shock front, (2) ICM turbulence, and (3) Kelvin-Helmholtz instabilities at the interface due to the vortex flow around the minor circle of the torus. By considering each of these processes separately, we will show that none of them can seriously impact the torus on an eddy turnover timescale of the stabilizing vortex flow,
| (16) |
where denotes the minor circle of the torus, is the post-shock gas velocity parallel to the shock normal, the total velocity of the galaxy, and is the shock obliquity defined in Table 1. Here and in the following, we apply the numerical values of our consistent model as derived in Sects. III and IV. On a timescale larger than , dissipative effects will thermalize the kinetic energy of this stabilizing flow, and eventually external shear flows and turbulence might start to destroy the torus depending on the magnetic helicity and morphology in the torus [41, 6].
(1) The amount of vorticity injected at a curved shock with curvature radius is given by [28]
| (17) |
where is the shock compression factor and is the (post-)shock gas velocity perpendicular to the shock normal. Note that for vorticity injection into an irrotational flow encountering a shock, one necessarily needs a curved shock surface according to Crocco’s theorem [1937]. The generation of vorticity relies on a gradient of either the entropy or stagnation enthalpy along the shock front (perpendicular to the shock normal). This can be easiest seen by considering a homogeneous flow encountering the shock surface at some constant angle (obliquity). It experiences the same “shock deflection” and amount of entropy injection along the shock front. This is because mass and momentum conservation across the shock ensures the conservation of and yields . If the bubble was impacting the shock surface at larger angle, the induced stabilizing vortex flow around the minor circle of radius is accordingly smaller since the perpendicular velocity component cannot contribute to the vortex flow,
| (18) |
We can then derive a criterion for the stability of the torus in the presence of shock injected shear flows, that can be cast into a requirement for the shock obliquity,
| (19) |
Here , as inferred from the observed ellipticity of the torus, and . Since our preferred value of the shock obliquity , the torus can easily be stabilized by the vortex flow around its minor circle against large-scale shear.
(2) To assess the impact of ICM turbulence on the torus’ stability, we compare the turbulent energy density to the kinetic energy density of the torus vortex flow ,
| (20) | |||||
Here, and denote the post-shock energy density and internal energy, denotes the mean molecular weight for a medium of primordial element abundance, and denotes the proton rest mass. To quantify the ratio in our model, we assume a turbulent pressure support relative to the thermal pressure at of around 20% when correcting for the energy contribution due to bulk flows [44, 27, 2]. We furthermore assume that the turbulent energy density is dominated by the injection scale (which should be comparable to the curvature radius at the shock). Using a Kolmogorov scaling of the turbulence, the power per logarithmic interval in scale length is down by another factor of at the minor radius compared to the injection scale . Hence, the energy density of the stabilizing vorticity flow around the minor axis of the torus outweighs any turbulent energy density of the ICM on this scale by a factor of about 25! Equation (20) enables us to solve for the maximum shock obliquity allowed so that the torus is stable against turbulent shear flows,
| (21) |
where and . Interestingly, this is a similar value as obtained in Equation (19) and is another manifestation of our finding that (Equation (13)) implying that a large fraction of post-shock turbulence could have been injected at curved shocks.
(3) We finally show, that the Kelvin-Helmholtz instability at the interface of the torus due to the vortex flow should be suppressed by internal magnetic fields. The shock compression acts mostly perpendicular to the forming toroidal ring. Consequently, the field component parallel to the bubble surface and hence to the surface of the torus is preferentially amplified and dominates eventually the magnetic energy density [17]. Within the torus, we assume equipartition magnetic fields of – which correspond to radio and pressure equipartition values, respectively (Section V.1).66 6 If the magnetic field was sub-equipartition in some regions just below the torus surface, the external vortex flow implies a matching internal vortex flow that acts in piling up the field in a layer just internal to the surface. In principle internal vortex flows could be on small scales as long as the effective internal vorticity matches the external one. However buoyancy of the magnetic field in combination with an effective reshuffling of the magnetic field due to internal vortex flows should give rise to a surface layer filling magnetic field. Assuming the torus to be in pressure equilibrium with the surroundings and a relativistic electron component in the bubble whose pressure is dominated by momenta , we can derive a density contrast between the radio plasma and post-shock density of the ICM,
| (22) |
where . We can now compare the ratio of the Alfvén velocity, , in the surface layer of the torus to the velocity in the vortex flow around the minor circle of the torus, ,
| (23) |
where . In such a configuration, magnetic tension is strong enough to suppress the Kelvin-Helmholtz instability of the vortex flow [9, 13]. To summarize, if the magnetic field is not too far from equipartition values, , then the line of arguments presented here guarantees stability of the torus for at least an eddy turnover timescale .
VI. Discussion and Conclusions
In providing a quantitative 3D model for NGC 1265, we provide conclusive observational evidence for an accretion shock onto a galaxy cluster. The accretion shock is characterized by an intermediate-strength shock with a Mach number of . In the context of the IGM, it appears that even weak to intermediate strength shocks of are able to accelerate electrons as the radio relic in A521 suggests [20]. This supports the view that these intermediate strength shocks are very important in understanding non-thermal processes in clusters; in particular as they are much more abundant than high-Mach number shocks [45, 37, e.g.,]. The presented technique offers a novel way to find large-scale formation shock waves that would likely be missed if we only saw giant radio relics. These are thought to be due to shock-accelerated relativistic electrons at merging or accretion shock waves [16, 1], whereas the discrimination of the two types of shock waves is difficult on theoretical as well as observational grounds [15].
The rich morphology of the large scale radio structure that arches around steep-spectrum tail of NGC 1265 enables a qualitative argument for the need of shear to explain the orientation of its ellipsoidally shaped torus. The energy density of the shear flow corresponds to a turbulent-to-thermal energy density of 14%—consistent with estimates in cosmological simulations. However, simulations are needed to quantify the effect of magnetic helicity internal to the bubble on the torus morphology. In any case, the presence of post-shock shear implies the amplification of weaker seed magnetic fields through shearing motions as well as the generation of magnetic fields through the Biermann battery mechanism if the vorticity has been generated at the curved shock. Even more interesting, the shock passage of multiphase gas with a large density contrast necessarily yields a multiply curved shock surface that causes vorticity injection into later accreted gas on the corresponding curvature scales. Hence, shearing motions are superposed on various scales which implies amplification of the magnetic fields on these scales.
More sensitive polarized and total intensity observations of NGC 1265 are needed to confirm our model predictions with radial polarization vectors of the radio torus and a polarization degree of around 5%. In addition, future observations of different systems similar to NGC 1265 would be beneficial to get a statistical measurement of properties of the accretions shocks and its pre-shock conditions. This provides indirect evidence for the existence of the warm-hot IGM. Our work shows the potential of these kind of serendipitous events as ways to explore the outer fringes of clusters and dynamical features of accretion shocks that are complementary to X-ray observations.
Appendix A Derivation of the jet curvature
Although fairly standard, for completeness we show the derivation of the jet curvature radius that is caused by an external ram pressure wind due to the motion of the galaxy through the ICM. We denote the mass density, velocity, and radius of the jet by , , and , respectively. The two jets coming out of the active galactic core back to back are assumed to be initially a cylinder of length . Each jet is then bent over a bending radius by the ram pressure wind of mass density and velocity and . We equate the jet momentum with the transverse force due to the ram pressure wind that acts over a jet propagation timescale (along the bended path in steady state), , to obtain the following equality
| (A1) |
Solving for the ratio of bending-to-jet radius, we obtain
| (A2) |
where we introduced the Mach numbers of the jet and the galaxy, and , the adiabatic exponents of jet and surrounding ICM, and , and their pressures, and .
Appendix B Derivation of the transformation time of a shocked bubble
When a low-density bubble crosses a shock of speed in the ICM, the shock accelerates into the bubble, pulling post-shock ambient gas with it. The original bubble-ICM CD follows the shock at a speed intermediate to that of the incident and bubble shocks when the incident shock is at least moderately strong. Because the shock intrusion begins sooner and impacts more strongly on the leading edge of a round bubble than its periphery, the ambient gas penetrates the center of the bubble first. An initially spheroidal bubble will then evolve into a torus (vortex ring) on a timescale determined by the crossing time of the CD through the bubble.
The shock-produced dynamics in the bubble can be estimated from the exact solution to the simple 1D Riemann problem of a plane shock impacting a CD. This is found most simply in the initial rest frame of the bubble, which we assume to be in pressure equilibrium with the unshocked ICM and has a density, , with . At impact a forward shock will penetrate into the low density bubble with speed, , while a rarefaction will propagate backward into the post-shock ICM. The bubble-ICM CD will move forward at the same speed as the post-shock flow in the bubble. The full Riemann solution is obtained by matching the pressure behind the forward shock inside the bubble to the pressure at the foot of the rarefaction in the ICM.
We define the ICM and bubble adiabatic indices as and respectively. Assuming the shock is propagating from the left, we have right to left four uniform states, 0, 1, 2, 3, where 0 and 1 are separated by the forward shock, 1 and 2 are separated by the CD, while 2 and 3 are separated by the reverse rarefaction (note that this numbering scheme differs from the main body of the paper). The state “0” represents the initial conditions in the bubble, while “3” represents conditions in the ICM post-shock flow. We set and . The initial bubble (and ICM) pressure is , while the initial bubble and ICM sound speeds are related by . The Mach numbers of the external, ICM shock and the internal, bubble shock are and and we introduced the Mach number ratio .77 7 Note that the variable has a different meaning compared to the main part of the paper where it denotes the mean molecular weight.


From standard shock jump conditions, we have
| (B1) | |||
In addition, the Riemann invariant connecting states 2 and 3 through the rarefaction, along with the relation inside the rarefaction give
| (B2) |
while
| (B3) |
These can be combined to give the following equation for :
| (B4) |
which can be solved numerically for , given , , , and . For , the obvious solution is . For our problem we expect and . This gives
| (B5) |
Equation (B5) is displayed for and in the left panel of Figure 4.
In the strong (external) shock limit, , it is easy to see that approximately . Empirically we find in this limit when that , so that . As , the solution , so also applies. The more general solutions for small to moderate incident shock strengths are shown for two values of as solid curves in Figure 4. The lower bound for is given by and is shown in each case by a dotted curve. We note that the solution shown in Figure 4 is almost identical to the case of , since the internal shock in the bubble is barely supersonic with due to the large sound speed in the bubble. This can be easily seen by taking the ratio of the corresponding solid-to-dotted lines which provides for each external Mach number .
We can understand the general behavior of an increasing shock speed inside a low-density bubble relative to the incident shock speed for smaller Mach numbers by the following line of arguments. For small Mach numbers, both waves are just nonlinear sound waves, so each propagates near the local sound speed, which is much larger in the bubble. It turns out for large Mach numbers that the pressure just behind the penetrating shock is smaller than the external post-shock pressure by a factor that scales with the density contrast . This pressure drop comes from the rarefaction going back into the shocked ICM. For weak shocks that rarefaction is weak (provided the original bubble was in pressure equilibrium).
The right panel in Figure 4 shows the behavior of corresponding to the shock solutions in the left figure panel. In the limit , the expression for in Equation (B1) takes the form . Note that the limit requires the internal bubble (pseudo-) temperature not to be too high and hence implies a lower limit on the bubble density contrast of assuming the original bubble was in pressure equilibrium. Applying our empirical result for strong shocks with (namely, ), we would expect , which is within about 20% of the exact solutions in this limit. This value for is also a reasonable estimate at moderate shock numbers, say . For the limit still applies. As approaches one, however, the speed of the CD drops below the incident shock speed, since as the bubble shock becomes a sound wave, the CD’s motion vanishes. The results of these considerations are quantitatively confirmed by a suite of 2D axisymmetric simulations where we varied the Mach number and initial bubble/ICM density contrast (see Figure 2 for one realization).
For our moderate-strength shock example in Perseus we can use these results to estimate the time for the CD to cross a bubble diameter, , transforming the bubble into a vortex ring, with a toroidal topology; namely,
| (B6) |
Here we adopted our fiducial values of , (Equation (22)), and where we used the sound speed in the pre-shock gas in the infalling filament of temperature and . We emphasize that this estimate is close to the value that we adopted in our model and consistent with the derived the error bars on .
References
- [1] Bagchi, J., Durret, F., Neto, G. B. L., & Paul, S. 2006, Science, 314, 791
- [2] Battaglia, N., Bond, J. R., Pfrommer, C., Sievers, J. L., & Sijacki, D. 2010, ApJ, 725, 91
- [3] Battaglia, N., Pfrommer, C., Sievers, J. L., Bond, J. R., & Enßlin, T. A. 2009, MNRAS, 393, 1073
- [4] Begelman, M. C., Rees, M. J., & Blandford, R. D. 1979, Nature, 279, 770
- [5] Bond, J. R., Kofman, L., & Pogosyan, D. 1996, Nature, 380, 603
- [6] Braithwaite, J. 2010, MNRAS, 406, 705
- [7] Brentjens, M. A. 2011, A&A, 526, A9+
- [8] Burns, J. O. 1998, Science, 280, 400
- [9] Chandrasekhar, S. 1961, Hydrodynamic and hydromagnetic stability, International Series of Monographs on Physics, Oxford: Clarendon
- [10] Churazov, E., Forman, W., Jones, C., & Böhringer, H. 2003, ApJ, 590, 225
- [11] Crocco, L. 1937, Z. angew. Math. Mech., 17, 1
- [12] de Bruyn, A. G., & Brentjens, M. A. 2005, A&A, 441, 931
- [13] Dursi, L. J. 2007, ApJ, 670, 221
- [14] Dursi, L. J., & Pfrommer, C. 2008, ApJ, 677, 993
- [15] Enßlin, T. A. 2006, Science, 314, 772
- [16] Enßlin, T. A., Biermann, P. L., Klein, U., & Kohle, S. 1998, A&A, 332, 395
- [17] Enßlin, T. A., & Brüggen, M. 2002, MNRAS, 331, 1011
- [18] Enßlin, T. A., & Gopal-Krishna. 2001, A&A, 366, 26
- [19] Enßlin, T. A., Simon, P., Biermann, P. L., Klein, U., Kohle, S., Kronberg, P. P., & Mack, K. 2001, ApJ, 549, L39
- [20] Giacintucci, S. et al. 2008, A&A, 486, 347
- [21] Gisler, G. R., & Miley, G. K. 1979, A&A, 76, 109
- [22] Hoeft, M., Brüggen, M., Yepes, G., Gottlöber, S., & Schwope, A. 2008, MNRAS, 391, 1511
- [23] Jones, T. W., & Owen, F. N. 1979, ApJ, 234, 818
- [24] Kang, H., Ryu, D., Cen, R., & Ostriker, J. P. 2007, ApJ, 669, 729
- [25] Kulsrud, R. M., Cen, R., Ostriker, J. P., & Ryu, D. 1997, ApJ, 480, 481
- [26] Landau, L. D., & Lifshitz, E. M. 1959, Fluid mechanics, Course of theoretical physics, Oxford: Pergamon Press
- [27] Lau, E. T., Kravtsov, A. V., & Nagai, D. 2009, ApJ, 705, 1129
- [28] Lighthill, M. J. 1957, Journal of Fluid Mechanics, 2, 1
- [29] Markevitch, M., Gonzalez, A. H., David, L., Vikhlinin, A., Murray, S., Forman, W., Jones, C., & Tucker, W. 2002, ApJ, 567, L27
- [30] Miley, G. K., van der Laan, H., & Wellington, K. J. 1975, A&A, 38, 381
- [31] Miniati, F., Ryu, D., Kang, H., Jones, T. W., Cen, R., & Ostriker, J. P. 2000, ApJ, 542, 608
- [32] O’Dea, C. P., & Owen, F. N. 1986, ApJ, 301, 841
- [33] —. 1987, ApJ, 316, 95
- [34] Pfrommer, C., & Dursi, L. J. 2010, Nature Physics, 6, 520
- [35] Pfrommer, C., Enßlin, T. A., & Springel, V. 2008, MNRAS, 385, 1211
- [36] Pfrommer, C., Enßlin, T. A., Springel, V., Jubelgas, M., & Dolag, K. 2007, MNRAS, 378, 385
- [37] Pfrommer, C., Springel, V., Enßlin, T. A., & Jubelgas, M. 2006, MNRAS, 367, 113
- [38] Pinzke, A., & Pfrommer, C. 2010, MNRAS, 409, 449
- [39] Quilis, V., Ibanez, J. M. A., & Saez, D. 1998, ApJ, 502, 518
- [40] Reiprich, T. H., & Böhringer, H. 2002, ApJ, 567, 716
- [41] Ruszkowski, M., Enßlin, T. A., Brüggen, M., Heinz, S., & Pfrommer, C. 2007, MNRAS, 378, 662
- [42] Ryle, M., & Windram, M. D. 1968, MNRAS, 138, 1
- [43] Ryu, D., Kang, H., & Biermann, P. L. 1998a, A&A, 335, 19
- [44] Ryu, D., Kang, H., Cho, J., & Das, S. 2008, Science, 320, 909
- [45] Ryu, D., Kang, H., Hallman, E., & Jones, T. W. 2003, ApJ, 593, 599
- [46] Ryu, D., Miniati, F., Jones, T. W., & Frank, A. 1998b, ApJ, 509, 244
- [47] Sijbring, D., & de Bruyn, A. G. 1998, A&A, 331, 901
- [48] Sun, M., Jerius, D., & Jones, C. 2005, ApJ, 633, 165
- [49] Tremaine, S. et al. 2002, ApJ, 574, 740