The suppression of hidden order and onset of ferromagnetism in URu2Si2 via Re substitution
Abstract
Substitution of Re for Ru in the heavy fermion compound URu2Si2 suppresses the hidden order transition and gives rise to ferromagnetism at higher concentrations. The hidden order transition of URu2-xRexSi2, tracked via specific heat and electrical resistivity measurements, decreases in temperature and broadens, and is no longer observed for . A critical scaling analysis of the bulk magnetization indicates that the ferromagnetic ordering temperature and ordered moment are suppressed continuously towards zero at a critical concentration of , accompanied by the additional suppression of the critical exponents and towards zero. This unusual trend appears to reflect the underlying interplay between Kondo and ferromagnetic interactions, and perhaps the proximity of the hidden order phase.
pacs
71.27.+a,75.40.Cx,75.60.EjFor well over two decades, the identity of the ordered phase found in URu2Si2 at temperatures below 17 K has eluded researchers. This hidden order (HO) phase coexists with a heavy fermion state, but yields to a superconducting ground state below 1.5 K. In order to develop a better understanding of the HO phase, URu2Si2 has been extensively studied by various techniques, and these efforts have uncovered fascinating behavior under magnetic field, applied pressure, and chemical substitution. We describe the novel phase changes induced by Re substitution for Ru, including the suppression of the HO transition, the nearby emergence of ferromagnetic (FM) order, and the unique critical behavior of this phase.
Chemical substitution studies have been used primarily to investigate the robustness of the HO phase, and substitutions have been made for all three elements in URu2Si2. Replacing U with Th or rare earths quickly suppresses the HO transition temperature [1, 2], emphasizing the critical role of the U f-electrons to the HO phase. In contrast, substitution for Si has no dramatic effects [3]. Most of the neighboring elements of Ru: Mn, Tc, Th, Re, Os, Rh, and Ir have been substituted onto the Ru site, and in all cases except Os, the HO transition is suppressed by about 5% substituent concentration [4, 5, 6].
For a few elements, the phase diagrams at higher concentrations have been studied. In the Rh case, in addition to the HO phase, there are two other nominally antiferromagnetic (AFM) phases, which are separated by nonmagnetic regions [7]. In contrast to the HO, these AFM phases are characterized by a larger moment [8, 9], and a complex magnetic structure exists at intermediate Rh concentrations [10]. A closer examination of the HO phase found that for almost half of the range of Rh concentration over which the HO phase exists, the order is actually AFM [11].
Substituting into URu2Si2 with Re, Tc, or Mn leads instead to ferromagnetic (FM) order [6], whose discovery constituted the first experimental realization of a heavy fermion FM instability. In URu2-xRexSi2, a maximum K is found at , near the concentration limit below which the material remains single phase. The itinerant FM order is characterized by a small moment, with no anomalies in electrical resistivity or specific heat at . Across the Re-substitution series, the heavy fermion state is reflected in an enhanced electronic contribution to the specific heat [4] and a narrow Drude peak in optical conductivity at low temperatures [12]. The long range nature of the FM phase has been confirmed by neutron scattering [13] and 29Si NMR [14]. Within the FM phase, non-Fermi liquid (NFL) behavior is observed in the low-temperature bulk properties [15] and in energy-temperature scaling of the dynamic magnetic susceptibility [16]. The origin of the NFL effects remains an open question, partly because it has been difficult to conclusively define the FM phase boundary. As only polycrystalline samples have been studied so far, it is also necessary to exclude orientational averaging or grain boundary effects as causes for these unusual properties.
Single crystals of URu2-xRexSi2 were synthesized via the Czochralski technique in a tri-arc furnace, and subsequently annealed in Ar. Phase homogeneity was verified by powder x-ray diffraction. Samples were oriented via the back-reflection Laue method and spark cut and sanded to size. Electrical resistivity measurements as a function of temperature were performed in a liquid 4He cryostat. Measurements of magnetization in field were made using a Quantum Design Magnetic Properties Measurement System (MPMS). Measurements of the specific heat were performed in a 3He refrigerator utilizing a semi-adiabatic heat pulse technique.
As seen in Fig. 1, in the vicinity of the HO transition, the data exhibit a small peak, qualitatively similar to that seen in elemental Cr at the ordering transition into a spin density wave. The transition into the HO phase is marked by a large specific heat anomaly, which is related to the incomplete gapping of the Fermi surface in URu2Si2 [17, 18, 19]. The general shape of these anomalies persists despite a suppression of the ordering temperature as increases, suggesting that the transition into the HO state always involves a Fermi surface instability. As Re concentration increases, the anomalies shrink in height and broaden in width, becoming more poorly defined near . For , no HO anomaly can be identified in or .
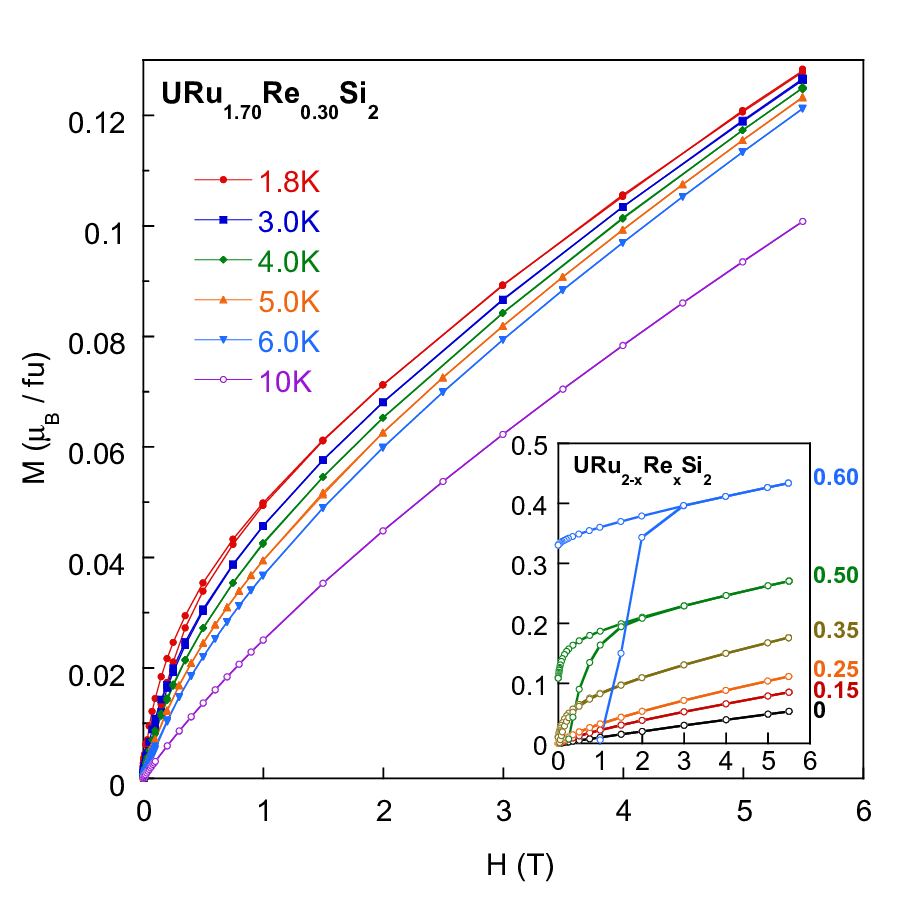
Isotherms of are shown in Fig. 2 for URu1.70Re0.30Si2, which orders ferromagnetically below approximately 5 K. As the Re concentration increases from to , the magnitude of the magnetization increases, the isotherms become more sharply curved and hysteresis develops, which is clearly shown in the inset of Fig. 2. Although the parent compound URu2Si2 exhibits linear in this field range, in URu2-xRexSi2, the isotherms exhibit gentle curvature, which does not saturate. Despite the dramatic increase of the low- magnetization with Re concentration, even at , well within the FM state, the moment is a small fraction of the high-temperature paramagnetic effective moment of approximately 3.8 .
To analyze data from single crystals, a critical scaling approach based on the Arrott-Noakes equation of state [20] has been employed. This approach does not assume mean-field behavior, and yields values of , the ordered moment and the magnetic critical exponents , , and . The three exponents are defined in terms of , , and reduced temperature by for , for , and for . Only two exponents are independent, as . The self-consistent determination of their values requires agreement between three different analyses: an initial estimate of and made by identifying the isotherm with constant power-law behavior over the widest range of ; scaling in vs , i.e., the collapse of data onto two diverging curves, for and ; and modified Arrott plots of vs . Figure 3 exhibits the results of the scaling analysis for the data measured on URu1.70Re0.30Si2. This analysis has been applied successfully to samples with , which demonstrates the existence of FM order in this range of Re concentration [21].
In Fig. 4, it is apparent that the -dependence of the exponents is linear for all , but the -dependence of and can be fit to a line only for . In URu2-xRexSi2, , , and all extrapolate to at . This is the first documented example of such a trend. The critical exponents deviate substantially from mean-field values and values describing classical FM transitions, where and . Near the quantum phase transition, as decreases, as the isotherms (at ) become less curved. Because remains constant, , implying a sharpening of the curvature of the divergent susceptibility at . While this behavior looks like a trend towards a first-order transition, note the simultaneous suppression of the order parameter .
The Re concentration dependence of the HO and FM phases in URu2-xRexSi2 is shown in Fig. 5. Although the HO transition can only be determined for , the HO phase boundary does extrapolate to 0 K near , where it might meet the FM phase at a multicritical point. There is no direct evidence yet that the HO and FM phases meet, but it has been observed that AFM correlations and magnetic excitations associated with the hidden order phase persist to [16]. Such correlations provide a plausible explanation for the unusual critical behavior of the FM ordered phase. Another possible cause is a competition between magnetic order and the heavy fermion state in URu2-xRexSi2. However, the details of this interplay are not certain, nor is it known whether itinerant FM arises from a light band or a heavy band in URu2-xRexSi2. FM Kondo lattice models for both light and heavy magnetic bands are consistent with the measured enhanced specific heat [22, 23]. Also shown in Fig. 5 is the range of over which NFL behavior has been observed [15, 16], which appears to coincide with the FM ordered phase. There is some correlation between the NFL effects and the novel critical behavior: power-law exponents describing unconventional -dependence of the magnetic susceptibility [15] are in good agreement with values of determined by the scaling analysis, implying that they actually describe the same phenomenon.
The overall phase diagram of URu2-xRhxSi2 [10, 11] differs significantly from that of URu2-xRexSi2 (Fig. 5), despite similar suppression of the HO phase at low . Whereas URu2-xRhxSi2 appears to only support AFM order, the long-range magnetic order in URu2-xRexSi2 is FM. The temperature scales differ rather dramatically between the two phase diagrams, as well. In particular, at high Rh concentrations, AFM order sets in at K, whereas in the Re phase diagram, reaches only K. It is interesting that the intermediate AFM phase of URu2-xRhxSi2, characterized by a multi- domain structure [10], persists over roughly the same range as the NFL behavior does in the Re case. The complex magnetic structure in URu2-xRhxSi2 and the AFM-like correlations in the FM phase of URu2-xRexSi2 [16] suggest that in both cases, competing magnetic correlations in this range of play an important role in determining the magnetic structure. An open question is whether the HO phase in URu2-xRexSi2 gives way to an AFM phase, as it does in the Rh case [11].
References
References
- [1] Lopez de la Torre M A, Visani P, Dalichaouch Y, Lee B W and Maple M B 1992 Physica B 179, 208–214.
- [2] Park J-G and Coles B R 1995 Physica B 206 & 207, 418–420.
- [3] Park J-G and Coles B R 1994 J. Phys.: Condens. Matter 6, 1425–1430.
- [4] Dalichaouch Y, Maple M B, Torikachvili M S and Giorgi A L 1989 Phys. Rev. B 39, 2423–2430.
- [5] Dalichaouch Y, Maple M B, Chen J W, Kohara T, Rossel C, Torikachvili M S and Giorgi L 1990 Phys. Rev. B 41, 1829–1836.
- [6] Dalichaouch Y, Maple M B, Guertin, R B, Kuric M V, Torikachvili M S and Giorgi L 1990 Physica B 163, 113–116.
- [7] Miyako Y, Kawarazaki S, Amitsuka H, Paulsen C C and Hasselbach K 1991 J. Appl. Phys. 70, 5791–5793.
- [8] Miyako Y, Kuwai T, Taniguchi T, Kawarazaki S, Amitsuka H, Paulsen C C and Sakakibara T 1992 J. Magn. Magn. Mater. 108, 190–192.
- [9] Kohori Y, Noguchi Y, Kohara T, Asayama K, Amitsuka H and Miyako Y 1992 Solid State Commun. 82, 479–482.
- [10] Kawarazaki S, Kobashi Y, Taniguchi T, Miyako Y and Amitsuka H 1994 J. Phys. Soc. Jpn. 63, 716–725.
- [11] Yokoyama M, Amitsuka H, Itoh S, Kawasaki I, Tenya K and Yoshizawa H 2004 J. Phys. Soc. Jpn. 73, 545–548.
- [12] Thieme St, Steiner P, Degiorgi L, Wachter P, Dalichaouch Y and Maple M B 1995 Europhys. Lett. 32, 367–372.
- [13] Torikachvili M S, Rebelsky L, Motoya K, Shapiro S M, Dalichaouch Y and Maple M B 1992 Phys. Rev. B 45, 2262–2266.
- [14] Kohori Y, Noguchi Y, Kohara T, Dalichaouch Y, Lopez de la Torre M A and Maple M B 1993 Physica B 186–188, 792–794.
- [15] Bauer E D, Zapf V S, Ho P-C, Butch N P, Freeman E J, Sirvent C and Maple M B 2005 Phys. Rev. Lett. 94, 046401.
- [16] Krishnamurthy V V, Adroja D T, Butch N P, Sinha S K, Maple M B, Osborn R, Robertson J L, Nagler S E and Aronson M C 2008 Phys. Rev. B 78, 024413.
- [17] Maple M B, Chen J W, Dalichaouch Y, Kohara T, Rossel C, Torikachvili M S, McElfresh M W and Thompson J D 1986 Phys. Rev. Lett. 56, 185–8.
- [18] Behnia K, Bel R, Kasahara Y, Nakajima Y, Jin H, Aubin H, Izawa K, Matsuda Y, Flouquet J, Haga Y, Onuki Y and Lejay P 2005 Phys. Rev. Lett. 94, 156405.
- [19] Sharma P A, Harrison N, Jaime M, Oh Y S, Kim K H, Batista C D, Amitsuka H and Mydosh J A 2006 Phys. Rev. Lett. 97, 156401.
- [20] Arrott A and Noakes J E 1967 Phys. Rev. Lett. 19, 786–789.
- [21] Butch N P and Maple M B 2009 Phys. Rev. Lett. 103, 076404.
- [22] Perkins N B, Iglesias J R, Núñez-Regueiro M D and Coqblin B 2007 Europhys. Lett. 79, 57006.
- [23] Yamamoto S J and Si Q, cond-mat/0812.0819v1 (unpublished).