Episodic Star Formation Coupled to Reignition of Radio Activity in 3C 236Note: Accepted for Publication in ApJ
Abstract
We present Hubble Space Telescope ACS and STIS FUV/NUV/optical imaging of the radio galaxy 3C 236, whose relic Mpc radio jet lobes and inner 2 kpc CSS radio source are evidence of multiple epochs of AGN activity. Consistent with previous results, our data confirm the presence of four bright knots of FUV emission in an arc along the edge of the inner circumnuclear dust disk in the galaxy’s nucleus, as well as FUV emission cospatial with the nucleus itself. We interpret these to be sites of recent or ongoing star formation. We present photometry of these knots, as well as an estimate for the internal extinction in the source using line ratios from archival ground-based spectroscopy. We estimate the ages of the knots by comparing our extinction-corrected photometry with stellar population synthesis models. We find the four knots cospatial with the dusty disk to be young, of order yr old. The FUV emission in the nucleus, to which we do not expect scattered light from the AGN to contribute significantly, is likely due to an episode of star formation triggered yr ago. We argue that the young yr old knots stem from an episode of star formation that was roughly coeval with the event resulting in reignition of radio activity, creating the CSS source. The yr old stars in the nucleus may be associated with the previous epoch of radio activity that generated the 4 Mpc relic source, before being cut off by exhaustion or interruption. The ages of the knots, considered in the context of both the disturbed morphology of the nuclear dust and the double-double morphology of the “old” and “young” radio sources, present evidence for an AGN/starburst connection that is possibly episodic in nature. We suggest that the AGN fuel supply was interrupted for yr due to a minor merger event and has now been restored. The resultant non-steady flow of gas in the disk is likely responsible for both the new episode of infall-induced star formation and also the multiple epochs of radio activity.
Subject headings
galaxies: active — galaxies: individual (3C 236) — galaxies: starburst — galaxies: jetsI. Introduction

Galaxies occupy a heavily bimodal distribution in color-magnitude space, wherein young, predominantly disk-dominated galaxies reside in a ‘blue cloud’ and evolve onto a characteristically quiescent, bulge-dominated ‘red sequence’ (e.g., bell04, faber07). The underdensity of galaxies in the ‘green valley’ separating these populations implies that cloud-to-sequence evolution is swift, requiring a cessation of star formation more rapid than would be expected in passively evolving systems (e.g., cowie96). Quasar- and radio-mode feedback models have been proposed as mechanisms by which star formation may be truncated by the heating and expulsion of gas [silk98, hopkins05, croton06, schawinski06], as it is now known that quasar activity was two orders of magnitude more common at redshifts than at the present time (e.g., schmidt91). This, considered in the context of declining star formation rates in massive galaxies at (e.g., perezgonzalez07), along with the emerging consensus that most populations of galaxies harbor quiescent black holes at their centers (hereafter BHs, e.g, kormendy95), has given rise to questions of whether all bright galaxies go through one or more active phases (e.g., haehnelt93, cavaliere89). In this scenario, the quenching of star formation via feedback from active galactic nuclei (AGN) may be one of the primary drivers of cosmic downsizing (e.g., cowie96, scannapieco05, and references therein).
The relationship between the AGN duty cycle and the regulation of host galaxy stellar evolution is far more complicated, however, as it can play competing roles at successive stages of galactic evolution. AGN activity has been associated not only with quenching star formation on large scales, but also triggering it via ISM cloud compression from the propagating relativistic jets associated with radio galaxies (e.g, the so-called “alignment effect”, rees89, baum89a, mccarthy93, best00, privon08). Moreover, it is natural to expect a correlated (but not necessarily causal) relationship between AGN activity and star formation. The tight relationship between BH mass and host galaxy bulge velocity dispersion [magorrian98, ferrarese00, gebhardt00] implies that the growth of the BH and the galaxy bulge are tightly coupled (e.g., kauffmann00, ciotti01). It is therefore expected that, throughout the process of hierarchical galaxy formation, gas infall due to major mergers or tidal stripping from a gas-rich companion can fuel not only AGN, but also the growth of the host galaxy stellar component via infall-induced starbursts (e.g., dimatteo05). A significant fraction () of nearby powerful radio galaxies exhibit evidence of infall-induced starbursts near their nuclei [smith89, allen02, baldi08, tremblay09], suggesting that the phenomenon is both common and comperable to the lifetime of the radio source ( yr, e.g., parma99). The AGN/starburst connection is therefore likely real and fundamental to galaxy evolution itself, and its characterization has been a major pursuit of the past two decades (e.g., barnes91, silk98, fabian99, dimatteo05, hopkins05, springel05, silverman08, quillen08a).
A key discriminant in understanding the nature and evolution of the AGN/starburst connection may be found in some radio galaxies whose morphology is clear evidence for multiple epochs of AGN activity. Several such examples have been observed (e.g., 3C 219 – bridle86, clarke92, 0108+388 – baum90), and have come to constitute a new class of “double-double” radio sources, representing % of predominantly large ( Mpc) radio galaxies (e.g., schoenmakers00a, schoenmakers00b). Double-doubles are characterized by outer (‘older’) and inner (‘younger’) radio sources propagating outwards amidst the relic of the previous epoch of activity. This apparently repetitive activity is thought to be a consequence of the AGN fuel supply having been interrupted, whether by exhaustion, smothering, or disturbance, at some time in the past [baum90]. This scenario is consistent with models of radio galaxy propagation (e.g., kaiser00, brocksopp07). The relative ages of the radio sources (and therefore the timescale over which the engine was cut off and re-ignited) can be estimated using size estimates from radio maps coupled with a dynamical model for the jets and radio spectral energy distributions (SEDs) of the radiating electrons [schoenmakers00a, schoenmakers00b, odea01].
I.1. An important test case: 3C 236
The nearby () double-double radio galaxy 3C 236 is an important test case in studies of the AGN/starburst connection, and is the basis of both this paper and a previous study by odea01. 3C 236 is a powerful double-double with a relic edge-brightened FR II [fanaroff74] radio source whose deprojected linear extent exceeds 4 Mpc, making it the second largest known radio galaxy (only J1420-0545 is larger, machalski07), and even one of the largest objects in the universe [schilizzi01]. Its inner young Compact Steep Spectrum (CSS) source, whose apparent origin is cospatial with the nucleus, is only 2 kpc in extent and is morphologically reminiscent of a young classical double. Anecdotally, 3C 236 was initially classified as a pure CSS source before it was associated years later with the massive relic FR II source (R. Laing, private communication). The jet propagation axes of both the Mpc- and kpc- scale sources are aligned to within of one another (as projected on the sky). See Fig. 1 for radio contour overlays of both sources, using 326 MHz Westerbork Synthesis Radio Telescope (WSRT) and 1.66 GHz Global Very Long Baseline Interferometry (VLBI) Network radio mapping from mack97 and schilizzi01 for the relic and CSS sources, respectively.
In addition to its rare radio morphology, 3C 236 is also unique in that its nuclear dust complex is made up of an inner circumnuclear dusty disk that is somewhat misaligned with an apparently separate outer dust lane [martel99, dekoff00, tremblay07]. The total dust mass in the complex is estimated to be M⊙, based on Hubble Space Telescope (HST) absorption maps and IRAS luminosities [dekoff00]. In Fig. 2 we present a m / 0.7 m absorption map of the dust complex, originally presented in tremblay07 and made via division of HST/NICMOS and WFPC2 data from martel99 and madrid06, respectively.

| Observatory | Instrument | Aperture | Filter/Config. | Waveband/Type | Exp. Time [Orbits] | Reference | Obs. Date | Comment |
|---|---|---|---|---|---|---|---|---|
| (1) | (2) | (3) | (4) | (5) | (6) | (7) | (8) | (9) |
| New Observations | ||||||||
| HST | ACS | HRC | F330W | -band Imaging | 2516s [1] | HST 9897 | 21 Oct 2003 | SF Knots |
| HST | ACS | HRC | F555W | -band Imaging | 2612s [1] | HST 9897 | 22 Oct 2003 | Dust Lanes |
| HST | ACS | SBC | F140LP | FUV Imaging | 6900s [3] | HST 9897 | 21 Oct 2003 | SF Knots |
| HST | STIS | NUV-MAMA | F25SRF2 | NUV Imaging | 2520s[1] | HST 9897 | 19 Oct 2003 | SF Knots |
| Archival Observations | ||||||||
| HST | WFPC2 | PC1 | F702W | -band Imaging | 4140s | HST 5476 | 7 May 1995 | Galaxy |
| HST | WFPC2 | PC1 | F555W | -band Imaging | 2300s | HST 6384 | 12 Jun 1996 | Galaxy & Dust |
| HST | STIS | NUV-MAMA | F25SRF2 | NUV Imaging | 1440s | HST 8275 | 03 Jan 1999 | SF Knots |
| HST | NICMOS | NIC2-FIX | F160W | NIR Imaging | 1152s | HST 10173 | 02 Nov 2004 | Host Isophotes |
Note. — A summary of the new and archival observations used in our analysis. (1) Facility name; (2) instrument used for observation; (3) configuration of instrument used; (4) filter used; (5) corresponding waveband and specification of whether the observation was imaging or spectroscopy; (6) exposure time (if the observatory is HST, the corresponding number of orbits also appears in brackets); (7) corresponding reference for observation. If the observatory is HST, the STScI-assigned program number is listed; (8) date of observation; (9) comment specific to observation.


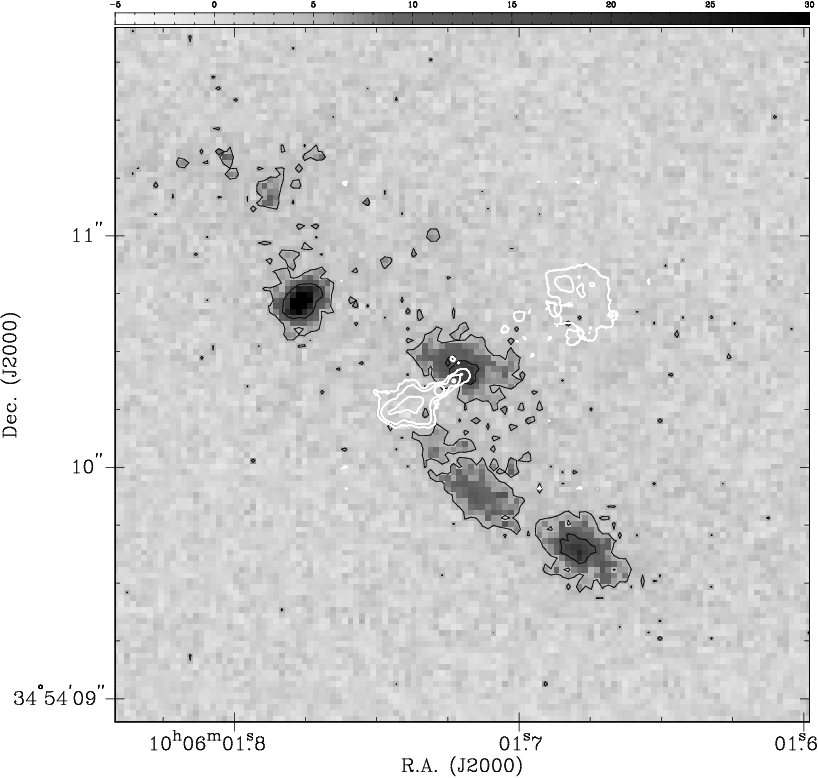
The work by odea01 studied HST NUV and optical imaging of the central few arcsec of 3C 236, finding four knots of blue emission arranged in an arc along the dust lane in the galaxy’s nucleus. Their original NUV data is presented in greyscale with black contours in Fig. 1(b). The lack of an obvious spatial relationship between the knots and the CSS source suggests that the starbursts are infall-induced rather than jet-induced. martel99 had also detected the knots of emission in their HST -band imaging, albeit to a lesser degree as the knots are very blue. odea01 used their photometry in comparison with stellar population synthesis models to estimate upper limits to the ages of the individually resolved star forming knots (seen in Fig. 1b). They found disparate ages between the clumps of emission, finding two to be relatively young with ages of order yr, while the other two were estimated at yr old, comparable to the estimated age of the giant relic radio source. odea01 argued that 3C 236 is an “interrupted” radio galaxy, and has undergone two starburst episodes approximately coeval with the two epochs of radio activity observed on Mpc- and kpc- scales. That work motivated follow-up observations with HST at higher sensitivity and spatial resolution, the results of which we present in this paper.
We organize this work as follows. In section 2 we describe the new and archival data presented in this paper, as well as the associated data reduction. In section 3 we present our results, including a comparison of our photometry with stellar population synthesis models, following (in the interests of consistency) the analysis strategy used in odea01. We discuss our results in section 4, focusing on the role played by the AGN/starburst connection in the special test-case environment of 3C 236. We summarize this work and provide some concluding remarks in section 5. Throughout this paper we use km s-1 Mpc-1, , and .
II. Observations & Data Reduction
We present Hubble Space Telescope observations of the nucleus of 3C 236 obtained as part of the Cycle 12 GO program 9897 by O’Dea and collaborators. These consist of - and -band imaging with the Advanced Camera for Surveys (ACS) High Resolution Channel (HRC), FUV imaging with the ACS Solar Blind Channel (SBC), and NUV imaging with the Space Telescope Imaging Spectrograph (STIS). Below we describe the specifics of each new observation presented in this paper, and provide a brief description of the archival imaging and spectroscopy that we also include in our analysis. We also describe the steps taken to reduce the data. A summary of the new and archival HST observations utilized in this work can be found in in Table 1.
II.1. Cycle 12 ACS and STIS imaging
Our HST/ACS observations were designed to enable high sensitivity multicolor photometry allowing for construction of an SED of the blue knots previously observed in 3C 236 [odea01]. The FUV, NUV, -, and -bands were chosen so as to provide multiple constraints on a young blue stellar population, while also enabling consistency checks and estimates on the amount of intrinsic reddening. At the redshift of 3C 236 (), the - and - bands are located just blue-ward and red-ward of the 4000 Å break, respectively. Exposure times were chosen to permit detection of the knots at adequate signal-to-noise (S/N) over a range of possible ages and intrinsic properties. Three orbits (6900 s) were obtained for the SBC FUV image using the F140LP long pass filter. We obtained one orbit each ( s) for the HRC - and -band images using the F330W and F555W filters, respectively. The F140LP long pass filter on ACS SBC ranges from Å (with a hard cutoff) to Å with a pivot wavelength of 1527 Å. The SBC Multianode Microchannel Array (MAMA) has a spatial resolution of 0034 0030 per pixel and a nominal field of view of 346301. The SBC acheives a peak efficiency of 7.5 at 1250 Å. The F330W and F555W filters on ACS HRC have central wavelengths (filter widths) of 3354 (588) Å and 6318 (1442) Å respectively. The HRC has a pixel scale of 0028 0025 per pixel and its field of view is 29″26″. It reaches a peak efficiency of 29 at Å.
We have also obtained one orbit (2520 s) of NUV imaging with the Cs2Te MAMA detector on STIS. The F25SRF2 filter has a central wavelength of 2320 Å and a FWHM of 1010 Å, which permits geocoronal [o i] Å contamination in its bandpass, though its contribution is far lower than the detector background and is not expected to affect our results. The F25SRF2 cutoff does not permit geocoronal Ly emission. The NUV-MAMA has a pixel scale of 0024 and a field of view of 25″25″.
II.2. Archival data
In this paper we make use of archival HST Wide-Field Planetary Camera 2 (WFPC2) imaging in - and -band (F555W and F702W filters, respectively) obtained as part of the 3CR snapshot programs by Sparks and collaborators [dekoff96, mccarthy97, martel99]. We also use the 1440 s STIS NUV-MAMA F25SRF2 image of 3C 236, which formed the basis of the study by odea01, and was formally presented as part of a data paper by allen02. The -band image obtained with the HST Near-Infrared Camera and Multiobject Spectrograph (NICMOS2) in SNAP program 10173 (PI: Sparks, madrid06, tremblay07, floyd08) was used for fits to the host galaxy isophotes. Imaging and spectroscopy from the Sloan Digital Sky Survey (SDSS) is also used [york00, adelman-mccarthy08].


II.3. Data reduction
The previously unpublished HST data presented in this paper were reduced using the standard On-the-Fly Recalibration (OTFR) pipeline provided as part of the Multi-mission Archive at Space Telescope (MAST). For ACS, the OTFR pipeline combines calibrated and flatfielded dithered exposures using the multidrizzle routine with the default parameters. The task calculates and subtracts a background sky value for each exposure, searches for additional bad pixels not already flagged in the data quality array, and drizzles the input exposures into outputs that are shifted and registered with respect to one another. From these drizzled exposures a median image is created, which is then compared with original input images so as to reject cosmic rays on the drizzled median. More information on the specifics of multidrizzle can be found in koekemoer02.
We have not performed post-pipeline processing on the two one-orbit ACS HRC drizzled images (- and -band), as for the purposes of this work we are concerned primarily with high surface brightness emission near the center of the galaxy, and the results from the OTFR pipeline were sufficiently free of cosmic rays and hot pixels to be deemed “science ready”. For the three-orbit ACS SBC data, we combined the three individual calibrated and flatfielded files manually using multidrizzle with the default parameters. The single 6900s output image was left un-rotated with respect to North so as to avoid associated pixel interpolation errors in our photometry. Information regarding the reduction of the archival data utilized in this paper can be found in the appropriate references cited in section 2.2.
III. Results
In Fig. 3 we present the ACS/HRC -band (at left in red) and ACS/SBC FUV (at right in blue) images in panels (a) and (b), respectively. The two images are aligned and on the same scale, with east left and north up. At the redshift of 3C 236, 1″corresponds to kpc. In Fig. 4(a) we present the same data in Fig. 3 as an overlay, with the FUV contours rendered in black on the -band image for a clearer sense of the spatial relationship between the blue star forming knots (seen in the FUV) and the dust complex (seen in -band). We have labeled each blue knot following the scheme in odea01 to allow for easier comparison of results. In the original STIS NUV image discussed in odea01 (see Fig. 1a), knots “3” and “4” appeared to be separate, individually resolved regions of emission. In our new higher sensitivity and spatial resolution imaging with ACS we detect these two regions as one filament of emission that extends ″. In the interests of consistency we have nonetheless named this region with the two labels “3” and “4” originally assigned in odea01, and will hereafter refer to the filament as “Knot 3+4” when discussing both regions as a whole. As in odea01, we will also refer to the “nuclear” FUV emission, seen in Fig. 4 as the contour cospatial with the nucleus in the underlying -band. In Fig. 4(b) we overplot the STIS S25SRF2 NUV contours on the same -band image (with colors inverted to highlight the continuum deficit due to the outer dust lane). The blue emission is morphologically nearly identical in both the FUV and NUV, although the higher sensitivity (and longer exposure time) of the ACS data is evident in the FUV contours of Fig. 4(a), which map lower surface brightness features than are seen in Fig. 4(b). We utilize the ACS/HRC -band image in our analysis, though do not present the image in a figure as it appears nearly identical to the knots in Figs. 3(b) and 4.
We present an analysis of these new data in the subsections below, framed in the context of past results from odea01.
| FUV Flux | (FUV) | (NUV) | (-band) | ||||
|---|---|---|---|---|---|---|---|
| Source | erg s-1 cm-2 | (mag) | (mag) | (mag) | |||
| (1) | (2) | (3) | (4) | (5) | (6) | (7) | (8) |
| Corrected for Galactic Exctinction | |||||||
| Knot 1 | |||||||
| Knot 2 | |||||||
| Knot 3 | |||||||
| Knot 4 | |||||||
| Knot 3+4 | |||||||
| Nucleus | |||||||
| All | |||||||
| Corrected for Galactic & Internal Extinction | |||||||
| Knot 1 | |||||||
| Knot 2 | |||||||
| Knot 3 | |||||||
| Knot 4 | |||||||
| Knot 3+4 | |||||||
| Nucleus | |||||||
| All | |||||||