Hyperluminous infrared galaxies from IIFSCz
Abstract
We present a catalogue of 179 hyperluminous infrared galaxies (HLIRGs) from the Imperial IRAS-FSS Redshift (IIFSCz) Catalogue. Of the 92 with detections in at least two far infrared bands, 62 are dominated by an M82-like starburst, 22 by an Arp220-like starburst and 8 by an AGN dust torus. On the basis of previous gravitational lensing studies and an examination of HST archive images for a further 5 objects, we estimate the fraction of HLIRGs that are significantly lensed to be 10-30.
We show simple infrared template fits to the SEDs of 23 HLIRGs with spectroscopic redshifts and at least 5 photometric bands. Most can be fitted with a combination of two simple templates: an AGN dust torus and an M82-like starburst. In the optical, 17 of the objects are fitted with QSO templates, several with quite strong extinction. There are 5 objects fitted with galaxy templates in the optical, two of which show evidence for AGN dust tori and so presumably contain Type 2 (edge-on) QSOs. The remaining object is fitted with a galaxy template in the optical, but is of such high luminosity that this classification would be plausible only if there were very strong lensing. 20 of the 23 objects (87) show evidence of an AGN either from the optical continuum or from the signature of an AGN dust torus, but the starburst component is the dominant contribution to bolometric luminosity in 14 out of 23 objects (61 ). The implied star-formation rates, even after correcting for lensing magnification, are in excess of 1000 .
We use infrared template-fitting models to predict fluxes for all HLIRGs at submillimetre wavelengths, and show predictions at 350 and 850 m. Most would have 850 m fluxes brighter than 5 mJy so should be easily detectable with current submillimetre telescopes. At least 15 should be detectable in the Planck all-sky survey at 350 m and all Planck all-sky survey sources with z 0.9 should be IIFSCz sources.
From the luminosity-volume test we find that HLIRGs show strong evolution. A simple exponential luminosity evolution applied to all HLIRGs would be consistent with the luminosity functions found in redshift bins 0.3-0.5, 0.5-1 and 1-2. The evolution-corrected luminosity function flattens towards higher luminosities perhaps indicating a different physical mechanism is at work compared to lower luminosity starbursts. In principle this could be gravitational lensing though previous searches with HST have, perhaps surprisingly, not shown lensing to be widely prevalent in HLIRGs.
Keywords:
infrared: galaxies - galaxies: evolution - star:formation - galaxies: starburst - cosmology: observations1 Introduction
Rowan-Robinson (2000, hereafter RR2000) defined hyperluminous infrared galaxies to be those with bolometric infrared luminosities . He discussed a sample of 39 such galaxies found either by follow-up of the IRAS survey or through submillimetre observations, and modelled the infrared and submillimetre spectral energy distributions (SEDs) for those that were well-observed. Submillimetre observations and more detailed SED models for 13 hyperluminous infrared galaxies (HLIRGs) were reported by Farrah et al (2002a) and ISO data for 4 HLIRGs was discussed by Verma et al (2002). A more detailed SED model for the prototypical HLIRG IRAS F10214+4724 was give by Efstathiou (2006). Recently Ruiz et al (2010) have modelled the SEDs of 13 hyperluminous galaxies which are X-ray sources. Many of these galaxies show evidence of AGN dust torus emission at rest-frame wavelengths 3-30 m, but the submillimetre emission is almost always due to star-formation, an interpretation that is supported by the large gas-masses found in these galaxies (see RR2000 for a summary). 7 of the 39 objects in RR2000 were already known to be gravitationally lensed. A further 9 hyperluminous infrared galaxies were imaged with HST by Farrah et al (2002b), but none were found to be lensed. Even after correction for magnification by gravitational lensing, most of these galaxies imply star formation rates .
Since many of the hyperluminous infrared galaxies in RR2000 were discovered through their submillimetre radiation, it is clearly of interest to consider whether all or most submillimetre galaxies are hyperluminous. Many discussions of the nature of ’submillimetre galaxies’ assume the latter to be the case. However there is growing evidence that the submillimetre population is quite diverse. In their models for the SEDs of a complete sample of 850 m sources from the SHADES survey, Clements et al (2008) find a diverse range of SED types, including M82 starbursts, ’cirrus’ (ie quiescent) galaxies, and AGN dust tori, as well as Arp220-type starbursts. Efstathiou and Rowan-Robinson (2003) have pointed out that the SEDs of as many as half of submillimetre galaxies could be interpreted in terms of a cirrus model. In modelling source-counts from 8-1100 m, and the far infrared and submillimetre background radiation, Rowan-Robinson (2008) concludes that at S(850) = 8 mJy there are approximately equal numbers of M82 and Arp220 starbursts. However cirrus galaxies, in these models, dominate the counts only at S(850) 100 mJy and at S(850) 1 mJy.
The creation of the Imperial IRAS FSC Redshift Catalogue (IIFSCz, Wang and Rowan-Robinson 2009a) gives us the opportunity to define an almost all-sky () catalogue of hyperluminous infrared galaxies, sampled at 60 m. This allows us to study the evolution and luminosity function of this population and to predict what will be seen in submillimetre surveys to be undertaken by Planck and Herschel.
A spatially flat cosmological model with = 0.7, =0.72 has been used throughout.
2 The Catalogue
Our catalogue of hyperluminous IRAS galaxies, with , derived from IIFSCz, contains 179 galaxies. The catalogue, together with the full IIFSCz Catalogue, is available at http:astro.imperial.ac.ukmrrfsshyper.

Of the 25 hyperluminous galaxies in Tables 1 and 2 of RR2000, found from 60 or 850 m surveys, 5 were too weak at 60 m to be detected in the FSS, and 2 lie at . Of the remaining 18, 14 are in the present catalogue, 3 lie just below the limit, and one has had its redshift revised to a lower value. On the basis of the 12 hyperluminous galaxies detected from unbiased IRAS surveys, Rowan-Robinson (2000) estimated that there would be 100-200 such galaxies with S(60) 200 mJy over the whole sky .
Figure 1 shows a plot of versus redshift for IIFSCz galaxies, colour-coded by the dominant infrared template type. Note that in fitting infrared templates we specifically exclude the possibility of an HLIRG having a cirrus template. Of the 92 galaxies with detections in at least two infrared bands, the infrared luminosities of 62 are dominated by an M82-like starburst, 22 by an Arp 220-like starburst, and 8 by an AGN dust torus. Where only one infrared band is available we have estimated the luminosity using an M82 template.
We have spectroscopic redshifts from the literature for 58 (32) HLIRGs, photometric redshifts for the remainder. We have spectroscopic redshifts for 18 out of 46 (39) of galaxies with infrared luminosities, . Four hyperluminous infrared galaxies from this catalogue are known to be gravitationally lensed: F08105+2554=HS0810+2554 (Reimers et al 2002), F08279+5255 (Downes et al 1998), F10214+4724 (Eisenhardt et al 1996) and F14132+1144=H1413+117 (Yun et al 1997). The first of these does not have a lens model, but the other three remain in the hyperluminous category when corrected for their estimated far infrared lensing magnifications of 14, 10 and 10, respectively (see Table 1). We have adopted a far infrared lensing magnification of 10 for F08105+2554 by analogy with the very similar system PG1115+080 (Reimers 2002). A further six hyperluminous galaxies were found by Farrah et al (2002) not to be lensed (F00235+1024, F10026+4949, F12509+3122, F14218+3845, F15307+3252, F16348+7037=PG1634+706). We examined the HST archive images for a further five hyperluminous galaxies ( F01175-2025, F09105+4108, F14165+0642, F09105+4108, F18216+6419) and found no evidence of lensing, though F09105+4108 and F09105+4108 have highly disturbed images indicating a major merger. Thus in the sample for which we have information on lensing, the fraction which are significantly lensed is 4/15 (27). On the basis of the relatively unbiassed search for lensing in HLIRGs by Farrah et al (2002), the fraction of HLIRGs which are significantly lensed may be no greater than 10. However this is clearly a very uncertain estimate and it would be worthwhile searching for new lenses in this sample, especially amongst the galaxies with infrared luminosities, . The lensing rate might be expected to be higher for high redshift (z2) galaxies. There are 20 such galaxies in our catalogue and 3 are already known to be lensed.


3 Spectral energy distributions and predicted submillimetre fluxes
Detailed modelling of SEDs of hyperluminous galaxies was presented by Rowan-Robinson (2000) and Farrah et al (2002b), and the latter presented some new submillimetre observations for 13 hyperluminous galaxies. Efstathiou (2006) has modelled the prototypical hyperluminous galaxy F10214+4724, for which Spitzer IRS data was obtained by Teplitz et al (2006). Figures 2-4 show SEDs for 23 hyperluminous galaxies, which have spectroscopic redshifts and photometric data in at least 5 bands, including at least two infrared bands. Data have been compiled from the literature. Table 1 gives physical parameters for the 23 sources. The columns are: name, redshift, lensing magnification, luminosities in starburst, dust torus, and optical galaxy/QSO components, optical template type, visual extinction, star-formation rate. Luminosities in this table have been corrected for the estimated lensing magnification. 12 have strong AGN dust tori, while 9 show no evidence for a dust torus, though this may be partly because of a lack of observational data at rest-frame wavelengths 3-30 m . In fact the infrared SEDs of all 23 objects can be fitted with mixtures of just two components, an AGN dust torus and an M82 starburst. The model fits in Figs 2-4 broadly agree with the automatic template fits just to IRAS data: the relative luminosities of starburst and dust torus are slightly modified in some cases when fitting to the additional far infrared and submillimetre photometry here. No galaxies with Arp 220 fits in the IIFSCz Catalogue had a sufficient number of photometric bands to be plotted in these figures.
In the optical, 17 of the objects are fitted with QSO templates, three with strong extinction (). There are 5 objects fitted with galaxy templates in the optical, two of which show evidence for AGN dust tori and so presumably contain Type 2 (edge-on) QSOs. The remaining object (F08105+2554) is best fitted with a galaxy template in the optical, but is of such high optical luminosity that this classification would be plausible only if there were very strong lensing. As this is a known quadruple lensed system (Reimers et al 2002), this is a possibility (our estimate of the lensing magnification is 10 - see section 2): a QSO fit is also shown, which fits the optical data but not the JHK data. For F14218+3845 there is a discrepancy between the IRAS fluxes and the 90 m flux measured with ISO. Our preferred model is the more conservative fit to the ISO data. 20 of the 23 objects (87) show evidence of an AGN either from the optical continuum or from the signature of an AGN dust torus, but the starburst component is the dominant contribution to bolometric luminosity in 14 out of 23 objects (61 ). Even if the QSO is not the dominant source of the extreme infrared luminosities, there is clearly a strong case for a link between the very high rates of star-formation implied by these galaxies and the growth of massive black holes (cf Sanders et al 1988, Kauffmann and Haehnelt 2000, Vielleux et al 2009). However it should be borne in mind that restricting the sample of Fig 2 and Table 1 to objects with spectroscopic redshifts inevitably biases the sample towards QSOs.
Our simple dust torus template does not fit the data for F10214+4724, which Efstathiou (2006) suggests is a highly edge-on system. We have used the Efstathiou (2006) edge-on dust-torus model in our fit to F10214+4724 (Fig 3). The J,H,K data for F15415+1633 are brighter than our model predicts, and this is true also for F08105+2554 if a QSO model is preferred for the optical SED. Three strong radio sources which have very flat SEDs and are strongly variable, OJ287, 3C345 and 3C446, have not been included in the SED plots.
For QSOs the ratio of torus luminosity to optical luminosity, , can be interpreted as the dust covering factor (Rowan-Robinson et al 2009). In this sample there are several objects with QSO-like optical SEDs for which is significantly greater than (F10026+4949, F10214+4724, F15307+3253) and for these we must assume that we are seeing only a small fraction of the QSO optical light, probably via scattering off the dust torus (cf Polletta et al 2006).
| object name | z | lensing | type | lg sfr | ||||
|---|---|---|---|---|---|---|---|---|
| magn. | ||||||||
| F00235+1024 | 0.575 | 1 | 13.01 | 11.61 | QSO | 3.31 | ||
| F01175-2025 | 0.810 | 1 | 13.25 | 13.75 | QSO | 3.55 | ||
| F04099-7514 | 0.694 | ? | 13.28 | 14.08 | QSO | 0.20 | 3.58 | |
| F07456+4736 | 2.045 | ? | 14.58 | 13.53 | QSO | 4.88 | ||
| F08105+2554 | 1.510 | 10? | 12.57 | 12.97 | 13.27 | Scd | 3.87 | |
| 12.57 | 12.97 | 13.37 | QSO | 0.4 | 3.87 | |||
| F08279+5255* | 3.912 | 14 | 12.79 | 14.19 | 14.54 | QSO | 0.3 | 4.09 |
| F09105+4108 | 0.442 | 1? | 12.83 | 13.03 | 11.73 | Scd | 3.13 | |
| F10026+4949 | 1.120 | 1 | 13.23 | 13.63 | 11.78 | QSO | 3.53 | |
| F10214+4724* | 2.286 | 10 | 12.85 | 13.04 | 11.50 | QSO | 0.2 | 4.15 |
| F12509+3122 | 0.780 | 1 | 13.04 | 11.99 | 12.89 | QSO | 3.34 | |
| F13279+3402 | 0.360 | ? | 13.01 | 12.31 | Sab | 3.31 | ||
| F14000+0158 | 0.591 | ? | 13.06 | 12.36 | E | 3.36 | ||
| F14132+1144* | 2.546 | 10 | 12.91 | 13.41 | 13.31 | QSO | 0.2 | 4.21 |
| F14165+0642 | 1.437 | 1 | 13.41 | 13.56 | 13.66 | QSO | 0.2 | 3.56 |
| F14218+3845 | 1.205 | 1 | 13.34 | 11.84 | 12.44 | QSO | 3.64 | |
| [14.54(A220) | 12.44 | QSO | 4.84] | |||||
| F14325-0447 | 1.482 | ? | 14.42 | 13.97 | 15.12 | QSO | 4.72 | |
| F15307+3252 | 0.926 | 1 | 13.41 | 12.41 | 12.06 | sb | 0.1 | 3.71 |
| F15415+1633 | 0.850 | ? | 13.01 | 13.36 | 13.41 | QSO | 0.35 | 3.31 |
| F16124+3241 | 0.710 | 1? | 13.00 | 11.63 | Scd | 3.30 | ||
| F16348+7037 | 1.334 | 1 | 13.16 | 13.91 | 14.36 | QSO | 0.1 | 3.46 |
| F18031+7517 | 1.083 | ? | 13.13 | 13.48 | 14.28 | QSO | 1.0 | 3.43 |
| F18216+6419 | 0.297 | 1 | 12.79 | 12.69 | 12.99 | QSO | 3.09 | |
| F21354-1432 | 1.900 | ? | 14.59 | 14.99 | QSO | 1.0 | 4.89 |
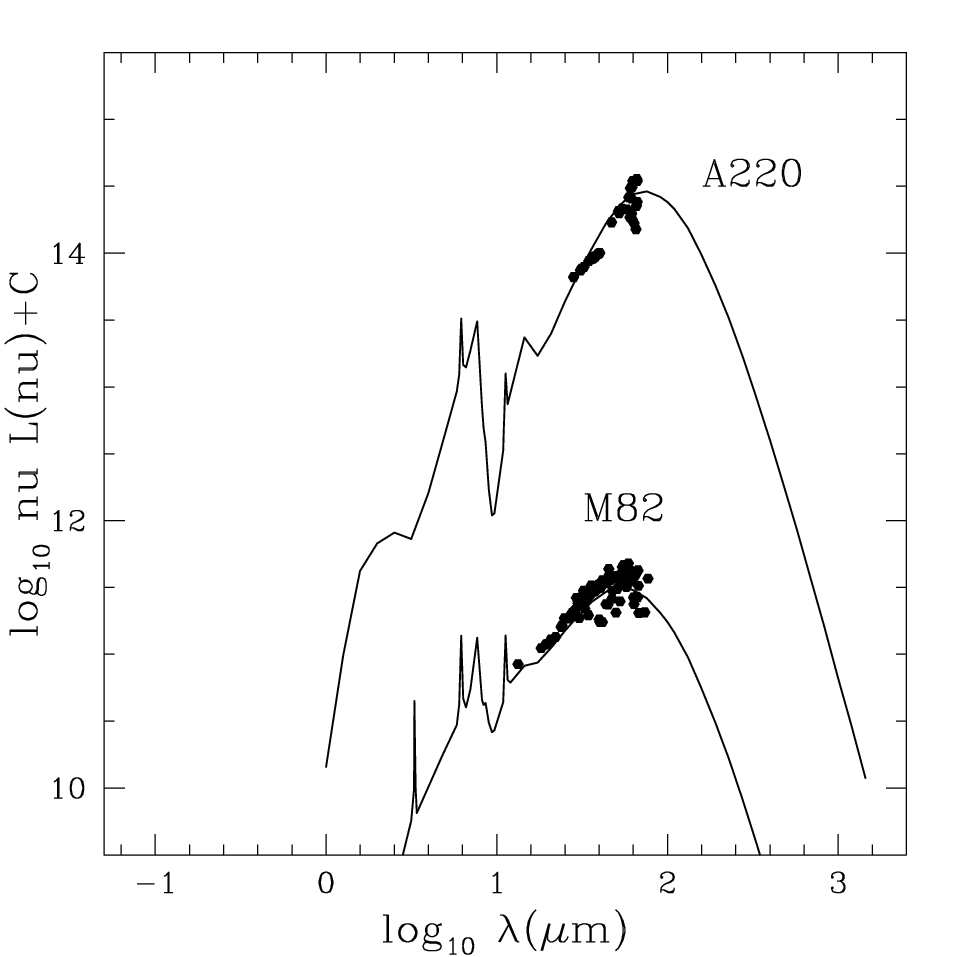
To test the validity of our template fits to the IRAS data we show in Fig 5 composite spectra of HLIRGs, detected in at least two far infrared bands, which select M82 or Arp 220 templates. The distinction between these two SED types appears to be genuine.
Wang and Rowan-Robinson (2009a) fitted four infrared templates to the far infrared SEDs of the whole IIFSCz Catalogue and used these to predict submillimetre fluxes at a range of wavelengths and we have used these template fits to predict 350 and 850 m fluxes, and to investigate evolution. Efstathiou and Rowan-Robinson (2009) have analyzed Spitzer-IRS mid-infrared spectroscopic data for infrared galaxies, in particular the diagnostic diagram of Spoon et al (2006), in terms of sequences of starburst, cirrus (quiescent), and AGN dust tori models. They conclude that infrared template fitting could be improved by including additional templates corresponding to very young and very old starbursts. However the shortage of far infrared photometric data (rarely more than 2 detected bands) for the present sample means this would not be very meaningful at this stage.
We have used our 4-template fits to predict submillimetre fluxes for the IIFSCz catalogue. Figure 6 shows predicted 850 m flux versus z, with hyperluminous galaxies indicated by open squares. Most of the hyperluminous galaxies in our catalogue have predicted 850 m fluxes brighter than 5 mJy and should be easily detectable with current submillimetre telescopes.
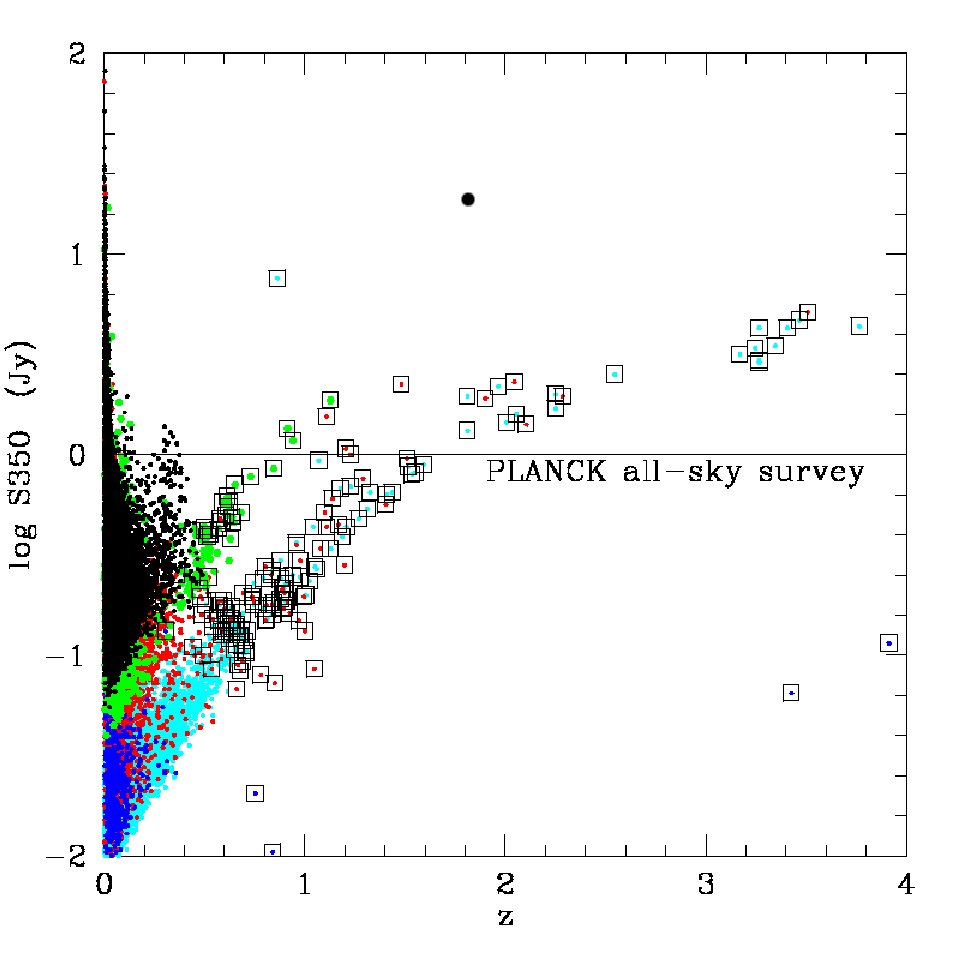
Figure 7 shows predicted 350 mu flux versus z. We have indicated the estimated PLANCK all-sky survey detection limit. Out to z 0.9 all sources detected by Planck would be in the IIFSCz (for ). At least 15 of hyperluminous infrared galaxies in our catalogue should be detectable by PLANCK. Clearly many other luminous infrared galaxies at z 1.0 will also be detected by PLANCK.
Individual flux predictions are very uncertain, since they are based on 25-100 m fluxes and in many cases on 60 m detections only. For example if an M82 starburst is incorrectly classified as an Arp220 type, the submillimetre fluxes and bolometric luminosities can be overestimated by an order of magnitude.

4 Evolution and luminosity functions
To investigate whether there is evidence for evolution in luminous infrared galaxies we first plot infrared luminosity versus comoving volume, Fig 8L. If no evolution was present then in each band of luminosity there would be a uniform distribution of objects with volume (Rowan-Robinson 1968). Clearly for ULIRGs and HLIRGs there is strong evolution. Fig 8R shows the corresponding plot corrected for luminosity evolution with Q = 3.0. The solid curves denote the FSS 90 completeness limit of S60 = 0.36 Jy and only sources brighter than this limit have been included in these plots.


Wang and Rowan-Robinson (2009b) presented luminosity functions for IIFSCz galaxies. Here we focus on the high luminosity end of the luminosity function using the method. For galaxies without an estimate of the best-fitting infrared template, we assume a SED of the form to derive the K-correction term. Figure 9 shows the 60 m luminosity function for IIFSSz galaxies with and Jy, divided into three redshift bins, 0.3-0.5, 0.5-1.0 and 1.0-2.0. The errors are derived from , where each galaxy is weighted by the redshift completeness as a function of 60 micron flux density. Clearly the local 60 micron luminosity function (Wang & Rowan-Robinson 2009b) indicated by the broken curve is not a good description of these ultraluminous and hyperluminous objects due to significant evolution. Figure 10 shows the corresponding luminosity function after correction for luminosity evolution of the form
(1)
with Q = 3.0. This is a higher rate of evolution than that deduced for the whole IIFSCz sample, Q = 1.7 (Wang & Rowan-Robinson 2009b), for z 0.2. A maximum-likelihood approach is also used to estimate the evolution of the luminosity function, following the procedure described in Wang & Rowan-Robinson (2000b). We found a density evolution of the form or a luminosity evolution in the redshift range . For the luminosity function agrees well with the evolution-corrected luminosity function derived at lower luminosities, which is of the form derived by Saunders et al (1990). The evolution-corrected luminosity function then flattens towards higher luminosities, perhaps indicating the presence of a new population or a different physical mechanism is at work. Gravitational lensing is one such possible mechanism but we have argued above that rather few of the hyperluminous galaxies are in fact lensed. The very high star-formation rates in HLIRGs may be indicative of major merger events between massive galaxies. The analysis of star-formation rate versus gas mass deduced from CO observations by Rowan-Robinson (2000, Fig 20) may indicate a shorter time-scale for the starburst ( yrs or less) than in lower luminosity starbursts. The space-density of HLIRGs is .
In Wang and Rowan-Robinson (2009a), two methods were employed to estimate photometric redshifts. For sources with 2MASS J, H and Ks photometry, we choose redshifts given by the neural network training set method. For sources with SDSS ugriz photometry, redshifts derived from the template-fitting technique are preferred. In order to investigate the impact of photometric redshift errors, we carried out a Monte-Carlo analysis by generating random deviations from the estimated photometric redshifts using a Gaussian model with its standard deviation set to in . The value is chosen because this is the worst rms error. We calculated the luminosity function of sources with and Jy for each of the one hundred Monte Carlo simulations created and found that the resulting rms error is several times smaller than the Poisson error. The outlier rate is estimated to be only , but it might have an impact on our derived luminosity function, for example, in the highest redshift bin (), where the total number of galaxies in the two luminosity bins is only three and four, respectively, of which three and two are photometric redshifts.


5 Conclusions
We present a catalogue of 179 hyperluminous infrared galaxies from the Imperial IRAS-FSS Redshift (IIFSCz) Catalogue (Wang and Rowan-Robinson 2009a). 14 of these were included in the analysis of Rowan-Robinson (2000). We use the infrared template-fitting models of Wang and Rowan-Robinson (2009a) to predict fluxes at 350 and 850 m. Most would have 850 m fluxes brighter than 5 mJy so should be readily detectable by current submillimetre telescopes. At least 15 should be detectable in the Planck all-sky survey at 350 m and all Planck all-sky survey sources with z 0.9 should be IIFSCz sources.
From the luminosity-volume test we find that HLIRGs show strong evolution. A simple exponential luminosity evolution applied to all HLIRGs would be consistent with the luminosity functions found in redshift bins 0.3-0.5, 0.5-1 and 1-2. The evolution-corrected luminosity function flattens towards higher luminosities perhaps indicating a different physical mechanism is at work compared to lower luminosity starbursts. In principle this could be gravitational lensing though previous searches with HST have not shown lensing to be widely prevalent in HLIRGs.
Although for an interesting minority of HLIRGs the dominant contribution to the bolometric infrared luminosity is due to an AGN dust torus, star formation appears to be the dominant factor in the overwhelming majority of cases, with star-formation rates 1000 being implied. Even if the duration of these extreme starbursts is shorter than that for less luminous starbursts (Rowan-Robinson 2000), they still represent an extremely interesting and dramatic phase of galaxy evolution.
6 Acknowledgements
We thank Duncan Farrah for helpful discussions. We thank the referee for helpful comments which led to significant improvements in this paper.
References
- [1] Clements D. et al, 2008, MNRAS 387, 247
- [2] Downes D., Solomon P.M., 1998, ApJ 507, 615
- [3] Efstathiou A., 2006, MNRAS 371, L70
- [4] Efstathiou A., Rowan-Robinson M., 2003, MNRAS 343, 322
- [5] Eisenhardt P.R., Armus L., Hogg D.W., Soifer B.T., Neugebauer G., Werner M.W., 1996, ApJ 461, 72
- [6] Farrah D., Verma A., Oliver S., Rowan-Robinson M., McMahon R., 2002a, MNRAS 329, 605
- [7] Farrah D., Serjeant S., Efstathiou A., Rowan-Robinson M., Verma A., 2002b, MNRAS 335, 1163
- [8] Kaufmann G., Haehnelt M., 2000, MNRAS 311, 576
- [9] Planck Science Team, 2005, Planck: The Scientific Programme (Blue Book), ESA-SCI(2005)-1, European Space Agency
- [10] Polletta M.C. et al, 2006, ApJ 642, 673
- [11] Reimers D., Hagen H.-J., Baade R., Lopez S., Tytler D., 2002, AA 382, L26
- [12] Rowan-Robinson M., 1968, MNRAS 138, 445
- [13] Rowan-Robinson M., 2000, MN 316, 995
- [14] Rowan-Robinson M. et al, 2008, MNRAS 386, 687
- [15] Rowan-Robinson M., Valtchanov I., Nandra K., 2009, MN
- [16] Ruiz A., Minuitti G., Panessa F., Carrera F.J., 2010, AA (in press)
- [17] Sanders D.B., Soifer B.T., Elais J.H., Madore B.F., Mathhews K., Neugebauser G., Scoville N.Z., 1988, ApJ 325, 74
- [18] Saunders, W., Rowan-Robinson, M., Lawrence, A., Efstathiou, G., Kaiser, N., Frenk, C.S., 1990, MN 242, 318
- [19] Verma A., Rowan-Robinson M., McMahon R., Efstathiou A., 2002, MNRAS 335, 574
- [20] Vielleux S. et al, 2009, ApJS 182, 628
- [21] Wang L. and Rowan-Robinson M., 2009a, MNRAS 398, 109
- [22] Wang L. and Rowan-Robinson M., 2009b, MNRAS 401, 35
- [23] Yun M.S., Scoville N.Z., Carrasco J.J., Blandford R.D., 1997, ApJ 479, L9