Discovery of Four kpc-Scale Binary AGNs Alternate Affiliation: This paper includes data gathered with the 6.5 meter Magellan Telescopes located at Las Campanas Observatory, Chile, and with the Apache Point Observatory 3.5-meter telescope, which is owned and operated by the Astrophysical Research Consortium. Note: Received 2010 March 10; accepted 2010 April 7; to appear in ApJL
Abstract
We report the discovery of four kpc-scale binary AGNs. These objects were originally selected from the Sloan Digital Sky Survey based on double-peaked [O III] 4959,5007 emission lines in their fiber spectra. The double peaks could result from pairing active supermassive black holes (SMBHs) in a galaxy merger, or could be due to bulk motions of narrow-line region gas around a single SMBH. Deep near-infrared (NIR) images and optical slit spectra obtained from the Magellan 6.5 m and the APO 3.5 m telescopes strongly support the binary SMBH scenario for the four objects. In each system, the NIR images reveal tidal features and double stellar components with a projected separation of several kpc, while optical slit spectra show two Seyfert 2 nuclei spatially coincident with the stellar components, with line-of-sight velocity offsets of a few hundred km s-1. These objects were drawn from a sample of only 43 objects, demonstrating the efficiency of this technique to find kpc-scale binary AGNs.
Subject headings
black hole physics – galaxies: active – galaxies: interactions – galaxies: nuclei – galaxies: Seyfert – quasars: generalI. Introduction
Despite decades of searching, and strong theoretical reasons to believe they exist, merging active supermassive black holes (SMBHs) remain difficult to find. Here we present the first four secure candidates from our ongoing search for kpc-scale binary11 1 We refer to both a bound pair of SMBHs in a Keplerian orbit, and a pair of SMBHs at large separations where the galactic potential dominates, as binaries. AGNs.
It is widely appreciated that galaxies are built up hierarchically via mergers [36]. Since most massive galaxies are believed to harbor a central SMBH [24], galaxy mergers would result in the formation of binary SMBHs [5, 27]. Major mergers between galaxies are responsible, at least in some models, for triggering black hole accretion activity in the most luminous AGNs. Merger-based models do a decent job of fitting observational data on local SMBH demographics and AGN statistics at different cosmic epochs [19, 39, 42, 18, 32, e.g.,], and on the core properties of elliptical galaxies [11, 23, e.g.,], but direct observational evidence for binary SMBHs remains surprisingly scarce [22, 6, 31, 8, 13, e.g.,].
Gerke et al. [12] and Comerford et al. [7] reported two binary-AGN candidates in the DEEP2 galaxy redshift survey [10], which show spatially resolved (on kpc scales) double-peaked [O III] emission with velocity offsets of a few hundred . We have selected a similar sample of 167 double-peaked [O III] narrow-line AGNs (see also Smith et al. 34 and Wang et al. 40 for similar statistical studies, as well as work on individual interesting objects, e.g. Xu & Komossa 43) from the Seventh Data Release of the Sloan Digital Sky Survey [44, 1, SDSS;] and studied their host-galaxy and emission-line properties and selection completeness [25]. The double-peaked features could be due either to narrow-line region (NLR) kinematics such as outflows or rotating disks [2, 38, 9, e.g.,], or to a pair of AGNs. To discriminate between these scenarios for individual objects and to identify bona fide AGN pairs, we are conducting deep near-infrared (NIR) imaging and spatially resolved optical spectroscopy for the objects in the double-peaked narrow-line sample. Here we report initial results on the discovery of four binary AGNs, SDSSJ, SDSSJ, SDSSJ, and SDSSJ. Deep NIR imaging revealed double stellar bulges in SDSSJ, SDSSJ, and SDSSJ, while SDSSJ’s SDSS image shows clear evidence of a recent merger. We have obtained slit spectroscopy of all four sources. We describe our observations data analysis in §§II.1-II.2, followed by discussion of the nature of the ionizing sources in §II.3. We discuss our results and conclude in §III. A cosmology with , , and is assumed throughout.
II. Observations and Data Analysis
II.1. NIR Imaging


We obtained and images for SDSSJ, a image for SDSSJ, and a image for SDSSJ on the nights of 2009 December 29 through 2010 January 2 UT using the Persson’s Auxiliary Nasmyth Infrared Camera [26, PANIC;] on the 6.5 m Magellan I (Baade) telescope. PANIC has a field of view (FOV) and 0″.126 pixels. The observing conditions were clear but not photometric, with seeing ranging between 0″.5 and 0″.8 in the optical. Exposure times were 1080 s and 2160 s in for SDSSJ and SDSSJ respectively, and 1080 s in for both SDSSJ and SDSSJ. We reduced PANIC data with the Carnegie Supernova Project pipeline [15] following standard procedures.
Figure 1 shows the image for SDSSJ from 2MASS [33], and the images for SDSSJ and SDSSJ and the image for SDSSJ. Also presented are the SDSS -band images to illustrate the galaxy-scale environment and tidal features. The NIR images show two stellar bulges in each of these systems. In addition, all four systems show tidal features suggestive of mergers. For SDSSJ, this is clearly seen in its SDSS image; in SDSSJ, SDSSJ, and SDSSJ, the SDSS images show tentative tidal features which are confirmed in deep PANIC images. The PANIC image of SDSSJ also reveals a small companion (3″west to the nuclei) which is barely resolved in its SDSS image. The two stellar nuclei in SDSSJ appear marginally resolved in the center; their SDSS counterparts exhibit different colors which could indicate different stellar populations or dust effects. We performed aperture photometry for the two stellar nuclei to infer their luminosity ratio. Table 1 lists the estimated luminosity ratios in or in . Assuming similar mass-to-light ratios in the two stellar nuclei, they all appear to be major mergers with comparable stellar masses. Also listed in Table 1 are the projected separation , the stellar mass of the whole galaxy estimated based on SDSS photometry [20], and the 2MASS magnitudes and colors.
II.2. Optical Slit Spectroscopy


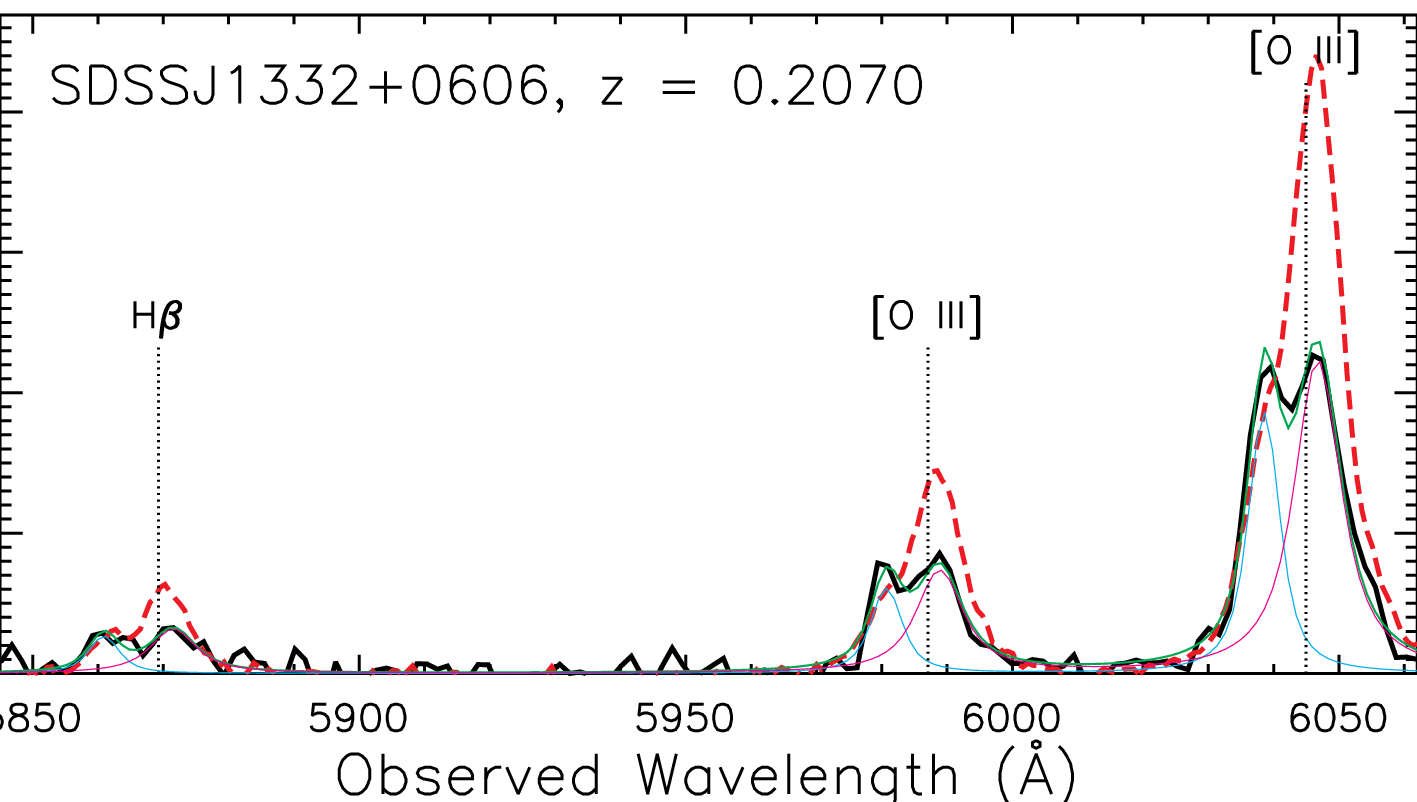
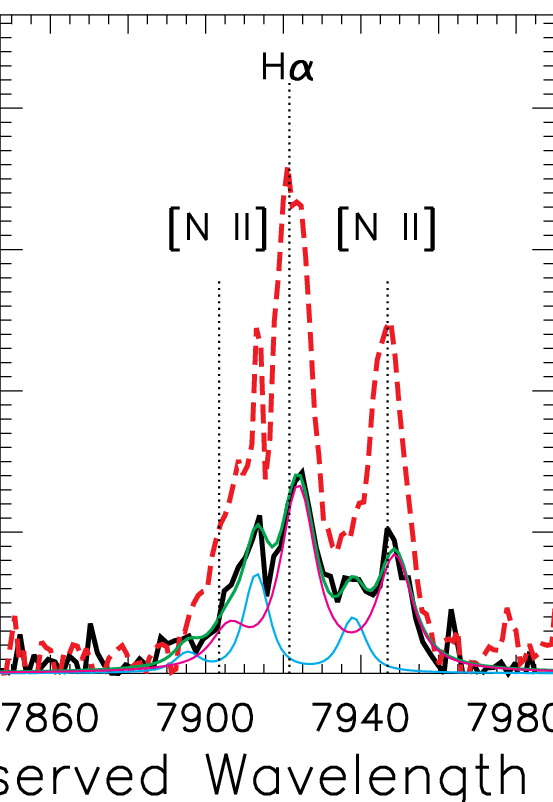
Because of the lack of spatial information in the SDSS spectra, it is unclear whether the two velocity components seen in [O III] are spatially associated with the two stellar bulges. To resolve this question we obtained slit spectra for SDSSJ, SDSSJ, and SDSSJ on the nights of 2010 January 12 through 14 UT using the Low-Dispersion Survey Spectrograph (LDSS3) on the 6.5 m Magellan II (Clay) telescope. The observing conditions were clear but not photometric, with seeing ranging between 0″.7 and 1″.1. LDSS3 has a 8′.3 diameter FOV and 0″.188 pixels. We employed a 14′ long-slit with the VPH-Blue grism to cover H and [O III] 4959,5007, and the VPH-Red grism (with the OG590 filter) to cover H and [N II]. We oriented the slit to go through the two stellar bulges seen in the NIR images (with PA = 141∘, 80∘, and 17∘ for SDSSJ, SDSSJ, and SDSSJ respectively). The spectral resolution was 3.1 (6.3) Å FWHM in the blue (red). Total exposure times were 4800s, 6300s, and 4500s for SDSSJ, SDSSJ, and SDSSJ respectively in the blue, and 1800s for all three objects in the red. We took wavelength calibration spectra and flat fields after observing each object. We obtained spectra for SDSSJ on the night of 2010 February 15 UT using the Dual Imaging Spectrograph (DIS) on the Apache Point Observatory 3.5 m telescope. The sky was photometric, albeit with poor seeing ranging between 1″.7 and 2″.7. DIS has a 46′ FOV and 0″.414 pixels. We adopted a 1″.56′ slit and the B1200+R1200 gratings centered at 5500 and 7450 Å. The slit was oriented with PA to go through both bulges shown in the SDSS image. The spectral resolution was 1.8 (1.3) Å FWHM in the blue (red). The total exposure time was 4800s. We reduced the DIS and LDSS3 data following standard IRAF22 2 IRAF is distributed by the National Optical Astronomy Observatory, which is operated by the Association of Universities for Research in Astronomy (AURA) under cooperative agreement with the National Science Foundation. procedures [35] and with the COSMOS reduction pipeline33 3 http://www.ociw.edu/Code/cosmos. We observed white dwarfs EG21 and G191B2B for spectrophotometric calibration. We applied a telluric correction from our standard stars after extracting 1D spectra.
The spatial correspondence between the two stellar continuum peaks and two [O III] velocity peaks in all cases strongly indicates we are seeing two active galaxies (Figure 2). We see unambiguous spatial separations between the red and blue velocity components in all targets and in each strong emission line. We measure this spatial offset, , from a spatial profile summed over twice the FWHM of each line (although we combine H and [N II] due to blending). We also checked these results by directly examining the 2D flux-density profile of each velocity component. The spatial offsets derived from each strong line [H, [O III] 4959, [O III] 5007 ( in Table 1), and the H-[N II] region ( in Table 1)] agree within 0″.3. Note in the case of SDSSJ, the [O III] 4959,5007 lines fall in the dichroic edge and are poorly detected in the redshifted component44 4 In SDSSJ, the blueshifted component itself shows double peaks which also appear spatially offset from one another; our measurements for the blueshifted component represent the luminosity-weighted average of both peaks. The redshifted component overlaps with the redshifted peak of the blueshifted component in velocity space, and we extracted 1D spectra for the two components separately to disentangle them properly., but the spatial separation is clearly measured in the H and [N II] lines. The separation between the two velocity components of the emission lines is consistent with that of the double stellar bulges ( in Table 1). More directly, the emission lines are coincident with the stellar continua seen in the spectra. This spatial coincidence suggests that the double-peaked emission line profiles in the SDSS spectra of these objects are due to the orbital motion of the gas associated with the double stellar bulges. This is further supported by the tidal features indicative of mergers seen in all four systems (§II.1, Figure 1).
II.3. The Nature of the Ionizing Sources

| SDSS Designation | Redshift | (′′) | (kpc) | (′′) | (′′) | |||||||||
|---|---|---|---|---|---|---|---|---|---|---|---|---|---|---|
| (1) | (2) | (3) | (4) | (5) | (6) | (7) | (8) | (9) | (10) | (11) | (12) | (13) | (14) | (15) |
| SDSSJ. | 0.1816 | 11.0 | 14.29 | 0.8 | 1.3 | 0.5 | 1.5 | 1.0 | 8.58 | 7.94 | 0.9 | 0.6 | 2.4 | 2.4 |
| SDSSJ. | 0.1463 | 11.3 | 14.51 | 1.0 | 1.3 | 0.6 | 1.5 | 1.8 | 7.81 | 7.72 | 0.6 | 0.6 | 2.7 | -0.3 |
| SDSSJ. | 0.1300 | 10.9 | 14.32 | 1.0 | 1.4 | 2.7 | 6.3 | 0.9 | 8.35 | 7.79 | 2.5 | 2.8 | 3.1 | 2.9 |
| SDSSJ. | 0.2070 | 11.1 | 14.72 | 1.2 | 1.6 | 1.5 | 5.1 | 1.6 | 7.48 | 8.25 | 1.6 | 1.6 | 2.8 | 2.4 |
Note. — The subscripts “1” and “2” denote blueshifted and redshifted components. Col. 3: total stellar masses in the form of log() for the whole galaxy based on SDSS photometry from Kauffmann et al. [20]; Col. 4: from 2MASS; Col. 5: color from SDSS photometry; Col. 6: color from 2MASS; Cols. 7 & 8: projected separation based on NIR imaging; Col. 9: (for SDSSJ) or -band (for the others) luminosity ratio of the two stellar bulges estimated with aperture photometry; Cols. 10 & 11: blueshifted and redshifted [O III] 5007 component luminosities in the form of log() ; Col. 12: projected spatial offset measured from [O III] 5007; Col. 13: projected spatial offset measured from H and [N II]; Cols. 14 & 15: electron density in the form of log() of the blueshifted and redshifted components.
The nature of the ionizing source in each object is constrained using the BPT diagram [3, 37] featuring the emission line ratios [O III] 5007/H and [N II] 6584/H (Figure 3). We fit multi-component models to the emission lines over the stellar-continuum subtracted LDSS3 and DIS spectra [refer to 25, for details on constructing continuum models and emission line fitting] and measured line ratios. For SDSSJ, SDSSJ, and SDSSJ, we extracted 1D spectra summing over both velocity components as they are partially blended spatially, whereas for SDSSJ we extracted 1D spectra separately for each of the two velocity components. We compared measurements based on the SDSS and the LDSS3 and DIS spectra and found general agreement in the line ratios; the difference in line fluxes is likely due to the difference in the fiber and slit coverage. Figure 2 (bottom panels) shows an example of our emission line fits and of the difference in SDSS and slit spectra. In all cases, the diagnostic line ratios indicate Seyfert-type ionization (except for the redshifted component in SDSSJ, which could also be a LINER or a composite). Table 1 lists [O III] 5007 luminosities for both velocity components based on our LDSS3/DIS spectra.
While the diagnostic line ratios indicate the presence of hard ionizing photons, it is ambiguous whether there are two ionizing sources. If only one nucleus were to ionize both gas components, the ionization parameter in the off-nuclear region would be much lower than that in the nuclear region with similar electron densities, because the number density of ionizing photons decays as . We measured electron densities using the diagnostic line ratio [S II] 6717/[S II] 6731. For SDSSJ, SDSSJ, and SDSSJ, we found comparable values in the two velocity components (Table 1). The comparable electron densities and high ionization states (Figure 3) in both narrow line components suggest that there are separate hard ionizing sources associated with each line component. For SDSSJ, the inferred of the redshifted component is 1000 times smaller than the blueshifted component, but the uncertainties of the measurement are so large that they may differ by no more than a factor of 10. Considering typical values of narrow-line region gas in stellar bulges, in SDSSJ the comparable and high [O III] 5007/H ratios may still argue for separate ionizing sources, but it is possible that the nucleus associated with the blueshifted component is ionizing both velocity components. Chandra observations would clarify the situation considerably. To summarize, our imaging and spectroscopy data strongly support the binary AGN scenario for at least three of the four objects.
III. Discussion
As listed in Table 1, the four new kpc-scale binary AGNs that we have presented here have optical colors typical of type 2 AGNs [20, e.g.,]. All four objects show tidal features suggestive of mergers (§II.1, Figure 1). Among them, SDSSJ was detected (but unresolved) in FIRST with an integrated flux of mJy [41]; it also has a candidate match in the IRAS Faint Source Catalog [28], IRAS F11062+0715, with , although the positional match is only marginal (9.5″offset from its SDSS position). SDSSJ, SDSSJ, and SDSSJ were not detected in FIRST or in IRAS. At least three of the four galaxies appear to be neither star-bursting luminous IR galaxies (LIRGs) nor passively evolving ellipticals. These properties are in contrast to the few existing samples of known kpc-scale binary AGNs, which tend to be found either in LIRGs which involve gas-rich mergers of disks (NGC 6240, Komossa et al. 22; Mrk 463, Bianchi et al. 6; Arp 299, Ballo et al. 4), or in ellipticals at the centers of galaxy clusters and power twin jets (3C 75, Owen et al. 30; PKS 2149-158, Guidetti et al. 14). Perhaps this reflects our differing selecting criteria, but we are hopeful that with our systematic approach we can begin to characterize the evolutionary state of kpc-scale binary AGNs in more detail. Further host galaxy studies on these four binary AGNs including their structural properties, stellar populations, and dynamics, as well as the remainder of our NIR imaging subsample will be presented elsewhere.
Until recently, searches for kpc-scale binary AGNs have been more or less serendipitous. We have demonstrated with the observations presented in this paper that selecting spectroscopic candidates based on double-peaked narrow lines and follow-up with high spatial resolution imaging and spectroscopy is a promising technique to identify genuine binary AGNs in an efficient and systematic way. Out of the 43 objects observed so far, we detected three, and perhaps four binary AGNs ( 7–10%). These four systems probe the relatively early stages of AGN pairing, when the two stellar bulges which host the two SMBHs are still separated enough to show two distinct components in IR/optical images. The lower limit translates into a 0.1% kpc-scale binary AGN fraction out of the parent AGN sample [25, 167 double-peaked objects selected from 14,756 AGNs], comparable to the binary quasar fraction with projected separations of tens of kpc [17, 29, 16], albeit with different systematics and potential selection biases. We also have objects in our sample in which the [O III] emission is spatially resolved but the NIR continuum is not, and in a few such cases the spatially-resolved spectrum shows clear signs of a velocity gradient across the slit, suggesting a rotation/outflow origin for the double-peaked profile. Thus it is premature to claim a binary AGN based on spatially-resolved [O III] emission alone. A detailed analysis on the fraction of such “false positives” and their properties will be presented in a future paper.
We are carrying out NIR imaging of the rest of our double-peaked narrow-line sample using Magellan and Keck with AO. Together with follow-up spectroscopy, we expect to increase the number of known kpc-scale binary AGNs several fold. High-quality multi-band data will allow us to explore the properties of individual binary AGNs in great detail, and the increased statistics will provide important constraints on the merger hypothesis, AGN lifetimes, and the interplay between SMBHs and their hosts.
References
- [1] Abazajian, K. N., et al. 2009, ApJS, 182, 543
- [2] Axon, D. J., Marconi, A., Capetti, A., Maccetto, F. D., Schreier, E., & Robinson, A. 1998, ApJ, 496, L75
- [3] Baldwin, J. A., Phillips, M. M., & Terlevich, R. 1981, PASP, 93, 5
- [4] Ballo, L., Braito, V., Della Ceca, R., Maraschi, L., Tavecchio, F., & Dadina, M. 2004, ApJ, 600, 634
- [5] Begelman, M. C., Blandford, R. D., & Rees, M. J. 1980, Nature, 287, 307
- [6] Bianchi, S., Chiaberge, M., Piconcelli, E., Guainazzi, M., & Matt, G. 2008, MNRAS, 386, 105
- [7] Comerford, J. M., et al. 2009a, ApJ, 698, 956
- [8] Comerford, J. M., Griffith, R. L., Gerke, B. F., Cooper, M. C., Newman, J. A., Davis, M., & Stern, D. 2009b, ApJ, 702, L82
- [9] Crenshaw, D. M., Schmitt, H. R., Kraemer, S. B., Mushotzky, R. F., & Dunn, J. P. 2010, ApJ, 708, 419
- [10] Davis, M., et al. 2003, in Society of Photo-Optical Instrumentation Engineers (SPIE) Conference Series, ed. P. Guhathakurta, Vol. 4834, 161–172
- [11] Faber, S. M., et al. 1997, AJ, 114, 1771
- [12] Gerke, B. F., et al. 2007, ApJ, 660, L23
- [13] Green, P. J., Myers, A. D., Barkhouse, W. A., Mulchaey, J. S., Bennert, V. N., Cox, T. J., & Aldcroft, T. L. 2010, ApJ, 710, 1578
- [14] Guidetti, D., Murgia, M., Govoni, F., Parma, P., Gregorini, L., de Ruiter, H. R., Cameron, R. A., & Fanti, R. 2008, A&A, 483, 699
- [15] Hamuy, M., et al. 2006, PASP, 118, 2
- [16] Hennawi, J. F., et al. 2009, ArXiv e-prints, 0908.3907
- [17] —. 2006, AJ, 131, 1
- [18] Hopkins, P. F., Hernquist, L., Cox, T. J., & Kereš, D. 2008, ApJS, 175, 356
- [19] Kauffmann, G., & Haehnelt, M. 2000, MNRAS, 311, 576
- [20] Kauffmann, G., et al. 2003, MNRAS, 346, 1055
- [21] Kewley, L. J., Dopita, M. A., Sutherland, R. S., Heisler, C. A., & Trevena, J. 2001, ApJ, 556, 121
- [22] Komossa, S., Burwitz, V., Hasinger, G., Predehl, P., Kaastra, J. S., & Ikebe, Y. 2003, ApJ, 582, L15
- [23] Kormendy, J., & Bender, R. 2009, ApJ, 691, L142
- [24] Kormendy, J., & Richstone, D. 1995, ARA&A, 33, 581
- [25] Liu, X., Shen, Y., Strauss, M. A., & Greene, J. E. 2010, ApJ, 708, 427
- [26] Martini, P., Persson, S. E., Murphy, D. C., Birk, C., Shectman, S. A., Gunnels, S. M., & Koch, E. 2004, in Society of Photo-Optical Instrumentation Engineers (SPIE) Conference Series, ed. A. F. M. Moorwood & M. Iye, Vol. 5492, 1653–1660
- [27] Milosavljević, M., & Merritt, D. 2001, ApJ, 563, 34
- [28] Moshir, M., Kopman, G., & Conrow, T. A. O. 1992, IRAS Faint Source Survey, Explanatory supplement version 2, ed. Moshir, M., Kopman, G., & Conrow, T. A. O.
- [29] Myers, A. D., Richards, G. T., Brunner, R. J., Schneider, D. P., Strand, N. E., Hall, P. B., Blomquist, J. A., & York, D. G. 2008, ApJ, 678, 635
- [30] Owen, F. N., O’Dea, C. P., Inoue, M., & Eilek, J. A. 1985, ApJ, 294, L85
- [31] Rodriguez, C., Taylor, G. B., Zavala, R. T., Peck, A. B., Pollack, L. K., & Romani, R. W. 2006, ApJ, 646, 49
- [32] Shen, Y. 2009, ApJ, 704, 89
- [33] Skrutskie, M. F., et al. 2006, AJ, 131, 1163
- [34] Smith, K. L., Shields, G. A., Bonning, E. W., McMullen, C. C., & Salviander, S. 2009, ArXiv e-prints 0908.1998
- [35] Tody, D. 1986, in Society of Photo-Optical Instrumentation Engineers (SPIE) Conference Series, ed. D. L. Crawford, Vol. 627, 733
- [36] Toomre, A., & Toomre, J. 1972, ApJ, 178, 623
- [37] Veilleux, S., & Osterbrock, D. E. 1987, ApJS, 63, 295
- [38] Veilleux, S., Shopbell, P. L., & Miller, S. T. 2001, AJ, 121, 198
- [39] Volonteri, M., Haardt, F., & Madau, P. 2003, ApJ, 582, 559
- [40] Wang, J., Chen, Y., Hu, C., Mao, W., Zhang, S., & Bian, W. 2009, ArXiv e-prints
- [41] White, R. L., Becker, R. H., Helfand, D. J., & Gregg, M. D. 1997, ApJ, 475, 479
- [42] Wyithe, J. S. B., & Loeb, A. 2003, ApJ, 595, 614
- [43] Xu, D., & Komossa, S. 2009, ApJ, 705, L20
- [44] York, D. G., et al. 2000, AJ, 120, 1579