![[Uncaptioned image]](1001.4426v2/infn.png) ISTITUTO NAZIONALE DI FISICA NUCLEARE
Sezione di Milano Bicocca
ISTITUTO NAZIONALE DI FISICA NUCLEARE
Sezione di Milano Bicocca
INFN/AE-10/1
22 Gennaio 2010
The design and commissioning of the MICE upstream time-of-flight system.
In the MICE experiment at RAL the upstream time-of-flight detectors are used for particle identification in the incoming muon beam, for the experiment trigger and for a precise timing ( ps) with respect to the accelerating RF cavities working at 201 MHz. The construction of the upstream section of the MICE time-of-flight system and the tests done to characterize its individual components are shown. Detector timing resolutions ps were achieved. Test beam performance and preliminary results obtained with beam at RAL are reported.
(submitted to Nuclear Instruments and Methods A)
∗ Corresponding author: M. Bonesini, E-mail address: maurizio.bonesini@mib.infn.it
+ permanent address: Department of Physics, Oxford University, UK,
Published by SIS-Pubblicazioni
Laboratori Nazionali di Frascati
The MICE experiment [1] at RAL (see figure 1 for a schematic layout) aims at a systematic study of a section of a cooling channel of a neutrino factory () [2]. The 5.5 m long cooling section consists of three liquid Hydrogen absorbers and eight 201 MHz RF cavities encircled by lattice solenoids.
Different neutrino factory designs require a muon cooling factor from 2 to 16, over a m distance. For a cooling section prototype of affordable size, a cooling factor at most may be expected. A precision of on the design of the whole cooling channel implies emittance measurements at a level of on the cooling cell prototype, thus excluding conventional emittance measurement methods, that have errors around .
A method based on single particle measurements has been envisaged, to obtain such a level of precision. Particles are measured before and after the cooling section by two magnetic spectrometers complemented by time-of-flight (TOF) detectors. For each particle x, y, t, , , coordinates are measured. In this way, for an ensemble of N particles, the input and output emittances may be determined accurately.
1 The upstream MICE time-of-flight system
In the MICE experiment, precision timing measurements are required to relate the time of the incoming beam muons to the phase of the accelerating field in each RF cavity and simultaneously for particle identification (PID) by a TOF method. Three time-of-flight detectors (TOF0, TOF1, TOF2) are foreseen. The last two (TOF1 and TOF2) are at the entrance and the exit of the MICE cooling channel; the first one (TOF0) instead is placed about 10 m upstream of its entrance. Figure 1 shows a layout of the full MICE cooling channel with the foreseen positions of the TOF detectors. The upstream TOF detectors (TOF0, TOF1) must separate the pion contamination of the muon beam at low momenta (below MeV/c) and are used for the experiment trigger. All TOF detectors are used to determine the time coordinate () in the measurement of the emittance.
The TOF stations share a common design based on two planes of fast one-inch scintillator counters along X/Y directions (to increase measurement redundancy) read at both edges by R4998 Hamamatsu fast photomultipliers (PMTs) 11 1 one-inch linear focused PMTs, typical gain at -2250 V, risetime 0.7 ns, transit time spread (TTS) ps. In the upstream section, the TOF0 planes cover a active area, while the TOF1 planes cover a active area. The counter width is 4 cm in TOF0 and 6 cm in TOF1. Time calibration of individual counters has been done with impinging beam particles by using the detector X/Y redundancy. In addition a fast laser calibration system is foreseen for monitoring.
To determine the timing with respect to the RF phase to a precision of a detector resolution ps is needed for TOF0, while to allow a rejection of pions in the incoming muon beam, a resolution better than ps is sufficient for the TOF measurement between TOF0 and TOF1. The resolution in the TOF measurement between detectors and is expressed as:
| (1) |
where is the i-th (j-th) TOF station time resolution and is the resolution of the calibration system. Having two independent measurements from each TOF stations (due to the X/Y redundancy) is given by , where is the intrinsic counter timing resolution.
Taking into account also the calibration errors, this imply a conservative requirement for single detector timing resolution ps and a resolution of the calibration procedure 50 ps.
1.1 Working conditions of the time-of-flight detectors inside MICE
In the MICE experiment the TOF detectors have to work with high incoming particle rates (up to 1.5 MHz), high magnetic fringe fields from the tracking solenoids with up to G (only for TOF1 and TOF2) and a high level of RF noise from the cooling channel.
From beamline simulations and the expected beam widths at the TOF0 and TOF1 detectors positions ( cm) rates up to about 0.5 MHz must be sustained by single PMTs.
Due to the low residual magnetic field produced by the last quadrupole of the beam channel in the vicinity of the TOF0 detector ( Gauss), conventional PMTs with an elongated mu-metal shielding (extending 30 mm beyond the photocathode surface) may be used (see later for details). The other two stations (TOF1 and TOF2) will work instead inside the high residual magnetic field of the spectrometer solenoids, that is only partially shielded by a 100 mm iron annular plate. The left panel of figure 2 shows the residual longitudinal and orthogonal components of the magnetic field at the position of TOF1 and TOF2 detectors, as computed with a 2D Tosca [3] or COMSOL [4] calculation 22 2 3D Tosca calculations were redone and results were found compatible [6]. Because orthogonal components (up to Gauss) and longitudinal components (up to Gauss) of the fringe magnetic fields must be shielded, a local or a global magnetic shielding for TOF1 and TOF2 detectors has to be envisaged. For conventional PMTs 33 3 Other solutions, based on PMTs for high magnetic fields such as Hamamatsu R5505-70, have been studied, but later they have been abandoned for their much higher cost [8] the most difficult component to be shielded is the one along the PMT’s axis. Orthogonal components can be more easily shielded. A global cage bolted to the annular return plate of the nearby spectrometer solenoid will be used for TOF1. This is shown in the right panel of figure 2 with the relevant mechanical details.
As computed with a 3D Tosca calculation [6] the residual field inside the shielding cage is below a few Gauss: a value well tolerable by the R4998 PMTs with a 1 mm metal shielding. The solution, albeit elegant, has the drawback of the need of a quite complicate extraction mechanism to allow access to the detector inside the inner volume of the shielding cage.
2 Detector construction
The structure of TOF1, inside the shielding cage, is shown in the right panel of figure 2. TOF0 has a similar crossed X/Y structure. Each scintillator slab, after a straight Polymethyl methacrylate (PMMA) lightguide, is read at the two edges by a fast R4998 PMT. Scintillator counters have been assembled in-house starting from DTF (diamond tool finished) scintillator bars from Bicron, to which PMMA light-guides have been glued with BC-600 optical cement. A simple design with flat fish-tail PMMA lightguides, instead of tilted ones (to reduce the influence of magnetic field) or Winston cones, has been chosen to optimize the timing detector resolution (favouring the collection of straight light) and to allow an easy mechanical assembly. The chosen design of the lightguides has been checked with a dedicated simulation program [9]. Wrapping and assembly has been realized with total tolerances less than 1 mm for each individual counters of the TOF0/TOF1 planes. The final choice of wrapping is aluminized mylar + black PVC covering. The light-tightness of the covering material has been tested measuring the transparency of a small sample inside a spectrophotometer 44 4 model JASCO V-530 UV/VIS. The optical contact between the end of the lightguide collar and the PMT photocathode is assured by silicone elastomers 55 5 Bicron one-inch BC-634 optical pads.
For the scintillator material, different options have been considered (see table 1 for more details). The Bicron BC-420 scintillator has been retained as a choice for TOF0, while BC-404 have been used for TOF1 and TOF2. In spite of small additional problems for the choice of lightguide material (high quality UVT plexiglas, instead of commercial UVA plexiglas, as the scintillation emission peak is around 390 nm), BC-420 was expected to give slightly better timing performances than BC-404 and was thus considered the optimal choice for TOF0.
| BC-408 | BC-404 | BC-420 | EJ-204 | EJ-230 | UPS-95F | |
| (nm) | 425 | 408 | 391 | 408 | 391 | 390 |
| (cm) | 380 | 160 | 110 | - | - | |
| Light output Anthr. | 64 | 68 | 64 | 68 | 64 | 39-45 |
| decay const. (ns) | 2.1 | 1.8 | 1.5 | 1.8 | 1.5 | 1.2 |
| risetime (ns) | 0.9 | 0.7 | 0.5 | 0.7 | 0.5 | 0.7 |
| pulse width (FWHM ns) | 2.2 | 1.3 | - |
Time calibration of individual counters has been done with impinging beam particles, using the X/Y redundancy of TOF detectors (see later for details). A fast laser calibration system, as in the HARP experiment large TOF wall detector [10] is foreseen for time calibration and monitoring (see figure 3 for details). The laser light is beam split to a fast Hamamatsu G4176 photodiode, giving the system START, and is injected into a bundle of fibers that transmit the pulse to the different scintillator counters.
Studies are under way to provide an economic and stable fast laser source. To reduce launch problems, IR monomode Corning SMF-28 fibers, that for blue or green light behave as a “limited” number of modes fiber, will be used.
The fiber bundle will be realized with a fused-silica splitter followed by three m long fibers going each one to a fused-silica splitter. The splitters, realized by OZ Optics 66 6 OZ Optics Ltd., Ottawa, Canada with Corning SMF-28 fibers, have splitting ratios with relative differences less than (rms) for the 20 (14) fibers to be used for TOF0 (TOF1).
Laser light will be injected at the center of each counter by a total reflection prism, after a 1 m long multimode (MM) fiber 77 7 FT-110-LMT from 3M, with core diameter m and typical attenuation at 500 nm that convey the laser pulses. The total reflection prism and the fiber holder are glued inside a black PVC cap with black silicone 88 8 Dow Corning 732 sealant to ensure light-tightness.
2.1 Electronics readout
A schematic layout of the front-end electronics is shown in figure 4. The PMT signal is split to a time-to-digital (TDC) line and a sampling flash analog-to-digital converter (FADC) line for time-walk-corrections. The PMT pulse measurement scheme is designed to meet the high input event rate requirements in MICE, that demand electronic modules with conversion times better than s and a events buffer.
The negative signal from the PMT, after a 40 m long RG-213 cable, passes through a passive () splitter and then is sent to a RC shaper and to a leading edge discriminator LeCroy 4415. Fast timing cables RG-213 rather than conventional RG-58 cables have been used to reduce signal distortion. As measured in [11], RG-213 cables have a better stability as a function of temperature: single channel temperature variation that is three times better than standard RG-58 cables. This reduces only to a few when considering the relative channel to channel variation. Before installation at RAL, the delays introduced by the signal cable lengths have been individually measured.
The RC shapers and splitters are specifically designed and produced for the requirements of the MICE experiment. A short acquisition time for a pulse is achieved by using a FADC 99 9 CAEN V1724 FADC with 100 MS/s maximum sampling rate. The shaping circuit is used to effectively extend the duration of the short PMT pulse, so that it could be finely sampled in successive time points by the ADC. Software processing of the digitized pulse yields its amplitude or the area values that are needed for charge measurement and time-walk correction. The passive splitter is designed to match the impedances of the 50 Ohm coaxial cable, coming from the PMTs, with the 120 Ohm impedance of the Lecroy 4415 leading edge discriminators and shaper inputs. The shaper circuit provides 4-stages of low-pass filtering and amplification of the input pulses. The time-constant of the filter stages is selected around 30 ns, which gives effective stretching of the 5 ns PMT pulses up to 400 ns. In this way the acquisition of a pulse can take place within the available s time interval, providing several tens of sampled points along the pulse profile. The signal is DC-coupled throughout the whole shaper circuit. This provides baseline insensitivity to pulse rate variations. The DC gain can be selected from several predefined values by jumper settings. Sixteen shaper channels are organized in one NIM module, each channel having individual gain, offset voltage and polarity adjustments.
Similarly, the splitter board is also a 16-channel unit. It is mounted directly on the front panel of the shaper module. A twisted-pair flat cable is used to connect the splitter with the discriminator module.
After the discriminator a fast CAEN V1290 TDC is used to provide timing measurements. The V1290 is a multihit/multievent VME TDC that can detect hits rising/falling edges and work in continuous storage mode with a bits deep outer buffer. A 25 ps least significant bit (LSB) couples to a 5 ns double hits resolution. The CAEN V1290 TDC has a differential non-linearity (DNL) of 2.8 LSB and an integrated non-linearity (INL) of 15 LSB, as reported in [12].
For timing measurements, a relevant problem is given by the cross-talk due to channel-to-channel coupling in the same TDC electronic board. The 32 channels of a V1290A TDC are grouped into four separate electronic boards. A fixed start-stop measurement, with the stop signal split into two different channels belonging to different electronic boards, was implemented. One of the stop signals was then disturbed by a pulse with a sweeping delay with respect to it, coming to another channel of the same (different) board to which the STOP line is connected. Figure 5 shows the difference of the two stop signals (peaking at zero in absence of external noise) as a function of the delay of the external noise with respect to one of the stop signals. The top panel shows the case of the signal coming to a channel of another board (where no cross-talk is expected), while the other two panels show the case when the noise is coming to a channel of the same board of the stop signal. Coming to a different board the effect is less than 1 LSB, while coming to a channel of the same board the effect reaches 3 LSB in a time window less than 20 ns.
With an incoming particle rate of less than 1 Mhz for single counting, this poses no serious problems for the timing measurement.
3 Tests of single detector components
Single components of the TOF detectors were individually characterized for optimal performances. In particular, extensive studies were done on the fast Hamamatsu R4998 PMTs and to choose the most suitable scintillator material.
3.1 Tests on Hamamatsu R4998 PMTs
R4998 PMTs have been delivered by Hamamatsu in assemblies (H6533) that include the PMT, the voltage divider chain and a 1 mm metal shielding. To increase the count rate stability of PMTs, instead of a conventional resistive divider type, an active divider or a booster on the last dynodes had to be used. After some tests, the performances of PMTs equipped with a booster or an active divider were found roughly equivalent. The active divider option was chosen for its easier use.
About 120 H6533 assemblies were delivered by Hamamatsu in two years. In the following, only the tests to study the rate capability and the behaviour inside a magnetic field will be shown. In addition, many tests were done to qualify the PMT’s assemblies for installation in the TOF detectors, as a sizeable fraction of them had problems related to breakdown of the active divider under stress or showed a very noisy behaviour with big output spikes.
To test single PMTs inside magnetic field or PMTs mounted on a scintillator bar a setup similar to the one on figure 6 was used. A fast light pulse 1010 10 a home-made system based on a Nichia NDHV310APC violet laser diode and an AvtechPulse fast pulser (type AVO-9A-C laser diode driver, with ps risetime and AVX-S1 output module) was used. This system gave laser pulses at with a FWHM between ps and ns (as measured with a 6 GHz 6604B Tek scope) and a max repetition rate MHz was sent directly to the PMT’s photocathode via a 3 m long multimode 3M TECS FT-110-LMT optical fiber (with a measured dispersion of ps/m, see [10]). At the end of the fiber a small Plexiglas prism, inserted in a black plastic cover in front of the PMT window, allowed illumination at the center of the photocathode. The laser spot was focused into the optical fiber (aligned by a micrometric x-y-z flexure system 1111 11 Thorlabs MBT613/M with 4 mm excursion and a resolution of m) by a 10x Newport microscope objective, after removable absorptive neutral density filters, to give light signals of different intensities. A broadband beamsplitter (BS) divided the laser beam to give of light on the fiber injection system and on a monitoring detector. A fast Thorlabs DET210 photodiode (risetime ns) was used in most measurements, to monitor the laser stability. For gain measurements the PMT signal was acquired in average mode by a Tektronix TDS 754C digital scope (500 MHz bandwidth, 2 Gs/s sampling rate) triggered by the laser output syncronization signal (sync. out), that had a maximum jitter of 15 ps with respect to the delivered optical pulse. In part of the measurements the signal was sent after a passive T divider to a Canberra 2005 preamplifier, followed by an EG-G Ortec 570 shaper (shaping time , gain ) followed by a Silena 8950 multichannel analyzer (MCA), using as external trigger the sync out signal of the laser.
For timing measurements, the same MCA chain was used with a Silena 7422 charge-amplitude-time converter (QVT), see figure 6 for details. The STOP signal () was given by the PMT anode signal after a leading edge PLS 707 discriminator, while the START signal () was given by the sync out of the pulser after a suitable delay and an ORTEC pulse inverter. In timing measurements what is actually measured is the time difference , that accounts for delay in cables and electronics and jitter in the transit time in the tested PMTs. A lack of variation in this quantity or no deterioration in the FWHM of its distribution, after increasing the magnetic field intensity, demonstrates the effectiveness of the adopted shielding. The used TDC range (up to ) with the MCA resolution (2K) allowed a resolution of 50 ps/count.
3.1.1 PMTs behavior in magnetic field
Systematic studies have been done, using a dedicated resistive solenoid of 23 cm inner diameter, 40 cm length 1212 12 built by TBM, Uboldo (VA), Italy. The big open bore allows tests of single H6553 assemblies both with field lines orthogonal or parallel to the PMT axis up to Gauss. The magnetic field was measured via a gaussmeter 1313 13 Hirst GM04 model, with axial Hall probe, with an accuracy better than . Tests were done usually with a signal corresponding to a MIP. The laser optical power was periodically monitored with an OPHIR NOVA laser power meter. The number of photoelectrons () was estimated via absolute gain measurement. This number was cross-checked with the power meter measurements. The PMTs were inserted in the central region of the test solenoid, where the field had a uniformity better than , using a support to incline them between and with respect to the field lines in the magnet (B∥ or B⟂). Environment light was accurately masked to reduce noise.
Results for signal reduction and timing versus the magnetic field intensity B for the average and rms of a sample of ten PMTs are shown in figure 7.
The uncertainties in these studies came mainly from non-uniformity of the magnetic field, stability of the laser pulses, error in positioning of PMTs inside the magnetic field, conservatively estimated to less than and statistical errors.
The studies described above show that H6533 assemblies (with a 1 mm metal shielding) perform satisfactorily inside residual longitudinal magnetic fields up to Gauss and orthogonal magnetic fields up to Gauss. This is the case for TOF0 or TOF1 inside the external shielding cage.
3.1.2 Rate capability
Complete scintillator counters equipped with PMTs at the ends were used in these measurements. The laser light was injected in the scintillator bar through the standard laser injection system described in section 3. The Avtech pulser was triggered externally, while the PMTs signals were digitized by a CAEN V792 QADC and acquired by a CAEN V2718 PCI-VME interface. The effect of a booster on the last dynodes for a typical PMT is shown in figure 8. Figure 9 shows the PMT amplitude response (in a.u.) as a function of the laser shot repetition rate R (simulating an increasing particle rate), both with a conventional resistive divider, a booster on the last dynodes or an active divider for typical PMTs. The HV is decreased in 50 V steps from the value of -2300 V at the top. The laser light signal is roughly equivalent to one MIP for the curves at -2300 V. These results can be easily understood, recalling that the rate capability is limited by the maximum allowable anode current , that depends also on the PMT gain. The left panels are relative to PMTs with lower gains, as respect to the ones in the right panels (roughly a factor 2-3). The rate capability for a sample of nine PMTs is shown instead in figure 10 for some typical HV settings.
Timing characteristics of R4998 PMTs show no deterioration going from 1KHz up to 1 MHz, for sensible number of photoelectrons as seen in figure 11 at B=0 Gauss for a typical assembly with active divider.
As a conclusion, from the performed laboratory tests, it appears that R4998 PMTs may sustain rates up to 500-600 KHz without major problems with an active divider or a booster, while this limit goes down to KHz with a resistive divider, depending on the PMT gain.
3.2 Tests on single counters at the BTF facility
The Laboratori Nazionali di Frascati (LNF) DANE Beam Test Facility (BTF) is a beam transfer line designed to deliver electrons or positrons mainly for detector calibration purposes [13]. Tests at the BTF were done to choose the scintillator to be used, cross-check the design of the lightguides, assess the counter intrinsic time resolution and measure the number of produced photoelectrons ().
The BTF pulse time structure allows to test resolution effects and eventually pile-up effects, but not the behaviour with high rates. Most of the data were taken in single particle mode (one electron per pulse) exploiting a high resolution calorimeter as diagnostic device.
The prototype TOF counters under study were mounted on a test stand at a distance of about 10 cm one from the other, with two finger counters (F1 and F2) of mm2 transverse area to define the impinging beam.
As scintillator material Bicron BC404, BC420 and BC408 and Amcrys-H UPS95F were used (see Table 1), while lightguides were made of Bicron BC800, REPSOL Glass UVT PMMA or PERSPEX UVA PMMA. In some measurements the left/right PMT signal was used as START/STOP for a time-to-amplitude (TAC) unit connected to a MCA 1414 14 ORTEC Trump-8K MCA with an ORTEC 566 TAC and a PLS711 leading-edge discriminator, to get an immediate feedback on time resolutions.
In the bulk of data taking each PMT signal was split by an active or passive splitter to both a QADC line 1515 15 CAEN V792 model, 32 channels, 12 bit, 0.1 pC/ch and , after a discriminator, to a TDC line. By an appropriate fan-in, fan-out the baseline CAEN V1290 TDC was used together with a conventional TDC 1616 16 CAEN V775 model, 12 bits, nominally ps/ch for reference. To convert TDC counts to picoseconds, the V1290 TDC has been later calibrated offline with known delay cables. A value 22 ps/count has been obtained, to be compared to a nominal value of 25 ps/count. The adoption of leading edge discriminators (such as CAEN N417 or PLS 711) introduced a time-walk effect.
Before data taking, the gains of the two PMTs of a given prototype counter were roughly equalized with cosmics looking at the signals on a digital scope.
Event selection required a coincidence from the two finger counters () and a pulse height compatible with single impinging electron. By fitting a gaussian to the distribution of , with being the arrival time at the PMTs of a single counter as measured by the TDC chain, it was possible to obtain the counter intrinsic resolution .
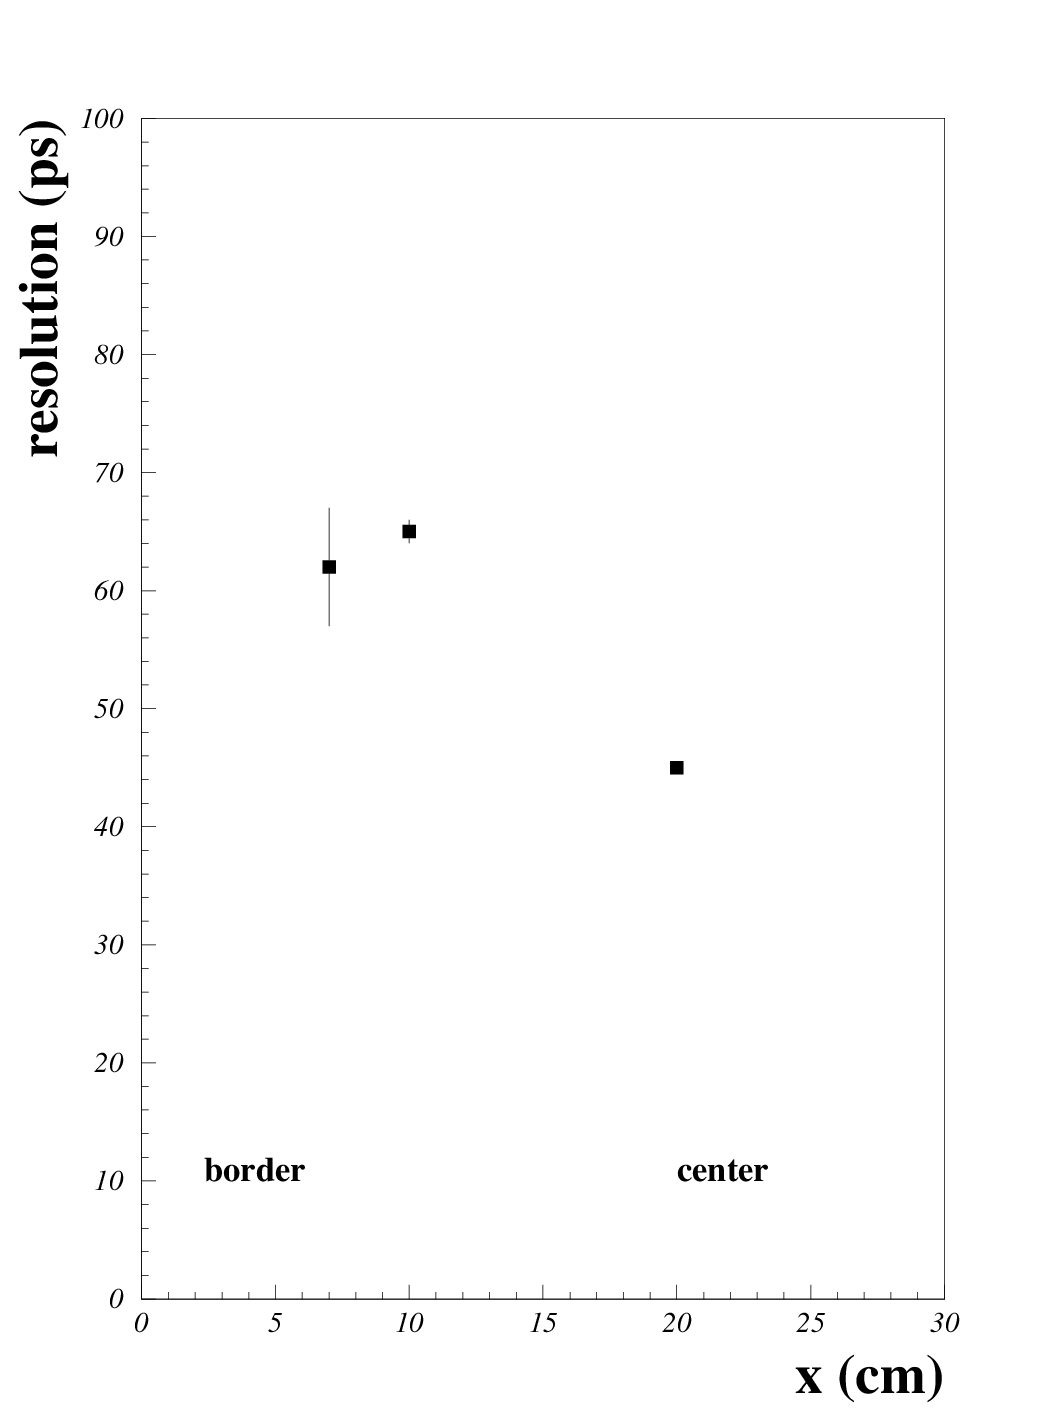
Effects of the time-walk cancel out when the beam impinge on the center of a counter and both PMTs give similar pulse heights. Figure 12 shows, as an example, the distribution of for runs with beam hitting the center of one BC404 bar. Table 2 shows the results obtained for several prototype counters with the beam hitting the counter centre. Intrinsic time resolutions are all in the range 45-60 ps, with better resolutions for BC420 or BC404 counters. Similar results were obtained also by using fine-mesh one-inch Hamamatsu R5505 PMTs in place of the conventional one-inch R4998 PMTs 1717 17 R5505 PMTs have a TTS of ps and a nominal gain of at +2000 V.
| counter type | (ps) |
|---|---|
| UPS95F 4cm bar Winston Cone | |
| UPS95F 4cm bar REPSOL UVT lightguide | |
| BC404 6cm bar REPSOL UVT lightguide | |
| BC420 6cm bar REPSOL UVT lightguide | |
| BC408 6cm bar PERSPEX UVA lightguide |
When scanning along a counter, effects of PMT non-equality and from time-walk 1818 18 this last effect may be corrected for with a pulse height measurement, using a time-walk correction show up as demonstrated in figure 13.
If the pulse height distribution is fully described by the photoelectron statistics, it is possible to estimate the number of photoelectrons per single impinging electron () from:
| (2) |
where the average pulse-height and the resolution are obtained from a gaussian fit.
This estimation neglects electronic noise and gain fluctuations and is affected by the quality of the scintillator-PMT coupling.
As explained in reference [14], the estimation uncertainty of formula (2) depends on the amplification factors of the first and second dynodes. For R4998 PMTs these factors are estimated as and [15], giving a correction factor of about for . From the available data is estimated to be in the range of 200-300 p.e. for the BC420 counters under test, depending on the impact beam position.
The number of photoelectrons can be also estimated on simple grounds with the formula:
| (3) |
where is the conversion efficiency of deposited energy
into scintillation photons (usually ), is the scintillator
thickness in cm, is the PMTs photocathode quantum efficiency and
is the optical collection efficiency,
to be estimated by simulation.
The light collection in the TOF counter has been simulated with the
program GUIDEIT [9], using light sources uniformly dispersed along
the median crossing plane of the counter.
From the simulation the collection efficiency has been estimated
to be and from formula 3 it can be estimated
that p.e. in agreement with the previous estimation based on photo-electron statistics.
4 Detector commissioning at RAL
To equalize the amplitude response of the TOF0 and TOF1 scintillation counters 1919 19 This is useful in order also to have similar time-walk corrections for the timing response of the two (L/R) PMTs of the same counter the different PMT’s gain and the optical coupling 2020 20 both between the scintillator bar and the lightguides and the lightguide collars and the PMTs in the L/R side of each bar must be accounted for. Neglecting this last factor, a pre-equalization has been done by taking into account only to the PMT’s gains. By using a YAP:CE source from SCIONIX Ltd. 2121 21 with a nominal rate of counts/s, a calibration run of a few events was done in about 10-20 minutes instead of the many days needed in a cosmics testbench pulse height spectra were recorded both on a digital scope 2222 22 Tektronix DPO7054, with a 2.5 GHz bandwidth and with a VME CAEN V792 QADC, read by a CAEN V2718 VME-PCI interface.
Data were recorded at a nominal H.V. value, set on a CAEN N470 module from about -1800 V to -2300 V, in 50V steps. The amplitude (in mV) has been plotted as a function of the H.V. (in kV) and fitted with a functional form , with free parameters for each PMT. Figure 14 shows the fit for a typical PMTs. Figure 15 shows instead the distribution of the and parameters for the sets of PMTs used in TOF0 (upper panels) and TOF1 (lower panels) detectors. The and values of each PMT and the functional form were then used in the detector equalization for amplitudes. While the “normalization” parameter varies up to a factor of ten with a mean value 8.04 (9.71) and of 3.15 (5.13) for TOF0 (TOF1), the parameter giving the “slope” of the correction has a mean value 6.46 (6.69) with of 0.40 (0.35) for TOF0 (TOF1).
In the scintillation counters pre-calibration procedure, the PMT working voltages have been set, trying to select the left and right PMTs of each counter with the most similar gains and the PMTs for the horizontal and vertical planes of the same detector with similar gains.
4.1 First performance in beam
Put outside the closed DSA area 2323 23 Decay Solenoid Area - closed area nearby the extraction point of the pion secondary beam from ISIS that contains a 5 m long, 5 T decay solenoid for muon collection and the first PID detectors, including TOF0, on a special trolley, TOF0 was tested in July 2008 to assess PMTs reliability in real working condition during the summer 2008 ISIS run and then moved to its final position inside DSA in September 2008. TOF1 has been installed instead at RAL in December 2008 on the temporary trolley after TOF0 and since then tested with a few dedicated runs. Due to problems in the cooling of the decay solenoid, that persistently affected its performance, only some low intensity runs with positrons or pions were done to test preliminary detector performance.
For a particle crossing a scintillation counter (i=1, …10), equipped with two photomultipliers (j=1,2) of a plane (l=1,2) of a TOF detector, at a time and at a distance from its center, the signal arrival time at the PMT photocathode is given by:
where L is the scintillator length, the effective light velocity in the scintillator slab and include all delays (cables, PMT transit time, etc.). After correction for the delays , the quantity
is independent of the impact point along the counter and allows measurement of the time-of-flight (TOF) in a detector plane, while the impact position can be deduced from
The calculation of the delays is a quite delicate task and may be done with impinging beam particles.
For the trigger TOF0 detector, defining as a “pixel” the area given by the crossing of two orthogonal slabs (in the horizontal and the vertical plane of a TOF detector), the calibration procedure first determines the peak position of timing signals with respect to the trigger 2424 24 for an incoming particle the trigger signal is given by the first of the twofold coincidences from slab and slab . The time of the coincidence signal is the time of the latest signal arriving to the logic unit., for particles hitting a pixel. From these, alignment time calibration constants may be deduced. For the second TOF station (TOF1), in the calibration procedure one has to account also for the additional delay due to the time-of-flight between the two stations, using particles of known velocity (such as positrons).
The adoption of leading edge discriminators (such as Lecroy 4415) introduces a dependence of the discriminating threshold crossing time on the collected charge (time-walk). To correct for time-walk, the dependence of the difference between the time measured by the TDC and a reference time on the maximum of the signal of the PMT, as measured by the FADC, the following function is fitted to the data:
with parameters determined for each PMT, as shown in figure 16.
The reference time is given by a PMT in the other plane of the station.
The precision in the calculation of the time-walk correction is limited by the very poor collected statistics for under 1000 counts and above 3000 counts (see figure 16). The effect of the time-walk correction is illustrated in figure 17 for a typical counter.
The calculation of the time calibration constants was done exploiting 300 Mev/c pion beam data and after the time-walk correction. The collected data were just enough for calibration of only 9 central pixels in TOF0 and 2 central pixels in TOF1.
The effect of the absolute time calibration and the time walk correction is illustrated in figure 18.
The resolution after the calibration can be measured by using the time difference between the vertical and horizontal slabs in the same TOF station (see figure 19). The obtained resolution on the difference is for TOF0 and for TOF12525 25 This translates into resolution for the full TOF0 (TOF1) detector with crossed horizontal and vertical slabs. .
Figure 20 shows the distribution of the time-of-flight between TOF0 and TOF1 for the 300 MeV/c pion beam and a positron beam 2626 26 this beam is set by starting from the settings for pion beam at 300 MeV/c and reducing down all the currents in the upstream magnets to a nominal 100 MeV/c momentum. At this momentum only positrons reach TOF stations. The first peak which is present in both distributions (pion and positron beam) is considered as the of the positrons and is used to determine the absolute value of the time in TOF1. A natural interpretation of the other two peaks is that they are due to forward flying muons from pion decay and pions themselves.
Conclusions
This paper reports the design and commissioning of the upstream section of the MICE time-of-flight detector system and preliminary evaluation of its performance in the beam. After a calibration with impinging particles, an intrinsic detector resolution of ps is obtained. A TOF measurement between two stations with a resolution of ps is thus within reach.
Acknowledgements
We acknowledge the essential help of Mr. R. Mazza of INFN Milano Bicocca for the skilful design of TOF0/TOF1 mechanics and Mr. S. Banfi, R. Gheigher from INFN Milano Bicocca and T. Locatelli, C. Scagliotti and A. Freddi from INFN Pavia for their contributions to the construction. We are grateful to all MICE collaborators for useful discussions and encouragement in the couse of this work, in particular to J. Cobb, G. Gregoire, W. Lau and L. Tortora. These measurements were carried out using the purpose-built MICE beam-line at the ISIS facility at the STFC Rutherford Appleton Laboratory. It is a pleasure to acknowledge the efforts of many people, from ISIS and the MICE collaboration, in developing and operating the MICE beam-line, and the ongoing support of the host facility.
References
- [1] A. Blondel et al., proposal, RAL, 2003.
- [2]
D.G. Kosharev, CERN/ISR-DI/74-62 (174);
A. Blondel et al., CERN-2004-002;
M. Bonesini,A. Guglielmi Phys. Rep. 433 (2006) 65. - [3] Tosca-2D or Tosca-3D programs from Vector Fields Inc., http://www.vectorfields.com
- [4] COMSOL Multiphysics from COMSOL Inc., http://www.comsol.com
- [5] J.Cobb, H.Witte, private communication
- [6] G. Gregoire, private communication
- [7] G. Gregoire, W. Lau, private communication
- [8]
M. Bonesini et al., Nucl. Instr. Meth. A567 (2006) 200;
M. Bonesini et al., Nucl. Instr. Meth. A572 (2007) 465. - [9] D.A.Simon, Guideit v 1.1 Manual, 1993
- [10] M. Bonesini et al., IEEE Trans. Nucl. Science 50 (2003) 541
- [11] M. Baldo-Ceolin et al., Nucl. Instr. Meth. A532 (2004) 548.
- [12] C. Tintori, HPTDC workshop, CERN, 2003
- [13]
G. Mazzitelli, A. Ghigo, F. Sannibale, P. Valente, G. Vignola,
Nucl. Instr. Meth. A515 (2003) 524;
B. Buonomo,G. Mazzitelli and P. Valente, IEEE Trans. Nucl. Sc. NS-52(4) 2005 824. - [14] T. Yamaoka et al., 28th Int. cosmic Ray Conf., proceedings, p. 2871, 2003.
- [15] L. Confalonieri, Hamamatsu, private communication.