cross section in collisions at GeV
Abstract
We report on a measurement of the cross section at midrapidity in collisions at GeV. We find the cross section to be pb. Perturbative QCD calculations at next-to-leading order in the Color Evaporation Model are in agreement with our measurement, while calculations in the Color Singlet Model underestimate it by 2. Our result is consistent with the trend seen in world data as a function of the center-of-mass energy of the collision and extends the availability of data to RHIC energies. The dielectron continuum in the invariant mass range near the is also studied to obtain a combined cross section of Drell-Yan plus -.
Keywords:
Upsilon production, Quarkonium, Bottomoniumpacs
13.20.Gd, 14.40.Pq, 13.75.Cs, 12.38.-t, 12.38.Mh, 25.75.-q, 25.75.Nq, 25.75.CjI Introduction
The main focus of the heavy flavor program at RHIC is to investigate the properties of the Quark-Gluon Plasma by studying its effect on open heavy flavor and quarkonia production. suppression induced by Debye screening of the static Quantum Chromo Dynamics (QCD) potential between pairs was originally hailed as an unambiguous signature of Quark-Gluon Plasma (QGP) formation [1]. However, this simple picture is complicated by competing effects that either reduce the yield, such as co-mover absorption [2, 3], or enhance it, such as in recombination models [4, 5, 6]. Recently, a growing interest in studying the meson and its excited states has been kindled as it is expected that color screening will be the dominant effect contributing to any observed suppression of bottomonium production in heavy-ion collisions. A full spectroscopy of quarkonia states is now clearly recognized as one of the key measurements needed to understand the matter produced in high-energy heavy-ion collisions [7]. In particular, it has been recognized that data on the particle spectra of bottomonia can provide valuable information to constrain QGP models [8]. Due to the low production cross section of - at RHIC (1.9 b, [9]), recombination effects in collisions are negligible. At the same time, the interaction cross section of bottomonium with the abundantly produced hadrons in these collisions is small [10], so suppression due to absorption by hadronic co-movers is expected by these models to be relatively unimportant. However, it will still be important to study production in +Au collisions since available measurements by E772 [11] of cold nuclear matter effects on production at lower energy show some suppression. Nevertheless, the amount of suppression seen for the family is measured to be smaller than for charmonia. Therefore, bottomonium is expected to be a cleaner probe of high-temperature color screening effects.
In addition to its important role in establishing deconfinement, a measurement of the 1S, 2S, and 3S states in and heavy-ion collisions can help to set limits on the medium temperature. The quarkonium measurements help in reaching these key goals because () an observation of suppression of production in heavy-ions relative to would be a strong argument in support of Debye screening and therefore of deconfinement [12], and () the sequential suppression pattern of the excited states is sensitive to the temperature reached in the medium [7]. In this regard, lattice QCD studies have seen a burst of activity in recent years. Studies of quarkonia spectral functions and potential models based on lattice QCD indicate that while the melts even before the deconfinement transition and the is likely to melt at RHIC (= 200 ), the is expected to survive [7, 13, 14]. Recent results [12, 15] indicate further that almost all quarkonia states (, , , , ) melt below 1.3 and the only one to survive to higher temperature is the , which melts at 2, where MeV is the critical temperature for the parton-hadron phase transition. Therefore, a systematic study of all quarkonia states in , +Au, and Au+Au collisions will provide a clearer understanding of the properties of the Quark-Gluon Plasma.
Suppression of the and should be measurable at RHIC energies with increased integrated luminosity. In the near future, the larger luminosities proposed by the RHIC II program [16] will allow for a statistically significant measurement of all 3 states. With the objective of embarking in such a long program, one of the first steps is to establish a baseline cross section measurement of the bottomonia states in collisions. There are no previous measurements of production in at the top RHIC energy for heavy ions (an upper limit was estimated in the 2004 data with only half of the calorimeter [17]). The luminosities available at RHIC in the 2006 run provided the first opportunity to measure bottomonium at the previously unexplored center-of-mass energy of . A dedicated trigger algorithm exploiting the capabilities of the STAR electromagnetic calorimeter is essential for this measurement, and its development in STAR allows the family to be studied in the decay channel. In this paper, we report our result for the (1S+2S+3S) cross section at midrapidity, obtained with the STAR detector in collisions at GeV via the decay channel. This measurement uses an integrated luminosity of 7.9 pb-1 collected during RHIC Run VI (2006). We compare our data to perturbative QCD calculations done at next-to-leading order (NLO pQCD) in the Color Evaporation Model (CEM) [16] and in the Color Singlet Model (CSM) [18].
The article is organized as follows. Section II explains the detector setup. The details of the quarkonia triggers are explained in Sec. III. The acceptance and trigger efficiency are discussed in Sec. IV. After a detailed discussion of the data analysis procedure in Section V, we present our results and compare with pQCD calculations and with available data in Sec. VI. Our findings are summarized in Sec. VII.
II Detector Overview
The main detectors used in the STAR quarkonia program are the Time Projection Chamber (TPC) [19], the Barrel Electromagnetic Calorimeter (BEMC) [20], and the Beam-Beam Counters (BBC) [21].
The BBCs are segmented scintillator rings covering the region . The STAR minimum-bias trigger requires the coincidence of hits in the BBCs on opposite sides of the interaction region, and is used to monitor the integrated luminosity for measuring absolute cross sections. The BBC acceptance and efficiency were studied previously [22], and it was found from simulations that for non–singly diffractive (NSD) events the BBC trigger was % efficient. The absolute cross section seen by the BBC trigger was measured via a van der Meer scan to be 26.1 0.2 (stat.) 1.8 (syst.) mb.
The TPC and BEMC have a large acceptance at midrapidity: the single track coverage of the TPC+BEMC in pseudorapidity is and complete in azimuth. The BEMC is divided in and into 4800 towers. The size of each tower in is rad. The geometrical acceptance of the STAR BEMC for detecting both electrons from an decay is about over all phase space, and for ’s in the kinematic range and . We focus on this kinematic range, where the acceptance of the detector is optimal.
The capability of the TPC+BEMC for electron identification and the triggering capabilities of the BEMC are the two pillars of the STAR quarkonium program. In particular, the BEMC trigger allows us to sample the full luminosity delivered by RHIC to look for the high-mass dielectron signals characteristic of the decay.
III The STAR Quarkonia Triggers
The STAR quarkonia trigger is a two-stage system comprising a Level-0 (L0) hardware component [23] (decision time of s) and a Level-2 (L2) software component (decision time of s in , and s in Au+Au). There were two separate triggers used during the 2006 run; in the following we refer to them as Trigger I and Trigger II. They were identical in concept, with the only difference being an increase in thresholds, which was necessary to reduce the trigger rate and reduce deadtime while data-taking. We discuss the triggers next, and list all the parameters and thresholds. These were chosen based on simulations and on expected trigger rates based on calorimeter data taken in 2003.
III.1 L0 Trigger
The L0 trigger is a minimum-bias trigger with the additional requirement of signals in the BEMC consistent with a high energy electron. The energy deposited in the calorimeter towers is measured by collecting scintillation light from the electromagnetic shower. The signal is digitized, pedestal subtracted, and sent to the L0 Data Storage and Manipulation (DSM) hardware as a 6-bit ADC value for triggering. The calorimeter calibration is done such that tower ADC values are proportional to deposited electromagnetic transverse energy (), making it useful for triggering on high- electrons. The L0 trigger decision is made for every bunch crossing.
For the analysis, the L0 decision was based on two quantities. The first is related to the signal in distinct towers. The tower with the highest , as represented by the DSM-ADC value, is called the “High Tower” (HT) in the event. The second quantity is a sum of towers in fixed - regions of the BEMC, where each region comprises 44 towers. Each of these regions is named a “Trigger Patch” (TP). Since each tower covers 0.05 units in and 0.05 radians in , the TP coverage is rad. The L0 trigger is issued for Trigger I (Trigger II) if all of the following three conditions are met: () an event has a High Tower with a DSM-ADC value 12 (16), corresponding to 2.6 (3.5) deposited in the tower; () the Trigger Patch containing the High Tower has a total DSM-ADC sum over the 16 towers in the patch with a value 17 (19), corresponding to 3.8 (4.3) , and () the STAR minimum-bias trigger is met. The minimum-bias trigger is based on a BBC coincidence and is described elsewhere [22]. The coincidence of High-Tower and Trigger Patch triggers will be referred to as “HTTP” in the remainder of the paper.
Figure 1 shows the distribution for simulated electrons and positrons from decays in which both daughters are within the STAR acceptance. For each decay, we plot the distribution of the electron (filled circles) or positron (open squares) with the highest (the abscissa is simulated ). The electron and positron distributions are identical, as expected for a two-body decay into daughters with identical masses. The histogram in the figure is the sum, i.e., the distribution for the hardest of the two daughters. The corresponding DSM-ADC values used in the L0 trigger (which are proportional to ) are shown in Fig. 2. The L0 HT Trigger II threshold of 16 is shown by the vertical dashed line.
From the and ADC distributions for the hardest daughter in Figs. 1 and 2, the average values are 5.6 GeV/c and 18.0 counts. Since the trigger threshold is placed at 16 ADC counts, the hardest daughter will typically fire the trigger. We find that 25% of the ’s produced at midrapidity have both daughters in the BEMC acceptance and at least one of them can fire the L0 trigger. The details of the HTTP trigger efficiency and acceptance are discussed in Sec. IV.


III.2 L2 Trigger
Once a L0 HTTP trigger is issued, the information for all detectors in STAR begins to be digitized. During this time, the L2 system can use the information from the 4800 individual calorimeter towers to decide whether to keep the event or to abort the readout. The L2 system can use the full energy resolution of the calorimeter (a 10-bit ADC value, in contrast to the 6-bit ADC used at L0). The L2 trigger makes the decision by looking for calorimeter signatures consistent with the production of a high invariant mass electron-positron pair. (Since the L2 trigger uses BEMC information only and does not distinguish electrons from positrons, we will refer to electrons and positrons simply as “electrons” in all discussions of the L2 trigger.) At a minimum, one pair of candidate electrons is required. They are processed as follows. (We will denote kinematical quantities obtained in the L2 stage with the superscript “L2” to distinguish them from similar quantities obtained during the offline analysis.)
The algorithm starts by searching for all towers above the L0 High Tower threshold. Each of these is treated as a seed for a 3-tower cluster. To produce the clusters, we search in the - region around each High Tower, with a search window of towers. This area is smaller than the TP size in order to focus on electron finding, as our simulations show that electrons will likely have most of their energy contained in only 3 towers. We sort these 8 surrounding towers according to their measured energy and pick the two highest- towers in this list to produce a 3-tower cluster. This L2 tower clustering gives a better estimate of the electron energy compared to a single tower due to possible shower leakage into neighboring towers. If the energy of this 3-tower cluster is greater than 4.0 it is considered for further processing, and we label such clusters as “L2 Cluster-1”.
We next look for additional electron candidates in the event. While it is possible for an event to have two towers above the HT threshold, the majority of events will have only one. We select additional electron candidates by starting with towers which have (10-bit ADC of at least 75 counts after pedestal subtraction). Starting from these second seeds, we again construct 3-tower clusters (L2 Cluster-2) using the procedure outlined above. We require that the L2 Cluster-2 energy be . After the complete iteration to find electron clusters, we make all possible cluster pairs (where each pair must have at least one L2 Cluster-1) and calculate two pairwise quantities: the opening angle and the invariant mass of the pairs. These are calculated under the approximation that the vertex location is in the center of the detector and that the electrons travel in a straight line. Since the majority of the pairs from decays have a large opening angle (), we look for pairs with , where is the angle between the two clusters calculated in the L2 algorithm. With the combined information on the energy of the two clusters and their opening angle, we reconstruct the invariant mass via the approximate formula . We can neglect the electron mass of 0.511 as it would only contribute , which is small for ultra-relativistic electrons. For comparison, the straight-line approximation and the energy resolution result in a mass resolution of as will be discussed in the following section. We select events with cluster-pair invariant masses in the range . If there is any pair that satisfies both of the pairwise conditions in the event, the algorithm issues an L2 trigger.
III.3 Trigger Performance
In order to evaluate the trigger performance, we applied the Trigger II cuts to the Trigger I data. To do this, the exact same trigger condition was applied offline on the recorded values of the original trigger input data. Since events satisfying Trigger II cuts also satisfy Trigger I cuts, applying the tighter set of Trigger II cuts to the Trigger I data offline allows us to make a single dataset with uniform properties for the entire 2006 run. The integrated luminosity for Trigger I was (syst.) , and for Trigger II it was (syst.) , giving a total integrated luminosity of 7.9 0.6 , where the 7% uncertainty originates from the uncertainty in the BBC measurement of the cross section as determined by a van der Meer scan [22].

Figure 3 shows the ADC distribution of the tower with the largest for each candidate pair seen at the trigger level in an event (in very few cases we find more than one tower above the L0 threshold, so most events have only one candidate pair). The two triggered data sets are shown, with Trigger II displayed as squares and Trigger I (after applying Trigger II cuts) displayed as circles. The rejection factor achieved with Trigger II, defined as the number of minimum bias events counted by the trigger scalers divided by the number events where the trigger was issued, was found to be . The distributions seen at the trigger level only include information from the BEMC. This causes the trigger rate seen in the experiment to be dominated by background from di-jet events with two nearly back-to-back s. This di-jet background is removed offline when including tracking information from the TPC. The trigger distributions are scaled by the overall luminosity in order to compare the relative normalization of the two datasets. The scale is chosen such that the counts in each triggered dataset correspond to an integrated luminosity of 1 . The relative luminosity normalization between the datasets agrees to a level of . The solid-line histogram is from simulated after acceptance selection, requiring both electrons to deposit at least 1 GeV of energy in the BEMC. It shows the spectrum for the daughter with the highest ADC count. The spectrum for the simulated events that satisfy all the trigger requirements is shown as the dashed-line histogram. The vertical line at 16 ADC counts represents the L0 ADC threshold for Trigger II. In order to compare the size of the expected signal relative to the trigger background from di-jets, the histograms from the simulations for the are scaled with two factors. The first factor corresponds to normalizing to an integrated luminosity of 1 assuming a cross section times branching ratio into for the at midrapidity of 100 pb, chosen because it is of the expected order of magnitude. From this, we expect one upsilon every triggers, so we use a second multiplicative factor of 500 for display purposes. The spectral shape of the data in Fig. 3 is therefore dominated by di-jet background. The same normalization and scale factors are used in Figs. 4–6 for comparing the trigger-level background distributions and the expected signal.

Figure 4 shows the distribution of the L2 Cluster-1 energy for all clusters that include a tower above the HT DSM-ADC threshold of 16 ADC and that have their corresponding Trigger Patch DSM-ADC sum above the threshold of 19 ADC counts. It can be seen that the peak of the L2-cluster distribution near 6 is not right at the threshold of 4 (vertical line). This must happen because another trigger selection that is correlated to the measurement of the L2-cluster is being applied. In our case it is the L0 selection, which consists of both the HT and the TP requirement. Once we see a tower with energy above the HT threshold that is also in a trigger patch with energy above the TP threshold, the energy in the 3-tower cluster for that tower will likely already be above the L2 E1 threshold.

The distribution for the L2 opening angle is shown in Fig. 5. It is highly peaked towards back-to-back topologies, much more so than the distribution from simulated ’s. This again reflects the fact that the triggered distribution is dominated by back-to-back ’s. The majority of these are rejected offline when requiring the presence of a corresponding electron track in the TPC.

The L2 invariant mass distribution shown in Fig. 6 is peaked at 8 due to the cluster energy requirements. The vertical lines depict the lower and upper thresholds at 6 and 15 . The histogram shows the simulated before any trigger cuts (solid) and after passing all the previous thresholds (dashed). The trigger preferentially rejects lower L2-mass events, because these can happen when the energy clusters measured in the calorimeter are lower than their average, and these clusters are preferentially rejected by the algorithm. From these simulations we estimate the mass resolution of the L2 trigger to be . It is dominated by the BEMC energy resolution and by the straight-line approximation used to calculate the opening angle in the L2 trigger algorithm. This is about an order of magnitude larger than the offline mass resolution, where the electron trajectories and momenta are obtained from tracking. Since all the ’s that reach this stage are contained within the invariant-mass limits, this invariant mass cut serves mainly to reject background.
IV Acceptance and Trigger Efficiency
To determine the geometrical acceptance of the detector for measuring , we combined two types of events in the following way. For the first type, we performed GEANT simulations of the decays and propagated them through the detector geometry. The simulations were done with uniform population of the - phase space, folded with a Gaussian in () and a realistic distribution. We chose the form with the parameter obtained from a fit to CDF data [24]. The dependence of the acceptance on the choice of distribution is negligible. This was verified by using functional forms derived from data at lower energy. Each simulated decay was combined with a simulated minimum-bias event using the PYTHIA event generator [25] with CDF Tune A settings [26]. For the second type, we used a set of data collected by triggering on a RHIC bunch crossing. These were labeled “zero-bias” as they do not require signals in any of the STAR detectors. These zero-bias events do not always have a collision in the given bunch crossing, but given that in the 2006 run the dominant contribution to the TPC occupancy was from pileup, these events will include the pileup from out-of-time collisions and all detector effects. When the zero-bias events are combined with simulated events, they provide the most realistic environment to study the detector efficiency and acceptance. Each PYTHIA+ event was embedded into a zero-bias event. The vertex position chosen for the simulated event was sampled from a realistic distribution of event vertex positions obtained from the triggered data. With this procedure, we estimate both the trigger efficiency and the reconstruction efficiency (discussed in Sec. V).
For our purposes, a simulated is considered to fall in the acceptance of the detector if each of its decay electrons deposits at least 1 in a BEMC tower, as simulated by GEANT. We find that the acceptance depends strongly on the rapidity (), but weakly on its transverse momentum (). At the acceptance is 57%, dropping to below 30% beyond , and is close to zero beyond . This is illustrated in Fig. 7, where the downward triangles depict the geometrical acceptance of the BEMC detector obtained from the analysis of the simulated decays in the real data events.

For those simulated ’s that are accepted, we calculate the trigger efficiencies. This requires simulations of the BEMC response, digitization, and running the result through the offline reconstruction software chain. The HTTP requirement and the L2 trigger condition cut out an additional fraction of the events, and the combined acceptance and trigger efficiency is shown in Fig. 7. The squares include the effect of the HTTP trigger requirement and the upright triangles include the L2 trigger condition . The open circles include TPC acceptance plus tracking efficiency and TPC-BEMC matching . These selections, as well as the particle identification cuts, are discussed in Sec. V. For the region , the acceptance and efficiencies are given in Table 1.
| Quantity | Value |
|---|---|
| 0.57 | |
| 0.25 | |
| 0.21 | |
| 0.13 | |
| (1S+2S+3S) | 0.14 |
The relative systematic uncertainty on the L0 HT trigger efficiency was estimated to be and is the dominant source of systematic uncertainty of the trigger efficiency. The systematic uncertainties for the L0 efficiency are asymmetric because the underlying distribution of the daughter electrons is not flat in the threshold region (see Fig. 3). A shift to a higher threshold reduces the yield more than a shift to a lower threshold increases it. The L0 HTTP trigger has largest effect on the efficiency, as only 43% of the events in the acceptance remain after the trigger condition is applied. After including the L2 trigger, tracking, and TPC-BEMC matching efficiencies, we obtain a combined efficiency of 13.2% for the .
A similar procedure was applied to the and states, which have slightly higher efficiencies due to their larger masses. We calculated a weighted average among the 3 states, including the branching ratio and the ratio of cross sections, in order to obtain an average efficiency to be applied to the measured yield of (1S+2S+3S). For this we use the branching ratios compiled by the PDG [27], and cross section ratios from NLO pQCD calculations in the Color Evaporation Model (CEM). The calculation used a bottom quark mass of , the PDFs used are MRST HO [28], the choice of scale is , and the center-of-mass energy is GeV [16]. The branching ratios and cross sections we used for this purpose are shown in Table 2.
| state | (%) | (nb) |
|---|---|---|
| 2.380.11 | 6.60 | |
| 1.910.16 | 2.18 | |
| 2.180.21 | 1.32 |
This procedure results in a combined acceptance, trigger efficiency, track finding efficiency, and TPC-BEMC matching efficiency of 14.3% for the averaged (1S+2S+3S) combination, see the last row of Table 1. We estimate the sensitivity of the efficiency to the values in Table 2 in two ways. () By varying the branching ratio values by their uncertainty, we find that the efficiency varies in the range 14.2–14.4%. () Instead of using the numbers from Table 2, we can use measured values of the ratios / and / from Ref. [29]. No further input is needed because the weighted average of the efficiency does not depend on the overall scale of the cross section: it cancels out when averaging. By varying these measured ratios within their uncertainty we obtain weighted efficiencies in the range 14.1–14.4%. Therefore, our results do not depend strongly on the values in Table 2. In particular, the overall scale of the cross section from the NLO calculations has no direct impact on our results. Additional analysis cuts related to electron identification are discussed in the following section.
With thresholds of , the hadron rejection power of the BEMC towers at the energy relevant for decay daughters is . The main source of background for the trigger comes from high- ’s decaying into two photons that deposit energy in the BEMC. The BEMC will therefore trigger on two high- ’s with a large opening angle. These events are typically from di-jets. Since these are also produced by large–momentum-transfer events with low cross section, the trigger rate is sufficiently small even in the presence of this background, that the trigger can sample all collision events and is limited only by luminosity. The triggered distributions shown in Figs. 3–6 are dominated by the photon background. These background events are rejected in the offline analysis.
V Analysis
During the offline analysis, we use a complete emulation of the trigger to obtain all candidate BEMC tower pairs for an event. We use the TPC to select charged tracks and require that they point close in - to the position of the candidate clusters. The TPC also allows us to obtain improved electron kinematics compared to those derived from BEMC information available at the trigger level and to perform particle identification via specific ionization. The matching of TPC tracks to BEMC clusters is also useful for electron identification via the ratio .
Tracks are selected based on the number of TPC points found during the track pattern recognition and used in the fit to obtain the track kinematic parameters. The TPC tracks can have a maximum of up to 45 space points. We require that all tracks have at least 52% of their maximum possible points, and a minimum of 20 points. The first requirement guarantees we have no split tracks, and the second requirement sets a floor for those tracks which have a number of points smaller than 45 due to passing through inactive areas of the detector. We select tracks with to reject most low momentum tracks in a first pass. We do not impose higher requirements in the track selection stage because we also require matching with the BEMC, where , as discussed below. Tracks are also required to extrapolate back to a primary vertex found in the event. We find the combined TPC acceptance times tracking efficiency for detecting each daughter to be , and to be approximately independent of electron . Hence, the pairwise efficiency can be obtained by squaring the single particle efficiency.
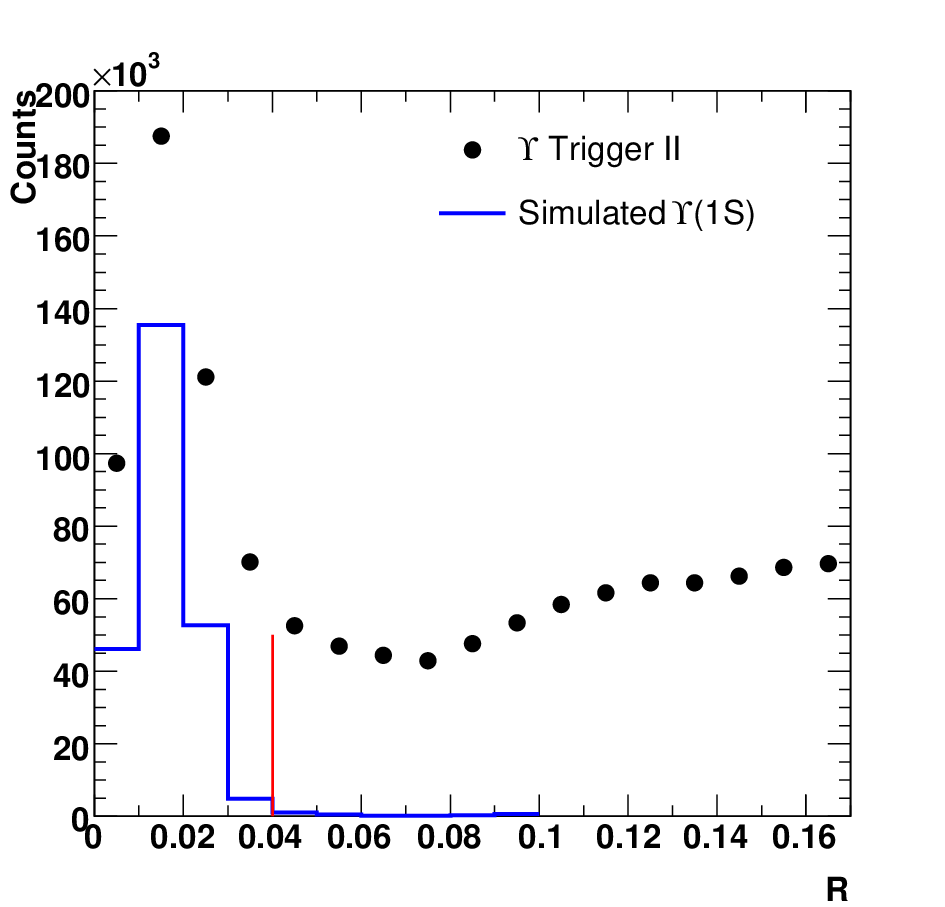
In order to guarantee that the analysis only uses tracks that could have fired the trigger, we impose a requirement that the tracks extrapolate close to the BEMC candidate towers. The requirement used was for them to be within a circle of radius in - space of the L2 candidate clusters. We find that this cut has an efficiency of for a given daughter electron, and has good background rejection power. This is illustrated in Fig. 8, which shows the distribution for simulated daughters as the line histogram. The distribution from tracks passing basic quality cuts in the triggered events is shown as the solid circles.
An important component of the analysis is the vertex-finding efficiency. We find that in contrast to minimum-bias events, the triggered events have a very high vertex-finding efficiency. The analysis benefits from the presence of the HT trigger, since these events are likely to have a high- track that facilitates the task of finding the vertex. We find that the vertex-finding efficiency for events is 96.4 .
In the 2006 run, the luminosity was high enough that there can be multiple primary vertices due to pileup events in the TPC. We find that about of the -triggered events have 2 or more vertices. For this analysis, we searched for candidates from all the vertices found in an event. We chose the vertex by requiring that the vertex also matched the high momentum TPC tracks that were already selected based on the BEMC tower extrapolation. Since the BEMC is read out after every bunch crossing, out-of-bunch pileup (interactions that happen before or after the triggered bunch crossing) is rejected by the TPC track–BEMC cluster matching requirement. We end up with a unique, unambiguous vertex in all events. Within-bunch pileup (multiple interactions in the same bunch crossing) is negligible for this analysis. Pileup rejection will become more important as the luminosity of RHIC is increased.
Electrons were identified by selecting charged particle tracks with specific ionization energy loss in the TPC consistent with the ionization expected for electrons. In the momentum region of interest ( ), there is overlap between electrons and charged pions, so a cut was placed that yielded an electron efficiency of . The cut was chosen to optimize the effective signal of single electrons, , where is the electron signal and is the hadron background. To do this, we construct a normal distribution of ionization measurements. We use the measured ionization of each track, compare it to the expected ionization for an electron and divide by the expected resolution (which depends on the track length and number of measurements). This yields a normalized Gaussian distribution of ionization measurements, . We fit this distribution with one Gaussian function to represent the electrons signal , and two Gaussian functions to model the background from pions and other hadrons.
In addition, we used the combined information of the EMC energy , as obtained by the 3-tower candidate clusters from L2, and the TPC track momentum to compute the ratio, which should be unity for ultra-relativistic electrons to a very good approximation.

Figure 9 shows the distribution comparison from an electron sample obtained from the Trigger I and II datasets (filled circles). Cuts were placed at , which is close to a 2 cut, given that fitting with a Gaussian gives . A shape that is approximately Gaussian is expected for the distribution due to the Gaussian shape of the resolution in both the energy measurement done in the BEMC and in the curvature measurement done in the TPC (curvature is proportional to ). We see that the distribution in the data shows a non-Gaussian tail. We studied the shape in several ways. To rule out distortions from misidentification of hadrons, we show only positrons to avoid any antiproton contamination and use tight cuts to select only a very high–purity electron sample. We studied the energy dependence (to rule out threshold effects near 4 and 2.5 ), isolation cuts on the electron tracks (to rule out contamination of the BEMC energy measurement from nearby charged particles), and the shape of embedded electrons and photons. We conclude that the tail at high has two sources:
- 1.
Electron bremsstrahlung. The solid line in Fig. 9 shows the simulated for electrons combined with a PYTHIA underlying event, embedded into zero-bias-triggered events. Many of these produce a Gaussian distribution, but we also see a tail. By selecting simulated electrons which undergo bremsstrahlung, we find cases in which the Monte Carlo momentum at the outermost TPC point differs from the momentum at the decay vertex by more than 100 . We then look at the of these electrons, and find that their mean is shifted. All entries in the region of the solid line in Fig. 9 come from these cases. Therefore, part of the non-Gaussian shape seen in the data is accounted for by electron bremsstrahlung in the detector material, and is included in the distribution of simulated daughters.
- 2.
Photon conversions. Events with a high- di-jet that include back-to-back ’s also fire the trigger. Some of the daughter photons will convert into pairs and leave a TPC track pointing at the EMC cluster. Generally, the and will strike the calorimeter near the sibling photon, resulting in a track with a high value. We analyzed these simulated events and applied the same tracking cuts, calorimeter clustering, and BEMC–TPC matching used in this paper to the resulting electrons. The distribution for the electrons in these simulated events is shown as the dashed line in Fig. 9, and we see a non-Gaussian tail extending to larger values than that of the electrons. The average for the electrons from events is compared to for electrons.
Of these two effects, the first needs to be taken into account in the efficiency because the daughters which undergo bremsstrahlung and have a resulting value outside our cut will be removed from the analysis. The second effect does not need to be included in the efficiency since it is not due to bottomonium events. These ––conversion events will appear in the invariant mass distributions, but they can be subtracted as follows. A single photon conversion produces an unlike-sign pair. When there are multiple photon conversions in an event, the combinations that can be made include unlike-sign and like-sign electron pairs. The unlike-sign pairs from a real photon will have zero invariant mass and do not affect the analysis. The additional unlike-sign combinatorial pairs will have a distribution that can be modeled by the like-sign combinations and are therefore removed when subtracting the like-sign pair combinatorial background.
Since the distribution in the -triggered dataset has both types of events, we reproduce the shape of the data using the two types of electron simulations: the electron distributions from events (including the bremsstrahlung tail) and from events. These are added and scaled to approximately fit the data in the region , shown as the dot-dashed line in Fig. 9.
As discussed above, we need to determine the efficiency for electrons only from sources. To do this, we use the embedding simulations to estimate the efficiency of our cut, which includes both the Gaussian shape expected from detector resolution and the non-Gaussian tail due to bremsstrahlung. The systematic uncertainty in the determination of the cut efficiency is dominated by the uncertainty in the knowledge of the detector material (and hence on the amount of bremsstrahlung), which was estimated to be a factor of 2. The material uncertainty is different from that quoted in previous STAR electron analyses because in this paper we do not restrict the event vertex to be near the center of the detector, where the material budget is lower and is better known. To estimate the uncertainty in the cut efficiency, we construct an distribution by splitting the original embedding simulation sample into electrons that undergo bremsstrahlung and electrons that do not. We scale the number of those that do by a factor of 2 and sum the two distributions to obtain a new distribution. The estimated efficiency found in the bremsstrahlung-augmented distribution is lower by , which we assign as the systematic uncertainty of . All the efficiencies used to obtain the cross section and their systematic uncertainties are collected in Table 4, below.
VI Results and Discussion
Once we have tracks that satisfy our criteria and are matched to tower clusters that satisfy all the L0 and L2 trigger requirements, we form electron-positron pairs to produce the invariant mass spectrum, using electron track momenta reconstructed in the TPC. We use the like-sign combinations of and to estimate the combinatorial background (see e.g. [30]) via
| (1) |
where denotes the unlike-sign pair differential invariant mass distribution and denotes the acceptance for unlike-sign pairs (similarly for the like-sign distributions). The symmetry of the BEMC and TPC for accepting unlike-sign and like-sign pairs makes the ratio of acceptances unity, so we only use for the combinatorial background. The unlike-sign and like-sign background invariant mass spectra are shown in Fig. 10.

VI.1 Line Shape
In this analysis, we cannot resolve individual states of the family due to the limited statistics, finite momentum resolution, and electron bremsstrahlung resulting from the large material budget during the 2006 run. Therefore, the yield reported here is for the combined (1S+2S+3S) states. The total dielectron unlike-sign yield after like-sign background subtraction has three contributions.
- 1.
The states.
- 2.
The Drell-Yan continuum.
- 3.
The - continuum.
In order to separate these three contributions, we obtain parametrizations for the expected shapes of each of the three components of the dielectron unlike-sign yield. The contribution from the states is obtained by the same simulations that were used to obtain the detector efficiency. The reconstructed invariant mass shape for the 1S, 2S, and 3S states are individually obtained. Each of the shapes from the simulation is fit with a functional form introduced by the Crystal-Ball experiment [31], which can accommodate detector resolution and losses due to bremsstrahlung in the detector material, and has the form:
| (2) |
Requiring that the function and its derivative be continuous constrains the constants and to be:
| (3) |
We fix the parameters of the three Crystal-Ball functions representing the three states and then adjust the relative scales according to the average branching ratios and according to the ratios of cross sections shown in Table 2. The overall integral of the Crystal-Ball functions combined this way is left as a free parameter in the fit, which allows us to obtain the yield.

Figure 11 shows the data used to obtain the and continuum yields. The data points are the unlike-sign signal after subtracting the like-sign combinatorial background. The background subtraction is done bin-by-bin. The error bars shown are statistical. The fit includes the contributions from the (1S+2S+3S) states and the continuum contributions from Drell-Yan and - shown as the solid-line function. The states are modeled with Eq. 2 to account for detector resolution and for losses due to bremsstrahlung which result in a tail to low values of invariant mass. The fit is done using the integral of the fit function in each bin, and is shown as the dashed-line histogram. We discuss next the procedure used to extract the continuum contributions (dot-dashed line) and the (1S+2S+3S) yield.
VI.2 Drell-Yan and - Continuum Contributions
The Drell-Yan continuum is parameterized from a pQCD NLO calculation [32] done in the kinematic range and . We convolute the calculated spectrum with the detector resolution (accounting for bremsstrahlung), but this introduces very small changes in the shape of the spectrum. We find that the shape of the Drell-Yan continuum is well described by a function of the form
| (4) |
with the parameters and .
The - contribution is parameterized from a simulation using PYTHIA 8 [25]. We turn on production of - pairs, and follow their fragmentation and subsequent decays of the B hadrons to look for dielectrons originating from the quarks. We convolute the simulated shape with the detector resolution and bremsstrahlung, and find that the shape is well described by a function of the form
| (5) |
with the parameters , , and .
Since the STAR trigger is meant to reject events with low invariant mass, we parametrize the trigger response on both continuum contributions by multiplying them with an error function
| (6) |
where is related to the trigger thresholds and describes the width of the turn-on of the error function due to finite detector resolution. We obtain the parameters from the like-sign data (Fig. 10) by multiplying the error function with an exponential to account for the random like-sign combinations at higher mass. We use the like-sign data since the trigger turn-on shape for like-sign and unlike-sign pairs is the same in our detector, but the like-sign invariant mass distribution is purely due to combinatorics and can be fit with the simple parametrization given above (Fig. 10, dashed line). The parameters are and .
To obtain the yields and cross section, we perform a fit of the unlike-sign invariant mass distribution after subtracting the like-sign background including contributions for the (1S+2S+3S), and the continuum due to Drell-Yan and -. Since the extracted yield from the fit will be sensitive to the continuum yield, we next discuss the effect that variations of the Drell-Yan and - cross sections can have on our result.
We find that the resulting shapes of the two continuum contributions are very similar. We can fit the continuum yield using the parameterized Drell-Yan and - contributions. The 1- and 2- contours in the 2-D parameter space vs. are shown in Fig. 12, where the cross sections quoted are corrected for efficiency and acceptance, and measured in the phase space region and 8 11 .

The fit shows a strong anti-correlation between the Drell-Yan and the - cross sections due to the similarity of the parameterized shapes. The shape of the Drell-Yan is slightly favored by our data, and we obtain the minimal for a Drell-Yan cross section of 38 pb with a negligible - contribution. The fit gives . The prediction from an NLO calculation of the Drell-Yan cross section [32] is shown as the vertical line at 38.6 pb, and is consistent with values in the 1- region (horizontal lines). Our data also allow values of the - cross section up to 15 pb within the 1- range, provided the Drell-Yan yield is reduced. Given the anti-correlation, our data are mainly sensitive to the sum of the two cross sections, and within the 1- contour the allowed range for the sum of cross sections is pb. This variation is taken into account in the fit to extract the yield, and is included in the quoted uncertainty.
VI.3 yield and cross section
The fitting function in Fig. 11 includes a total of three free parameters: the yield, the Drell-Yan yield and the - yield. This allows us to extract the yield directly, automatically including () the statistical uncertainty for each mass bin in Fig. 11, and () the uncertainty due to the anti-correlation between the continuum contributions and the contribution. To compare the yield extraction using a different method, one can also perform bin counting. There are two ways to do this. One method is to take the background-subtracted unlike-sign yield directly from the data shown in Fig. 11, where the background subtraction is done for each mass bin. We then sum the resulting histogram in the mass region of the peak, 8–11 . This sum includes the yield and the continuum contribution, so we subtract from it the contribution from the Drell-Yan and - continuum obtained in the fit. A second method is to sum the yield of the unlike-sign () in the region 8–11 , do the same for the like-sign positive (), and like-sign negative (), and then do the subtraction . In other words, in the first method we do the subtraction bin-by-bin and then do the sum, in the second method we do the sum first to get a single bin and then we do the subtraction. The results for estimating from the combined fit, the bin-by-bin counting method, and the single-bin counting method, are shown in Table 3.
| Fitting Results | |
|---|---|
| 80.9 | |
| counts | |
| Bin-by-bin Counting | |
| 82.7 | |
| counts | |
| Single-bin Counting | |
| counts |
The quoted uncertainty in is listed for the single-bin counting method, which is obtained from a straightforward application of the statistical errors of the corresponding yields (, , ). It amounts to a contribution of 26% to the uncertainty, and originates only from counting statistics. In addition to this purely statistical uncertainty, we must also take into account the uncertainty of the continuum subtraction. This part of the uncertainty is obtained from the fitting method in all the quoted counts in the Table. It should be noted that one cannot use counting statistics to estimate the uncertainty on the yield due to the continuum subtraction. The reason is that the and continuum yields are obtained from the same data, namely the invariant mass dielectron spectrum in Fig. 11. The two yields are therefore anti-correlated: a larger continuum yield reduces the extracted counts. One must take this anti-correlation into account in the estimation of the uncertainty on the yield. The best way to do this is to use the fitting method. In the fit, both the statistical precision of the invariant mass spectrum and the anti-correlation between the and continuum yields in the estimation of the uncertainty are taken into account when varying the yield and the continuum yield to minimize the . We find the uncertainty from the fit to be 33% of the yield, and we hence use this fitting-method result to estimate the uncertainty in all the yields quoted in Table 3. We quote this as the “stat. + fit” uncertainty in our cross section result. It should be noted that with the statistics of the present analysis, we find that the allowed range of variation of the continuum yield in the fit is still dominated by the statistical error bars of the invariant mass distribution, and so the size of the 33% uncertainty is mainly statistical in nature. However, we prefer to denote the uncertainty as “stat. + fit” to clarify that it includes the estimate of the anti-correlation between the and continuum yields obtained by the fitting method. A systematic uncertainty due to the continuum subtraction can be estimated by varying the model used to produce the continuum contribution from -. These variations produce a negligible change in the extracted yield with the current statistics.
When comparing different counting methods in Table 3, we see that the difference between the bin-by-bin counting method and the fitting method is negligible. The single-bin counting method yield is lower than the one from the bin-by-bin counting method by 9%, and we assign this as a component of the systematic uncertainty.
Table 3 also lists the yield of (1S+2S+3S). In the fitting method, the yield and the quoted uncertainty is obtained directly from the fit, as well as the contribution from Drell-Yan and - discussed in the previous section. This has the advantage that the uncertainty due to the continuum subtraction and the correlations between the , Drell-Yan and - contributions are automatically taken into account when exploring the parameter space. The disadvantage is that there is a model dependence on the line-shapes used for the fit. In the counting methods, to extract the yield we subtract the continuum contribution obtained from the fit. This reduces the model dependence on the line shape. However, we must still account for the uncertainty in the estimate of the continuum contribution in the determination of the yield uncertainty. Since this uncertainty should include similar correlations between the yield and continuum yields as found in the fitting method, the relative uncertainties should be approximately equal. Therefore, we use the same relative yield uncertainty for the counting methods as for the fitting method. To get the total yield we must correct the above numbers for the yield outside the integration region. This correction can be obtained from the fitted Crystal-Ball functions, and gives an additional 9% contribution to the yield. We report results for the cross section using the bin-by-bin counting method.
In order to transform the measured yield of (1S+2S+3S) into a cross section, we applied several correction factors:
| (7) |
where the symbols are as follows. is the branching fraction for . is the cross section for the S state in the region . (stat.) is the measured (1S+2S+3S) yield from the bin-by-bin counting method in Table 3 with a 9% correction to account for the yield outside . is the rapidity interval for our kinematic region . The total efficiency for reconstructing members of the family is the product , where the symbols are as follows. is the BEMC geometrical acceptance. is the vertex-finding efficiency. and are the trigger efficiencies for L0 and L2, respectively. is the TPC geometrical acceptance times tracking efficiency for reconstructing both daughters in the TPC. is the TPC-BEMC - matching efficiency. is the electron identification efficiency from the specific ionization requirement, and is the electron identification efficiency from the selection.
We find for the cross section at midrapidity in GeV collisions the result
| (8) |
The uncertainties quoted are the 33% statistical+fit uncertainty (mentioned in the discussion of Table 3) and the systematic uncertainty, respectively.
The major contributions to the systematic uncertainty are: the uncertainty in the choice of bin-counting method, the uncertainty in the integrated luminosity, the uncertainty in the BBC efficiency for NSD events and the uncertainty in the L0 trigger efficiency for events. The polarization of the states also affects the estimation of the geometrical acceptance. We estimate this uncertainty by comparing simulations of fully longitudinal and fully transverse decays and comparing the acceptance of these cases with the unpolarized case. A list of all corrections and systematic uncertainties in the procedure to extract the cross section is compiled in Table 4. The combined systematic uncertainty is obtained by adding all the sources in quadrature. Note that the single-particle efficiencies enter quadratically when reconstructing dielectron pairs, so we multiply the single-particle uncertainty by a factor of 2 when estimating the pairwise uncertainty.
| Quantity | Value | Syst. uncertainty on (%) |
|---|---|---|
| 82.7 | ||
| 7.9 pb-1 | ||
| 0.87 | ||
| 0.57 | ||
| 0.96 | ||
| 0.43 | ||
| 0.85 | ||
| 0.852 | ||
| 0.932 | ||
| 0.842 | ||
| 0.932 | ||
| Combined | pb |

The result we obtain for the cross section is shown in Fig. 13, where the datum point given by the star symbol is our measurement, the error bars and the box depict the statistical and systematic uncertainties, respectively. To illustrate the acceptance in rapidity, we also show the unlike-sign pairs after like-sign background subtraction, , in the region as a hashed histogram. The scale on the right axis of the figure is used for the counts in the histogram, and the scale in the left axis of the figure is used for the cross section. We compare our measurement with NLO CEM predictions [32] of the rapidity distribution. Since we measure all three states and only in the dielectron channel, the calculation of the is scaled by a factor
| (9) |
in order to compare it to our measurement of the cross section for all three states. The branching ratios and cross sections used for this scale factors are those from Table 2. The calculation is in agreement with our measurement. The two dotted lines in the plot are the upper and lower bounds of the cross section obtained from a calculation in the CSM for direct production [18] based on NLO code developed for quarkonium production at hadron colliders [33]. Since the calculation is for the 1S state alone and for direct production (ignoring feed-down from P-states), to compare to our measurement, which includes all 3 states and feed-down contributions, the values from the calculation were divided by a factor 0.42 to account for this (see Ref [18] for details). The bounds in the calculation are obtained by varying the bottom quark mass and the renormalization and factorization scales. The CSM prediction is lower than our data, indicating that additional contributions are needed beside production via color singlet.

In Fig. 14, we also compare our (1S+2S+3S) result with measurements done in , and collisions at center-of-mass energies ranging from 20 GeV up to 1.8 TeV [34, 35, 36, 37, 29, 38, 39, 40, 41, 24], and to NLO CEM predictions [16] for a wide range of center-of-mass energies.
Our result is consistent with the overall trend, and provides a reference for bottomonium production at the top RHIC energy.
VII Conclusions
The STAR experiment has measured the cross section at midrapidity, , in collisions at GeV to be pb. Calculations done in the Color Evaporation Model at NLO are in agreement with our measurement, while calculations in the Color Singlet Model underestimate our cross section by . Our result is consistent with the trend as a function of center-of-mass energy based on data from other experiments. We report a combined continuum cross section, Drell-Yan plus -, measured in the kinematic range and , of pb. The STAR measurement presented here will be used as a baseline for studying cold and hot nuclear matter effects in +Au and Au+Au collisions, as the relatively clean environment provided by the STAR high-mass dielectron trigger permits the approach outlined in this paper to be deployed up to the most central Au+Au collisions. With increased luminosity, a better determination of the cross section, its dependence and a separation of the 2S and 3S states will be possible. The projected luminosity upgrades to RHIC should increase the yield to in and in Au+Au collisions during one RHIC year [16]. The increased statistics will greatly reduce the uncertainty in the determination of the continuum cross section and will allow a thorough study of the bottomonium sector by resolving the 2S and 3S states.
The authors thank R. Vogt and J.-P. Lansberg for providing several calculations and for useful discussions. We thank the RHIC Operations Group and RCF at BNL, the NERSC Center at LBNL and the Open Science Grid consortium for providing resources and support. This work was supported in part by the Offices of NP and HEP within the U.S. DOE Office of Science, the U.S. NSF, the Sloan Foundation, the DFG cluster of excellence ‘Origin and Structure of the Universe’ of Germany, CNRS/IN2P3, STFC and EPSRC of the United Kingdom, FAPESP CNPq of Brazil, Ministry of Ed. and Sci. of the Russian Federation, NNSFC, CAS, MoST, and MoE of China, GA and MSMT of the Czech Republic, FOM and NWO of the Netherlands, DAE, DST, and CSIR of India, Polish Ministry of Sci. and Higher Ed., Korea Research Foundation, Ministry of Sci., Ed. and Sports of the Rep. Of Croatia, Russian Ministry of Sci. and Tech, and RosAtom of Russia.
References
- [1] T. Matsui and H. Satz, Phys. Lett. B 178, 416 (1986)
- [2] S. Gavin, M. Gyulassy, and A. Jackson, Phys. Lett. B 207, 257 (1988)
- [3] J.-P. Blaizot and J.-Y. Ollitrault, Phys. Rev. D 39, 232 (1989)
- [4] L. Grandchamp, R. Rapp, and G. E. Brown, Phys. Rev. Lett. 92, 212301 (2004)
- [5] R. L. Thews et al., Eur. Phys. J. C 43, 97 (2005)
- [6] A. Andronic et al., Nucl. Phys. A 789, 334, (2007), doi:10.1016/j.nuclphysa.2007.02.013.
- [7] S. Digal, P. Petreczky and H. Satz, Phys. Rev. D 64, 094015 (2001) [arXiv:hep-ph/0106017].
- [8] J. F. Gunion and R. Vogt, Nucl. Phys. B 492, 301 (1997) [arXiv:hep-ph/9610420].
- [9] M. Cacciari, P. Nason and R. Vogt, Phys. Rev. Lett. 95, 122001 (2005) [arXiv:hep-ph/0502203].
- [10] Z. w. Lin and C. M. Ko, Phys. Lett. B 503, 104 (2001) [arXiv:nucl-th/0007027].
- [11] D. M. Alde et al., Phys. Rev. Lett. 66, 2285 (1991).
- [12] A. Mocsy and P. Petreczky, Phys. Rev. Lett. 99, 211602 (2007) [arXiv:0706.2183 [hep-ph]].
- [13] S. Digal, P. Petreczky and H. Satz, Phys. Lett. B 514, 57 (2001) [arXiv:hep-ph/0105234].
- [14] C.-Y. Wong, Phys. Rev. C 72, 034906 (2005)
- [15] A. Mocsy and P. Petreczky, Phys. Rev. D 77, 014501 (2008) [arXiv:0705.2559 [hep-ph]].
- [16] A.D. Frawley, T. Ullrich and R. Vogt, Phys. Rept. 462, 125 (2008)
- [17] T. Kollegger, Ph.D. thesis, Johann Wolfgang Goethe-Universität Frankfurt am Main (2005).
- [18] S. J. Brodsky and J. P. Lansberg, Phys. Rev. D 81, 051502(R) (2010) arXiv:0908.0754 [hep-ph].
- [19] M. Anderson et al., Nucl. Instr. Meth. A 499, 659 (2003)
- [20] M. Beddo et al., Nucl. Instr. Meth. A 499, 725 (2003)
- [21] J. Kyriluk [STAR Collaboration], 16th International Spin Physics Symposium Proc., 718 (2005) [arXiv:hep-ex/0501072].
- [22] J. Adams et al. [STAR Collaboration], Phys. Rev. Lett. 91, 172302 (2003) [arXiv:nucl-ex/0305015].
- [23] F. S. Bieser et al., Nucl. Instrum. Meth. A 499, 766 (2003).
- [24] D. E. Acosta et al. [CDF Collaboration], Phys. Rev. Lett. 88, 161802 (2002).
- [25] T. Sjostrand, arXiv:0809.0303 [hep-ph].
- [26] R. Field and R. C. Group [CDF Collaboration], arXiv:hep-ph/0510198.
- [27] C. Amsler et al. [Particle Data Group], Phys. Lett. B 667, 1 (2008).
- [28] A. D. Martin, R. G. Roberts, W. J. Stirling and R. S. Thorne, Eur. Phys. J. C 4, 463 (1998) [arXiv:hep-ph/9803445].
- [29] G. Moreno et al., Phys. Rev. D 43, 2815 (1991).
- [30] M. C. Abreu et al. [NA38 and NA50 Collaborations], Eur. Phys. J. C 14, 443 (2000).
- [31] J. Gaiser, Ph.D. Thesis, SLAC-R-255, Appendix F., p. 178.
- [32]
R. Vogt, Calculations vs. in [16], calculations
vs. rapidity and for Drell-Yan shown in RHIC-II Science Workshop
April 28-30, 2005.
http://rhicii-science.bnl.gov/heavy/doc/April05Meeting/ - [33] J. M. Campbell, F. Maltoni and F. Tramontano, Phys. Rev. Lett. 98, 252002 (2007) [arXiv:hep-ph/0703113].
- [34] J. K. Yoh et al., Phys. Rev. Lett. 41, 684 (1978) [Erratum ibid. 41, 1083 (1978)].
- [35] K. Ueno et al., Phys. Rev. Lett. 42, 486 (1979).
- [36] S. Childress et al., Phys. Rev. Lett. 55, 1962 (1985).
- [37] T. Yoshida et al., Phys. Rev. D 39, 3516 (1989).
- [38] L. Camilleri, In the Proceedings of 9th International Symposium on Lepton and Photon Interactions at High Energy, Batavia, Illinois, 23-29 Aug 1979, p. 228.
- [39] C. Kourkoumelis et al., Phys. Lett. B 91, 481 (1980).
- [40] A. L. S. Angelis et al. [CCOR Collaboration], Phys. Lett. B 87, 398 (1979).
- [41] C. Albajar et al. [UA1 Collaboration], Phys. Lett. B 186, 237 (1987).